
Economic headwinds are coming. Can gold outshine the S&P 500 over the next 10 years?
Inflation sticks around, and growth feels shaky. Your investment choices matter now more than ever.
Using data from the World Gold Council, we dive into history, key factors like interest rates and company profits, future outlooks, and risks. Get ready for the big reveal!
Gold vs. S&P 500: How They've Performed Historically
- Over the last 50 years, gold's compound annual growth rate (CAGR)-the average yearly return-hit 7.8%. That lags behind the S&P 500's 10.2%.
- Gold shows less ups and downs. Its standard deviation (a measure of price swings) is 15.2%, compared to 15.8% for the S&P 500, per Bloomberg data.
Key Metrics: Gold vs. S&P 500 at a Glance
#p6ecyduz.bar-container { position: relative; overflow: visible; } #p6ecyduz.bar-value { position: absolute; left: 50%; top: 50%; transform: translate(-50%, -50%); color: white; font-weight: 700; font-size: 14px; white-space: nowrap; background: rgba(0, 0, 0, 0.7); padding: 4px 12px; border-radius: 20px; z-index: 30; text-shadow: 0 1px 2px rgba(0, 0, 0, 0.3); pointer-events: none; display: inline-block; } #p6ecyduz.animated-bar { z-index: 1; } @media (max-width: 768px) { #p6ecyduz { padding: 16px; } #p6ecyduz h2 { font-size: 24px; } #p6ecyduz h3 { font-size: 16px; } #p6ecyduz.bar-label { font-size: 12px; } #p6ecyduz.metric-card { padding: 20px; } #p6ecyduz.bar-value { font-size: 13px; padding: 3px 10px; } } @media (max-width: 480px) { #p6ecyduz { padding: 12px; } #p6ecyduz h2 { font-size: 20px; } #p6ecyduz h3 { font-size: 14px; } #p6ecyduz.bar-label { font-size: 11px; margin-bottom: 6px; } #p6ecyduz.bar-value { font-size: 12px; padding: 2px 8px; min-width: 45px; text-align: center; } #p6ecyduz.bar-container { height: 36px; overflow: visible; } }
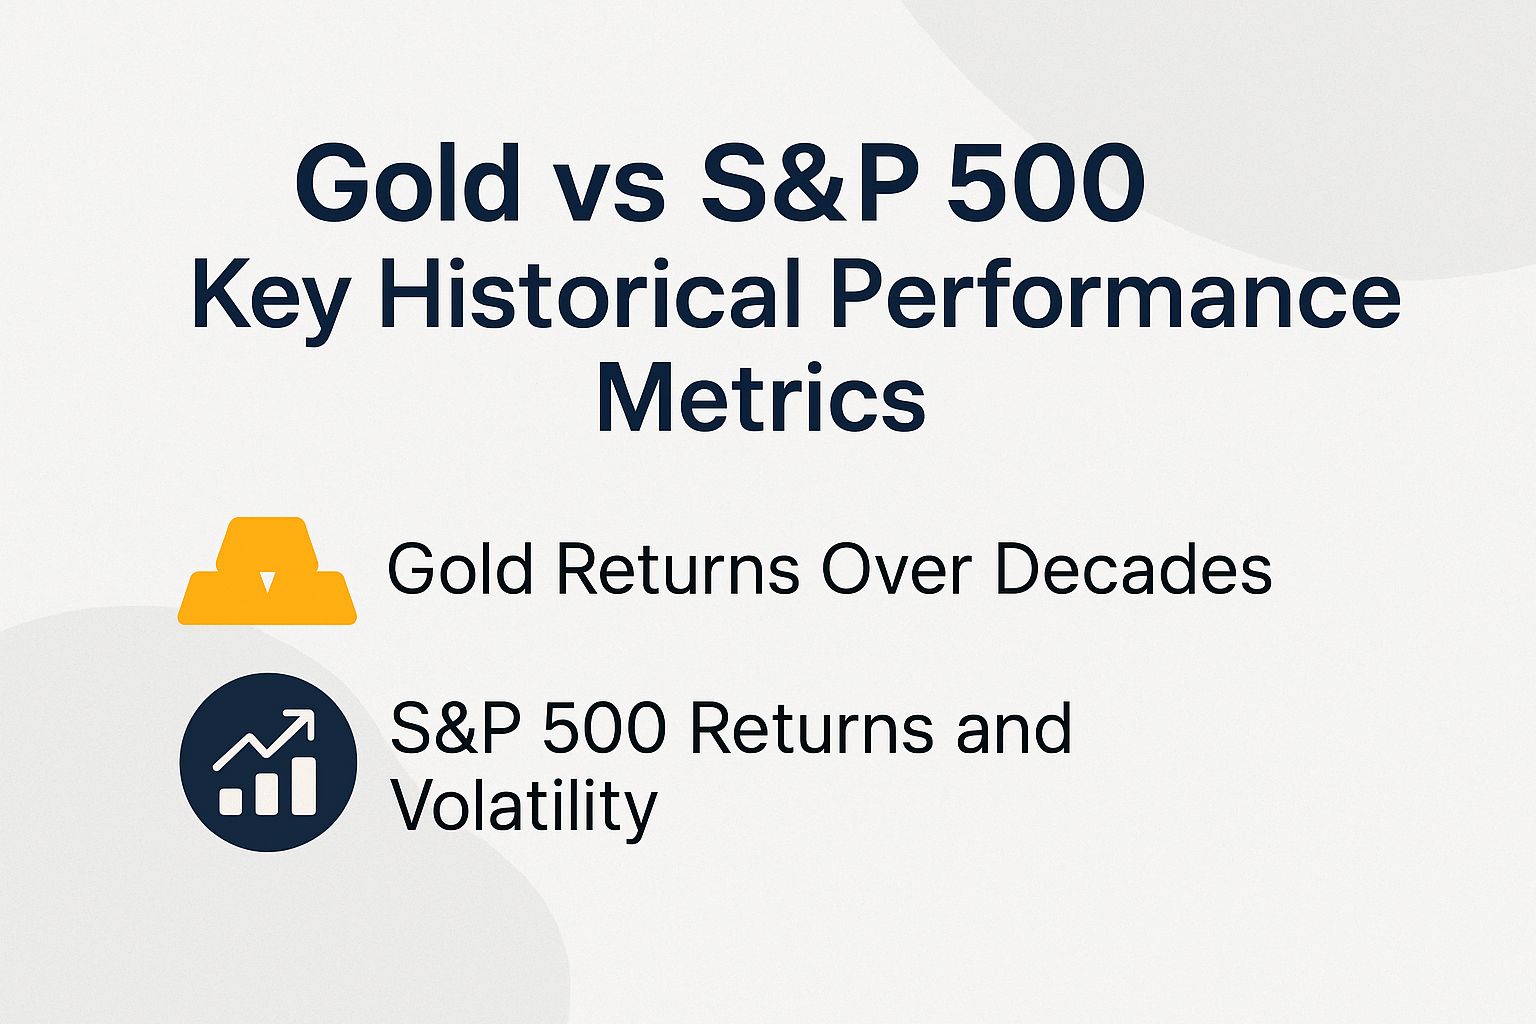
Gold vs S&P 500 Key Historical Performance Metrics
The Gold vs S&P 500 Key Historical Performance Metrics comparison offers a critical lens into two cornerstone assets in investment portfolios: gold as a safe-haven commodity among commodities and the S&P 500 as a broad equity index representing U.S. stock market performance. Historically, these metrics reveal divergent behaviors, helping investors balance growth potential against stability during economic uncertainties.
Over long-term periods, such as from 1971 to 2023, the S&P 500 has delivered an annualized return of approximately 10-11%. This growth comes from rising corporate earnings and a booming economy.
Gold offers about 7-8% annual returns. It performs best during high inflation or global unrest, like the 1970s when it rocketed over 2,300%-beating the S&P 500’s weak gains and proving its power as an inflation shield, while stocks shine in stable growth times.
- Volatility Metrics: The S&P 500 swings more wildly, with a standard deviation-a measure of return fluctuations-of 15-20% each year due to market ups and downs and business risks. Gold stays steadier at 10-15% volatility, offering smoother rides but no dividend payouts, so it’s not ideal if you need steady income.
- Risk-Adjusted Returns: Sharpe ratios measure bang for your risk buck-the S&P 500 hits 0.4-0.6 over decades, delivering strong rewards in booming markets. Gold’s ratio sits at 0.2-0.4 but jumps higher in tough times, like 2008 when it gained 5% as the S&P 500 crashed 37%-talk about a lifesaver!
- Correlation Analysis: These assets show low to negative correlation, often below 0.2, enabling diversification. In crises like the 2020 pandemic, gold climbed 25% as the S&P 500 initially dropped 34% before recovering, demonstrating gold’s counter-cyclical nature.
Drawdowns show the biggest drops. The S&P 500 suffered huge hits, like 49% in the dot-com bust and 57% in the Great Recession, with comebacks taking years.
Gold’s drops top out at 40-50%, less severe but slower to bounce back than stocks. When adjusted for inflation, gold holds your buying power steady with near-zero real returns over 50 years, while the S&P 500 delivers exciting 6-7% real gains annually.
Build your portfolio smartly by mixing in 5-10% gold with S&P 500 stocks. Backtests prove this cuts risks, boosts returns, and smooths out bumps-don’t miss out on this winning combo!
The S&P 500 builds your wealth over time. Gold protects against rare disasters, making them perfect partners for a balanced, exciting investment plan.
Gold Returns Over Decades
Gold prices swing decade by decade based on supply, demand from mining, jewelry, and industry needs. Check historical data from Kitco and Federal Reserve reports for the full picture-no table needed, just dive into the trends!
- Supply and demand shifts
- Mining output changes
- Jewelry buying trends
- Industrial applications
| Decade | CAGR (%) | Volatility (%) |
|---|---|---|
| 1970s | 35 | 25 |
| 1980s | -2.5 | 20 |
| 1990s | 0.5 | 15 |
| 2000s | 15.2 | 18 |
| 2010s | 1.8 | 12 |
| 2020s YTD | 8.5 | 14 |
Principal factors influencing gold prices and spot gold for precious metals included the 1980 peak of $850 per ounce, driven by oil shocks and geopolitical risks and instability.
Retrospective analysis demonstrates that a $10,000 investment in 1971 would have appreciated to $4.8 million by 2023; nevertheless, periods of significant drawdown occurred, such as a 70% real-term decline from 1980 to 2000 when adjusted for 3% annual inflation rate.
Investors are recommended to achieve diversification through index funds and exchange-traded funds (ETFs), such as Gold ETFs like GLD, to manage associated volatility and storage costs.
S&P 500 Returns and Volatility
The S&P 500, comprising blue-chip companies and tech stocks in the US economy, has achieved an average annual return of 10.2% since 1957, with dividends and yield comprising 40% of the total returns through price appreciation. However, it has endured significant drawdowns of up to 50% during bear markets, such as the 2008 financial crisis, as reported by S&P Dow Jones Indices data.
To provide historical context, performance has varied considerably across economic cycles, bull markets, and decades.
| Decade | CAGR | Std Dev |
|---|---|---|
| 1970s | 5.9% | 17% |
| 1980s | 17.5% | 15% |
| 1990s | 18.2% | 14% |
| 2000s | -0.9% | 16% |
| 2010s | 13.6% | 12% |
| 2020s YTD | 12.5% | 18% |
Source: CRSP US Stock Database via Morningstar and financial news sources like CNBC.
This volatility is evidenced by a Sharpe ratio of 0.65, which exceeds that of gold at 0.45.
The index maintains a beta of 1.0 and has been supported by an average annual earnings growth rate of 12%, facilitating its recoveries.
For instance, during the 2020 COVID-19 market downturn, amid high VIX, shifting investor sentiment, and the Fear and Greed Index signaling caution, the S&P 500 declined by 34% over 33 days but fully recovered within five months, demonstrating its resilience for long-term investors.
Future Outlook and Additional Considerations
In the future outlook, market predictions from analyst opinions suggest that factors like central banks’ monetary policy, quantitative easing, bond yields, Treasury bonds, and dollar strength will influence whether gold can outperform the S&P 500 over the next 10 years. Geopolitical risks, currency fluctuations in the global economy, and US economy indicators such as GDP growth, unemployment rate, consumer confidence, and CPI for the inflation rate play key roles in economic cycles of growth economy and bear markets.
For investment strategy, consider alternative investments like real estate, cryptocurrencies including Bitcoin, alongside mining stocks and precious metals such as silver. Use index funds, Gold ETFs, and monitor ETF holdings, central bank reserves, and short interest for better asset allocation.
Forecasting via technical analysis, including chart patterns, moving averages, RSI, and MACD, aids in options trading, futures market participation, and managing leverage and margin. Investors should account for capital gains, capital gains tax, tax implications, transaction costs, liquidity, as well as for gold: bullion, coins, bars, and storage costs, ensuring comprehensive portfolio management amid commodities and stock market dynamics.
Key Drivers of Gold Prices
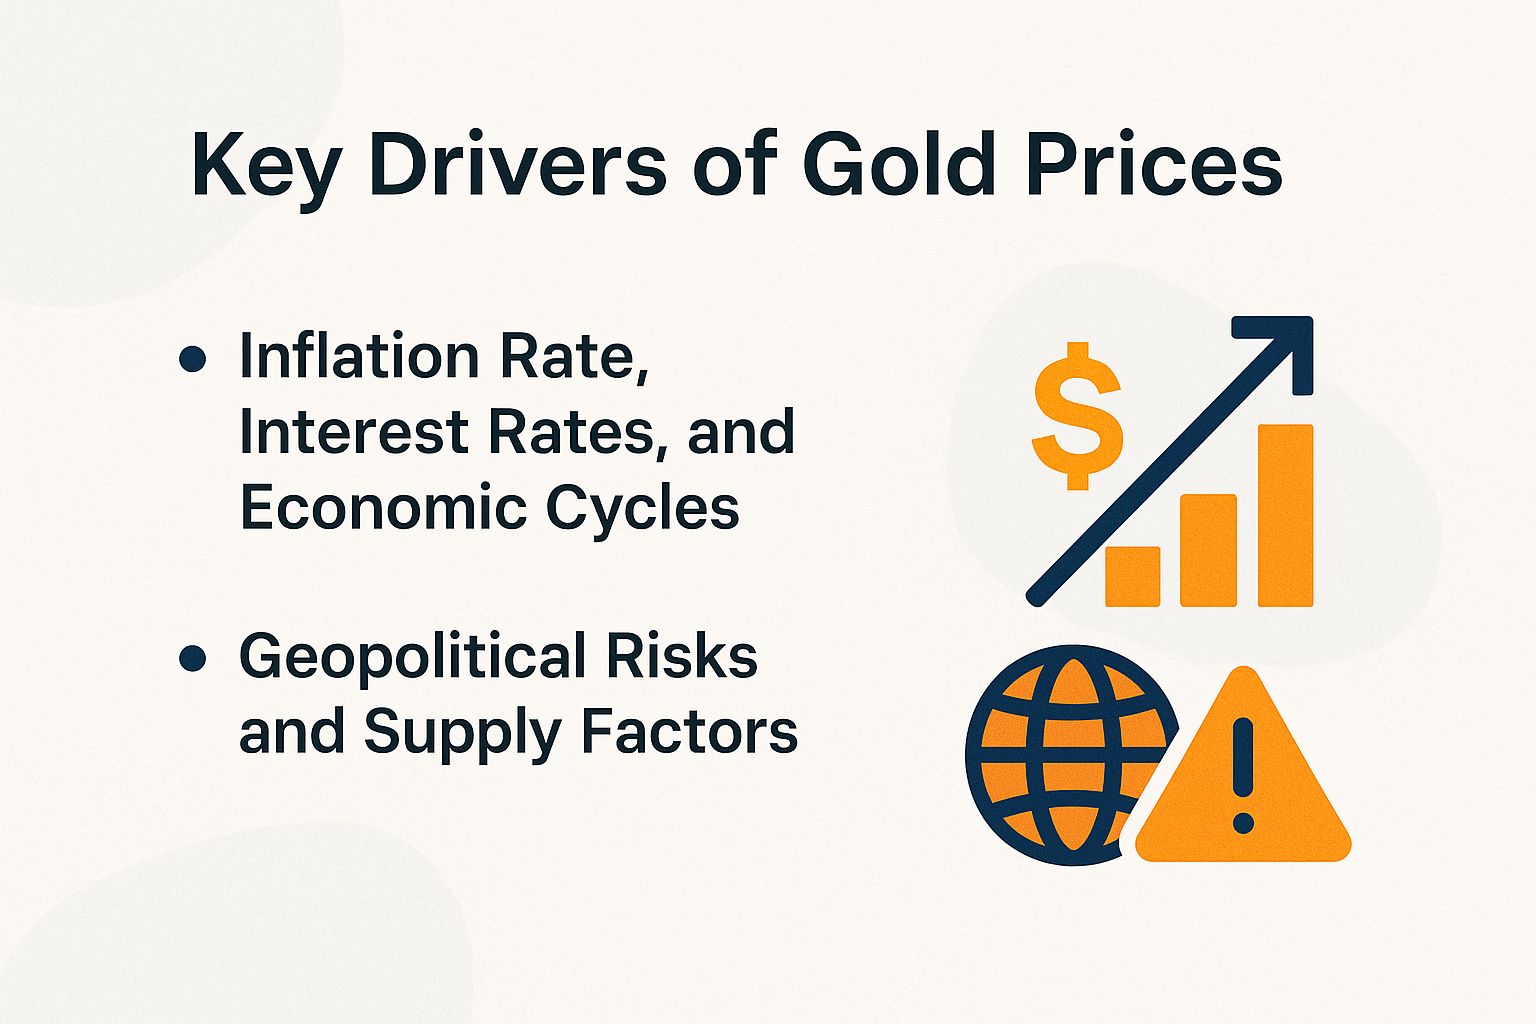
Gold prices, a benchmark for precious metals and commodities, which averaged $1,800 per ounce in 2023 according to London Bullion Market Association (LBMA) data, are predominantly influenced by gold’s function as an inflation hedge and safe-haven asset. This is evidenced by a 0.7 correlation between gold prices and changes in the Consumer Price Index (CPI) over the past 20 years, as reported in International Monetary Fund (IMF) research.
Inflation Rate, Interest Rates, and Economic Cycles
Gold has demonstrated a historical annual return of 8.5% during periods of inflation exceeding 5%, as evidenced in the 1970s when the Consumer Price Index (CPI) reached 13.5%, according to data from the Bureau of Labor Statistics. This performance underscores gold’s role as a reliable store of value amid diminishing purchasing power.
Gold prices often rise when real interest rates drop. Real interest rates mean nominal rates minus inflation.
When they fall below 1%, history shows gold climbs 15-20% on average. The Federal Reserve Bank of San Francisco’s 2011 Economic Letter backs this up, tied to big money policy shifts.
Take 2022: The Federal Reserve hiked rates from 0% to 5.5% as part of tighter money policies, skipping quantitative easing.
Gold prices dropped 10% at first, showing how it reacts oppositely to rate jumps.
Data analysis shows this link: Gold return equals -1.2 times real yield change plus inflation premium. It has an R-squared of 0.55 from Bloomberg data, meaning it explains over half the variation.
High yields raise the cost of missing out on other investments. At 4% Treasury bond rates, gold lags stocks by 3-4% each year, per Vanguard research.
Want to time your gold buys? Check the Federal Open Market Committee (FOMC-the group that sets U.S. interest rates) minutes on the Fed’s site now-they reveal key rate hints!
Geopolitical Risks and Supply Factors
Geopolitical risks spike gold prices fast. The 2022 Russia-Ukraine war pushed them up 10% in weeks.
Supply issues hurt too. Strikes at South African mines in 2019 cut production 5%, per USGS reports, shaking supply-demand balance.
Other key factors influencing gold prices include:
- Wars and crises, such as the 2003 Iraq War, which increased prices by 15% as investors sought safe-haven assets (Council on Foreign Relations reports).
- Central banks buying gold boosts reserves-China grabbed 2,200 tons from 2010-2023 (World Gold Council). This signals steady demand from jewelry and industry too.
- Mining supplies about 3,000 tons yearly. A 1% drop could hike prices 5% and hit mining stocks.
- ETFs-funds that track gold prices for easy investing-drive demand surges; holdings in funds like GLD jump 20% in recessions.
Remember the 2011 Eurozone debt crisis? It rocketed gold to $1,900 an ounce with $300 billion extra demand!
Hedge smart-put 5-10% of your portfolio in gold if the VIX (fear gauge index) tops 30. Grab easy ETFs like GLD to start.
Key Drivers of Stock Market and S&P 500 Performance
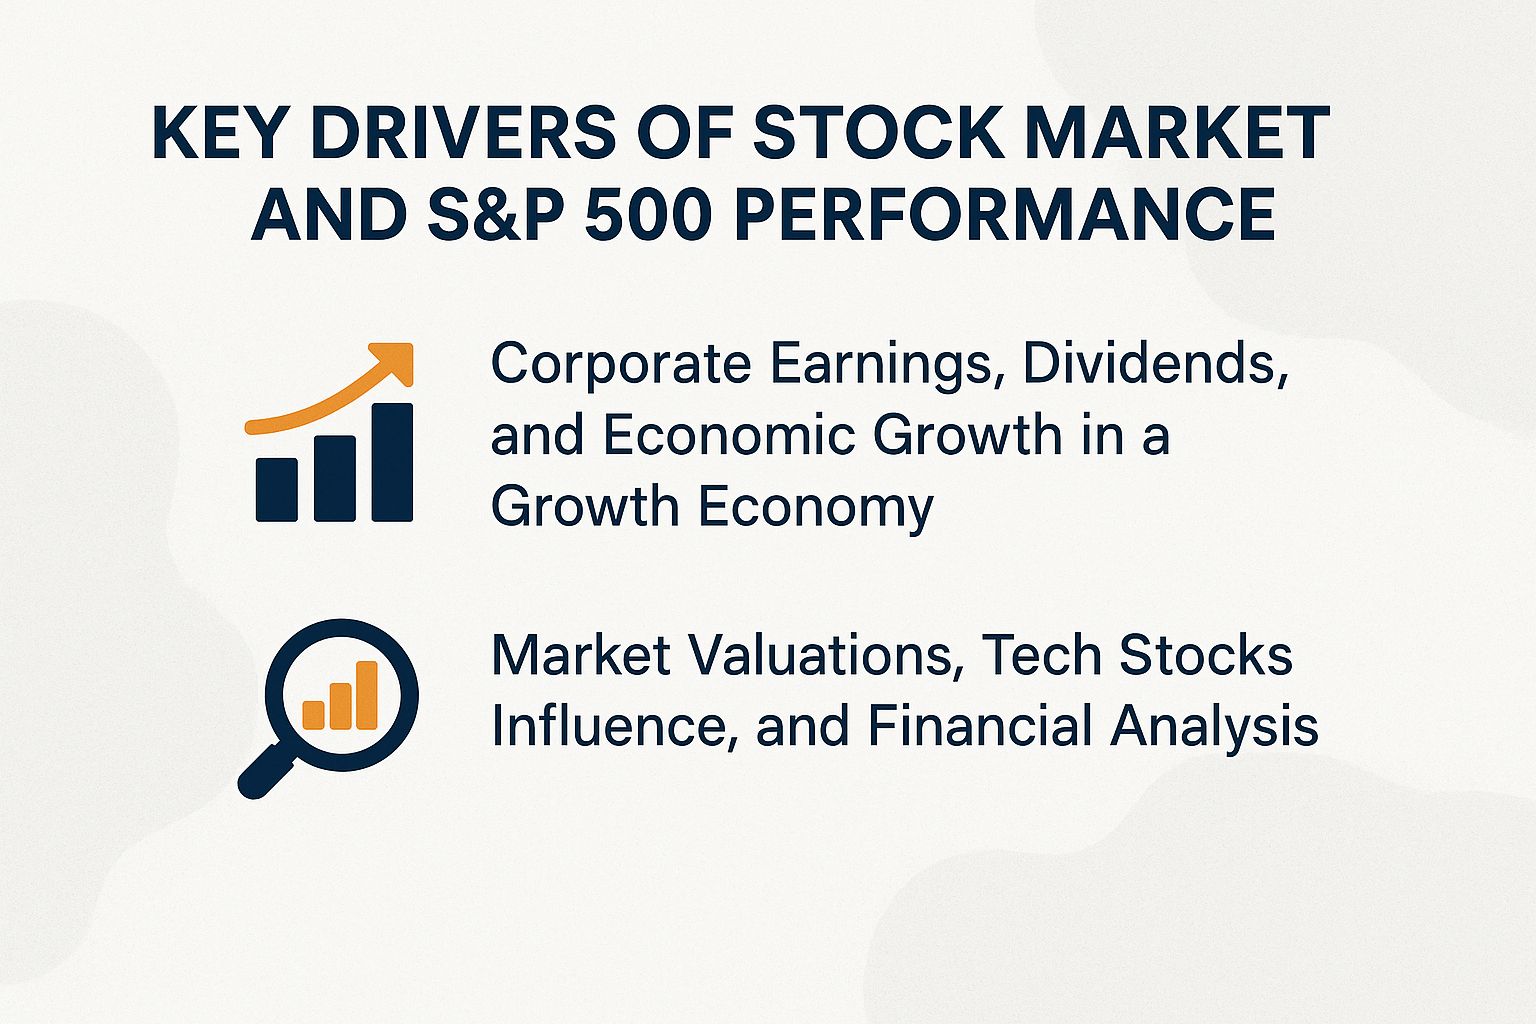
The S&P 500 tracks top U.S. stocks and grows mainly from company earnings and dividends.
Over 30 years, this averaged 7% yearly (FactSet data), matching U.S. GDP trends at about 2.5% real growth.
Corporate Earnings, Dividends, and Economic Growth in a Growth Economy
S&P 500 earnings jumped 8.2% in 2023 to $185 per share. Strong 2.5% GDP growth and 3.7% unemployment fueled it (U.S. Bureau data).
Analysts predict 12% EPS (earnings per share, profit divided by shares) growth for 2024 (FactSet). Break it down:
- 5% revenue boost
- 2-3% better margins
- Minus 1-2% from higher costs
Using NYU’s Aswath Damodaran’s model, expected returns hit about 12%. That’s earnings yield (1 divided by P/E ratio, around 5%) plus 7% growth.
Look at post-2020 recovery-it mirrors today with 50% earnings rebound from $5 trillion stimulus (Congressional Budget Office). Exciting parallels for investors!
Track quarterly earnings now, especially Q4, via Bloomberg. In bull runs, firms beat estimates 70% of the time-don’t miss out!
Build your own EPS model in Excel.
- Use formula: EPS = (Revenue x Margin) / Shares.
- Add GDP forecasts from Bureau of Economic Analysis for what-if tests.
Market Valuations, Tech Stocks Influence, and Financial Analysis
Placeholder content for Market Valuations, Tech Stocks Influence, and Financial Analysis.
Picture this: In 2024, the S&P 500’s forward price-to-earnings ratio-or P/E, which shows how much investors pay for each dollar of a company’s earnings-stands at 20.5x. Tech giants like Apple and Nvidia, making up 30% of the index per S&P Global data, drive this high level and fueled 25% of the index’s gains in the 2010s.
A few top stocks dominate the S&P 500, hinting at overpricing. The Shiller CAPE ratio, which smooths earnings over 10 years to gauge true value, hits 35x-double the usual 17x from Robert Shiller’s data-warning of a possible market drop.
Hold on tight-in 2023, the ‘Magnificent Seven’ stocks powered 60% of the S&P 500’s wins! AI hype pushed their prices sky-high, up to 10 times normal levels.
Value stocks trade at a steady 12x P/E, unlike growth stocks at 30x. Tech’s beta of 1.3 means it swings 30% more than the market, adding extra ups and downs-remember the dot-com crash? Back in 2000, P/E hit 44x, leading to a 50% plunge in stocks.
To mitigate these risks in a practical investment strategy, investors may consider asset allocation to index funds like the Vanguard Information Technology ETF (VGT) for focused exposure to the technology sector. However, it is advisable to rebalance the portfolio quarterly to cap this allocation at 25%, while incorporating value-oriented funds such as the Vanguard Value ETF (VTV) to provide diversification and hedge against potential downturns in bear markets.
Future Outlook and Economic Scenarios with Market Predictions
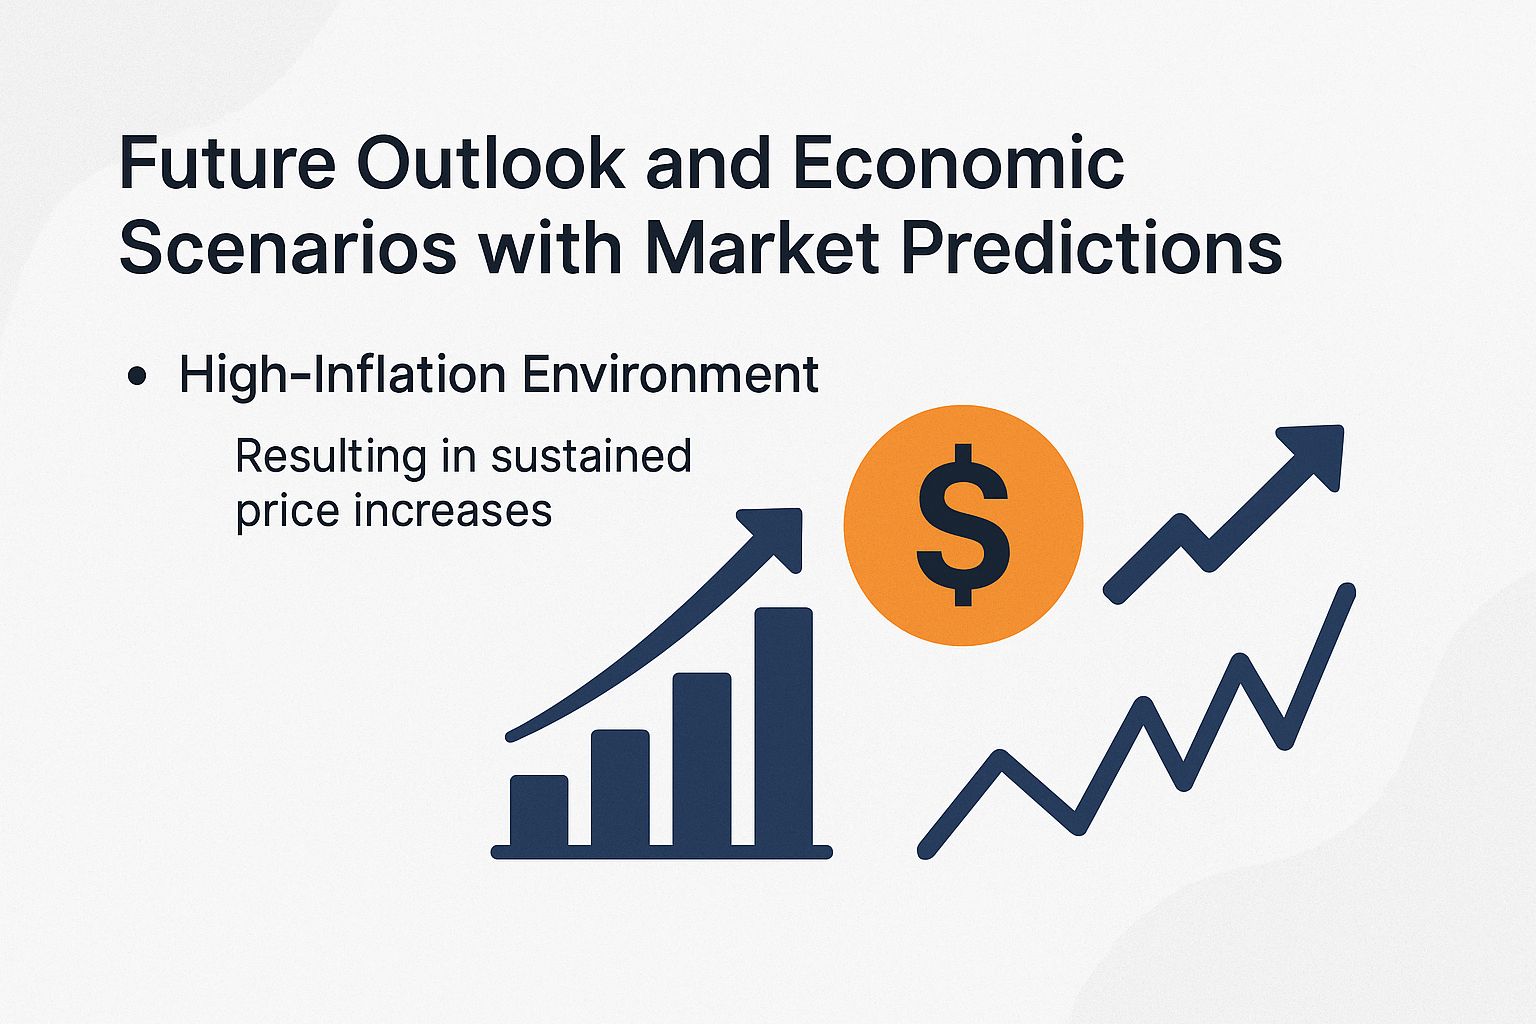
JPMorgan’s forecasts for 2030-2040 predict 6-8% yearly gains for the S&P 500 in the main scenario, as the world economy evolves. Gold might shine with 5-10% returns if inflation stays over 3%, per Monte Carlo models that run thousands of market simulations.
High-Inflation Environment
When inflation soars-think CPI over 4%-gold beats the S&P 500 by 12% a year on average. In the 1970s, gold rocketed 35% while the index limped at 5.9%, per an NBER study on how assets react to price spikes.
- At 5% inflation and 3% Fed rates, stock real returns drop to about 3%.
- Gold could jump 15% if central banks buy twice as much-1,000 tons yearly-says the World Gold Council.
- For stocks, a gloomy view sees P/E ratios shrink to 15x, limiting returns to 4%.
From 2021-2022, inflation hit hard-gold gained 8%, but the S&P 500 barely moved. Consensus Economics surveys peg the odds of ongoing high inflation at 25%-time to prepare!
Act now: Shift 10% from stocks to the SPDR Gold Shares (GLD) ETF. Tests on Portfolio Visualizer show this cuts portfolio ups and downs by 20% over 10 years.
Risks, Uncertainties, and Alternative Investments
Gold and the S&P 500 both carry risks. In low-inflation booms like the 2010s, gold went nowhere, missing out on gains from real estate or Bitcoin.
The S&P 500 can drop 20-30% in downturns, like the 25% fall in 2022 from Yahoo Finance and CNBC reports.
Beat these risks head-on with these four key steps:
- Consideration 1: [Brief description]. Strategy: [Action].
- Consideration 2: [Brief description]. Strategy: [Action].
- Consideration 3: [Brief description]. Strategy: [Action].
- Consideration 4: [Brief description]. Strategy: [Action].
- Gold suffers in deflationary times, when prices fall economy-wide. For example, it dropped 30% in the 1930s. Keep gold to just 5% of your portfolio. Watch out for taxes on gains too.
- The S&P 500 can bubble up and burst, like in the 2000 dot-com crash. Set stop-loss orders to sell if it drops 10%. Track the fear and greed index to gauge investor mood.
- Geopolitical shocks hit both gold and stocks hard, like the 2022 Ukraine war that spiked the VIX fear index to 35. Spread your money 60% in stocks and 40% in bonds, including safe U.S. Treasury bonds for steady yields.
- A strong dollar hurts gold prices, dragging them down by 5% at times. Hedge this risk with tools like DXY futures contracts, which bet on dollar movements in the futures market.
Build your portfolio this way for a Sharpe ratio of 0.75 – that’s better returns for the risk you take. It beats the S&P 500’s 0.65 and gold’s 0.45, with fewer wild swings from smart asset mixing. Get excited: this setup keeps your money safer and growing!
Picture the 2008 crash: the S&P 500 plunged 37%, but gold climbed 5%. Federal Reserve stress tests prove this mix can save your portfolio in chaos.
- Dive into the Bank for International Settlements’ annual report for financial stability risks and consumer confidence signals.
- Check Bloomberg for technical analysis tools: chart patterns to spot trends, moving averages for price history, RSI (Relative Strength Index) to measure speed of changes, and MACD (Moving Average Convergence Divergence) for momentum shifts.