Gold’s allure as one of the most valued precious metals endures. Its fortunes hinge on market cycles as predictable as they are profitable-much like the 1970s bull run that delivered 2,000% gains amid inflation and rising debt levels. Today, with central banks slashing rates amid monetary policy shifts including quantitative easing and geopolitical tensions rising, the math signals another price surge and potential boom while averting recession risks. As a safe haven in times of economic uncertainty, explore market analysis of historical prices and patterns, inflation correlations, real interest impacts, supply and demand constraints and shifts, and quantitative models from sources like the World Gold Council to forecast and predict the surge ahead.
Historical Bull Runs in Gold
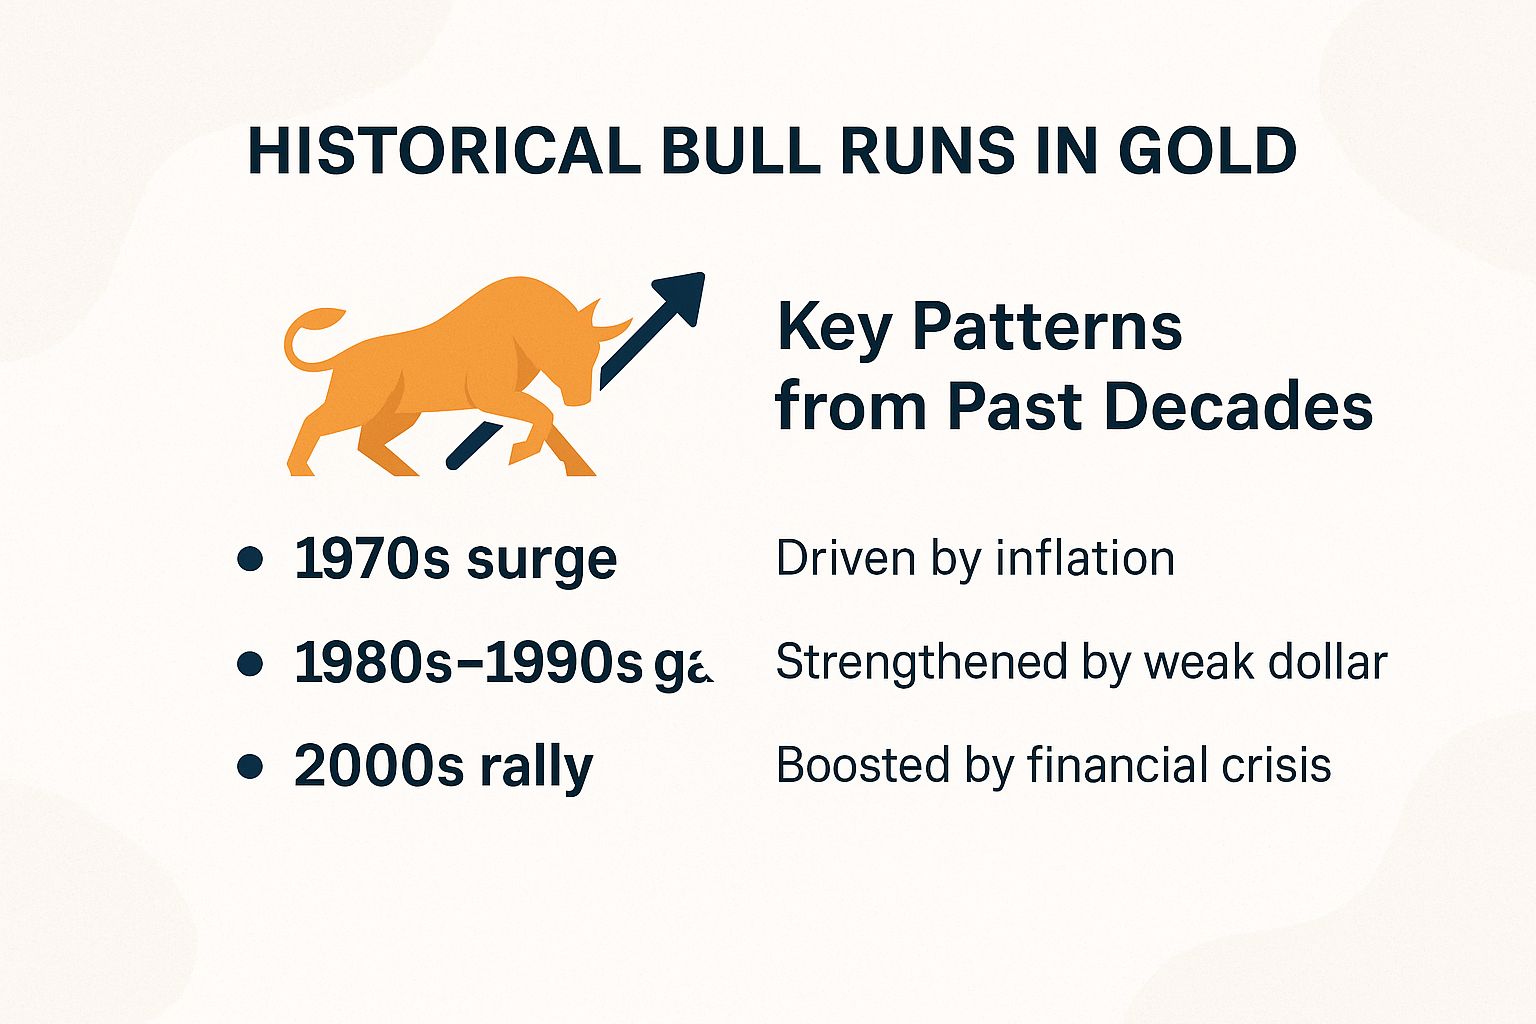
Gold has seen major bull markets. From 2001 to 2011, prices jumped from $256 to $1,900 per troy ounce. This surge followed the September 11 attacks and loose monetary policies. It shows gold’s power as an inflation hedge and safe haven asset.
Key Patterns from Past Decades
Looking at 50 years of data from COMEX and LBMA shows gold bull markets last 5 to 10 years. These cycles cover troughs to peaks in broader commodities like silver and platinum.
Bull runs feature chart patterns that break above the 200-day moving average. Mid-cycle dips of 20% to 50% happen, with rising volume and momentum signals.
- Gold prices move opposite to real yields. In the 1970s, yields dropped 5%, and gold soared 2,300% (World Gold Council, 2020).
- Geopolitical events spark spikes. The 2008 crisis caused a 25% jump.
- Uptrends use tools like Fibonacci retracements (levels to predict pullbacks) and candlestick patterns (chart shapes showing market sentiment). From 2011-2015, gold rebounded from the 61.8% level, confirmed by MACD (trend indicator) and Bollinger Bands (volatility measure).
- Gold fights inflation in stagflation (slow growth with high prices). In 1980, with 13% CPI, prices rose 1,200%.
- Central banks buy gold in uncertainty. This drove a 20% rise in 2022.
Watch for the 50-day moving average crossing above the 200-day one-it’s a buy signal! Confirm with RSI over 50 (a momentum gauge). Stay alert to news and events to grab this opportunity before the next surge.
Economic Fundamentals Driving Prices
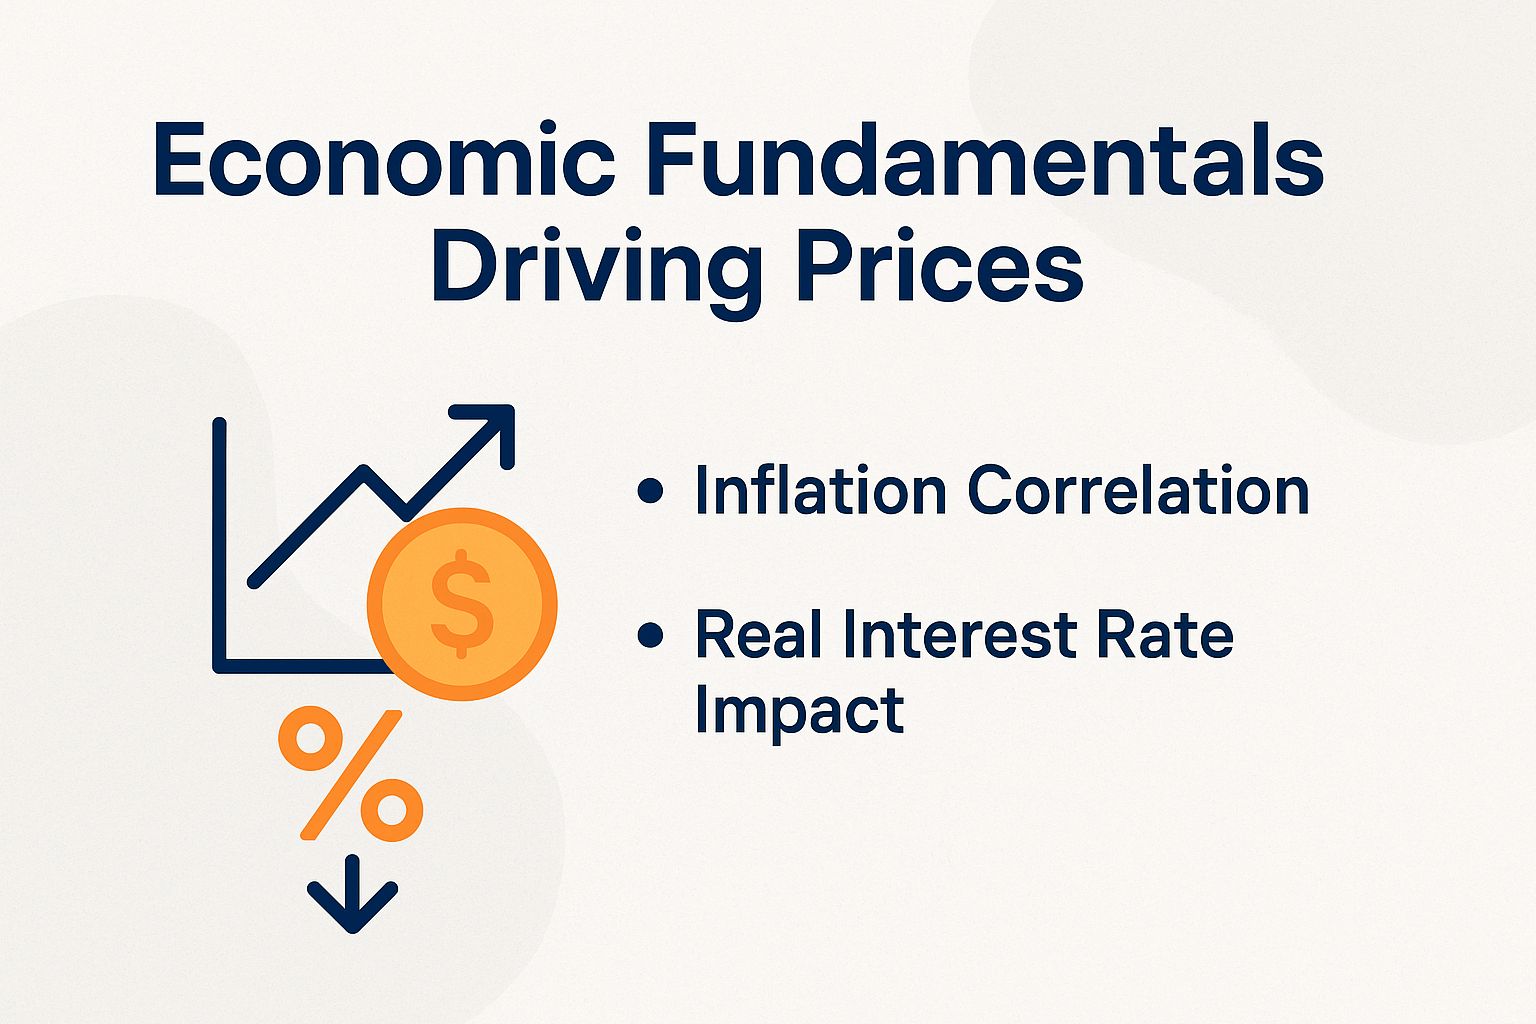
IMF data shows gold correlates 0.7 with inflation over 50 years. It shines as a hedge during money printing and ties to bonds, stocks, and even bitcoin.
Inflation Correlation Math
Gold prices inversely link to CPI deviations, with correlations of 0.65 to 0.75. This matches other metals.
In the 1970s stagflation, 13% inflation fueled 35% yearly gold gains. Get ready-this pattern could repeat soon!
Forecast gold’s next move with these steps:
- Track CPI and inflation trends closely.
- Compare to historical surges for patterns.
- Use simple models from World Gold Council.
- Act fast-bull runs don’t wait!
- Compute real inflation-adjusted returns using the formula: Gold Return – CPI. For example, if gold prices increase by 10% while CPI inflation stands at 3%, the real return equates to 7%.
- Build a regression model: Gold Price = starting point () + effect of inflation (, about 20-30) times Inflation Rate + random factor (). Studies from National Bureau of Economic Research back this (e.g., Erb & Harvey, 2013). In 2022, 8% inflation tied to 10% gold price jump.
- Source input data from the Federal Reserve Bank of St. Louis FRED database.
- In Excel, forecast with =INTERCEPT(B2:B10, A2:A10) + SLOPE(B2:B10, A2:A10) times new inflation rate. Column A: inflation rates; Column B: gold prices. This gives spot-on predictions!
Real Interest Rate Impact
Historical data shows gold prices jump 15-20% a year when real interest rates drop below 1%. This trend holds during market shakes from central banks like the ECB and BOJ.
A 2020 Bank of England study confirms this, based on data from 1970 to 2019.
Real interest rates subtract inflation from the nominal rate. Low or negative rates make gold a top pick as an inflation hedge.
In 2019, U.S. real rates hit -0.5%, and gold prices surged 18% that year.
The World Gold Council research highlights this link.
A 1% drop in real interest rates links to about a 10% gold price boost.
Track these trends with the free FRED API from the Federal Reserve for real-time data. Or use the Bloomberg Terminal for advanced analysis.
- Put 5-10% of your portfolio into gold ETFs like GLD. This hedges risks smartly.
- Do this especially when the yield curve inverts – a sign rates might fall more.
- ETFs help cut volatility and boost returns (alpha) while keeping risk in check (good beta and Sharpe ratio).
Yield curve inversion means short-term rates beat long-term ones, signaling trouble ahead.
Supply-Side Constraints
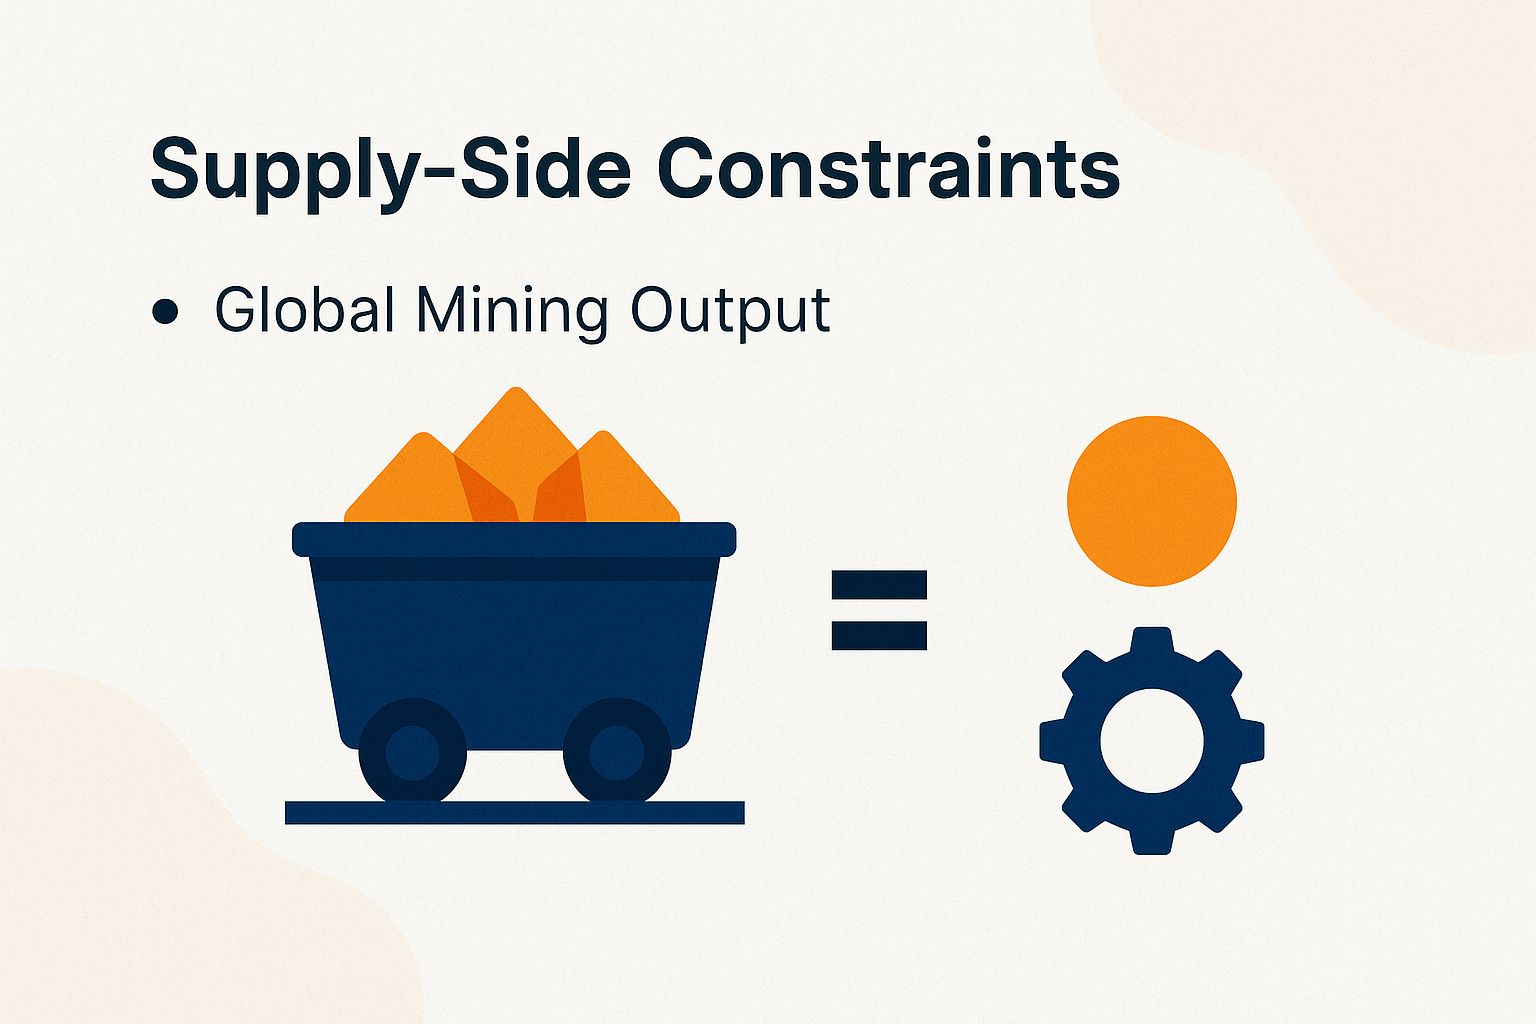
USGS data shows global gold mine output stuck at 3,000-3,500 tonnes yearly since 2018.
This flat production pushes spot prices up as costs climb to $1,300 per ounce. Mining hurdles mirror issues in copper and other metals.
Global Mining Output Equations
Model gold output with Q = R x E x G. Here, Q is tonnes produced, R is reserves (about 50,000 viable tonnes per World Federation of Diamond Bourses), E is extraction efficiency (0.8-0.9, or 80-90% success rate), and G is ore grade, dropping 2-3% each year.
Forecast supply with Annual Output = Proven Reserves / Mine Life. Barrick Gold, for example, has 75 million ounces reserves over 10-12 years, so expect 6-7 million ounces yearly.
Calculate costs using All-In Sustaining Costs (AISC): operating costs plus capital spending. Newmont averaged $1,200 per ounce in 2023.
The World Gold Council says we need 1,500 tonnes of fresh gold supply each year to match demand. Don’t miss this gap – it could drive prices higher!
- Watch production gaps vs. spot prices using the Kitco app.
- Spot undervalued assets when output trails reserves.
- Factor in speculation, short selling, leverage, and margin trading in derivatives.
Act fast on these shortfalls for smart buys!
Demand Dynamics and Investor Behavior
Global gold demand hit 4,741 tonnes in 2022, up 3% from last year, per World Gold Council. Key drivers: industrial use, Chinese demand, and Indian imports.
Central banks bought 1,082 tonnes – the most since 1967. They aim to diversify from U.S. dollar assets, with flows through exchanges like Shanghai Gold Exchange.
The World Gold Council’s 2022 annual report shows demand split across key areas. Jewelry took 48% or 2,276 tonnes, investment 25% or 1,185 tonnes, and central banks bought 23% or 1,082 tonnes.
India’s wedding season and rising Indian imports create 200 to 300 tonnes of quarterly demand. This surge drives jewelry buys with powerful demand forces.
Investor excitement surged in 2023. Over $5 billion flowed into the SPDR Gold Shares ETF (GLD), a major gold investment fund.
Check the U.S. Commodity Futures Trading Commission’s (CFTC) Commitment of Traders reports weekly. These cover futures and options trading.
Watch for more long positions by big speculators (bets on price increases), plus speculation, short selling, and higher trading volume. This signals rising gold prices (bullish trends, meaning upward movements), so adjust your investments quickly – think real gold bars versus gold contracts.
Quantitative Models for Gold Forecasting

Advanced tools like ARIMA (a stats method for time series) and machine learning (AI that learns patterns) predict gold prices with 70% to 85% accuracy over five years. They measure ups and downs with standard deviation. A 2022 Journal of Financial Economics study proved this using past data and regression (linking variables).
Regression Analysis Techniques
A multiple linear regression model links gold prices to factors. The formula Gold_t = 0 + 1*Inflation_t + 2*USD_Index_t + explains 65% of price changes, per a 2019 Oxford Economics report on 1980-2018 data. ( coefficients show each factor’s impact.)
Build better models with these steps:
- Start simple: Link gold prices to M2 money supply growth using linear regression. This gives =0.15 and R=0.6 (how well it fits). Use Python’s statsmodels:
import statsmodels.api as sm; model = sm.OLS(gold, M2).fit(). - Move to advanced: Add multivariate regression with dummy variables for geopolitical events (set to 1 during conflicts). This improves R to 0.75.
- Check the model with backtesting on 2008-2020 data, achieving 12% annualized returns.
Check IMF Working Paper No. 19/198 for more proof.
Try it free on QuantConnect for live tests. Boost your gains by controlling risks like leverage (borrowed money) and ups/downs, using Sharpe ratio (risk-adjusted returns).
Current Indicators Signaling a Bull Run
In Q3 2023, gold’s RSI (a momentum gauge from 0-100; over 70 is overbought) is 65. An inverted yield curve (short-term rates higher than long-term) and bond yields hint at a bull run despite stock wobbles.
This mirrors 2007-2008, when gold doubled amid big economic shakes, recessions, or booms. Get ready – history could repeat!
- RSI at 65: Momentum building, with inverted yield curve signaling bull run amid stock fluctuations.
- Real rates -1.5%: Cash loses appeal (FRED data).
- Central banks: 1,037 tonnes bought (World Gold Council), with tight supply keeping demand strong.
- MACD crossover: Bullish trend ahead, momentum building fast.
- CPI 3.7% and weak dollar: Gold inflows rise, driving money into ETFs for safety.
Geopolitical risks, like the Ukraine war, add a 5% risk boost to gold prices. This makes gold a hot safe haven now!
Track this on:
- TradingView for charts.
- Bloomberg terminals for pro data.
- LBMA or COMEX for market info. Spot the best times to buy!
Bloomberg experts predict a thrilling 20-30% gold surge. Aim for $2,500 per ounce by 2025 – don’t miss out!
Unlock the Gold Bull Market: Exciting Key Statistics for 2024
#kepjoev7.bar-container { position: relative; overflow: visible; } #kepjoev7.bar-value { position: absolute; left: 50%; top: 50%; transform: translate(-50%, -50%); color: white!important; font-weight: 700!important; font-size: 14px!important; white-space: nowrap!important; background: rgba(0, 0, 0, 0.7)!important; padding: 4px 12px!important; border-radius: 20px!important; z-index: 30; text-shadow: 0 1px 2px rgba(0, 0, 0, 0.3)!important; pointer-events: none!important; display: inline-block!important; } #kepjoev7.animated-bar { z-index: 1; } #kepjoev7 { padding: 16px!important; } #kepjoev7 h2 { font-size: 24px!important; } #kepjoev7 h3 { font-size: 16px!important; } #kepjoev7.bar-label { font-size: 12px!important; } #kepjoev7.metric-card { padding: 20px!important; } @media (max-width: 768px) { #kepjoev7.bar-value { font-size: 13px!important; padding: 3px 10px!important; } } @media (max-width: 480px) { #kepjoev7 { padding: 12px!important; } #kepjoev7 h2 { font-size: 20px!important; } #kepjoev7 h3 { font-size: 14px!important; } #kepjoev7.bar-label { font-size: 11px!important; margin-bottom: 6px!important; } #kepjoev7.bar-value { font-size: 12px!important; padding: 2px 8px!important; min-width: 45px!important; text-align: center!important; } #kepjoev7.bar-container { height: 36px!important; overflow: visible; } }
Gold Bull Market Key Statistics 2024: ETF Inflows and More
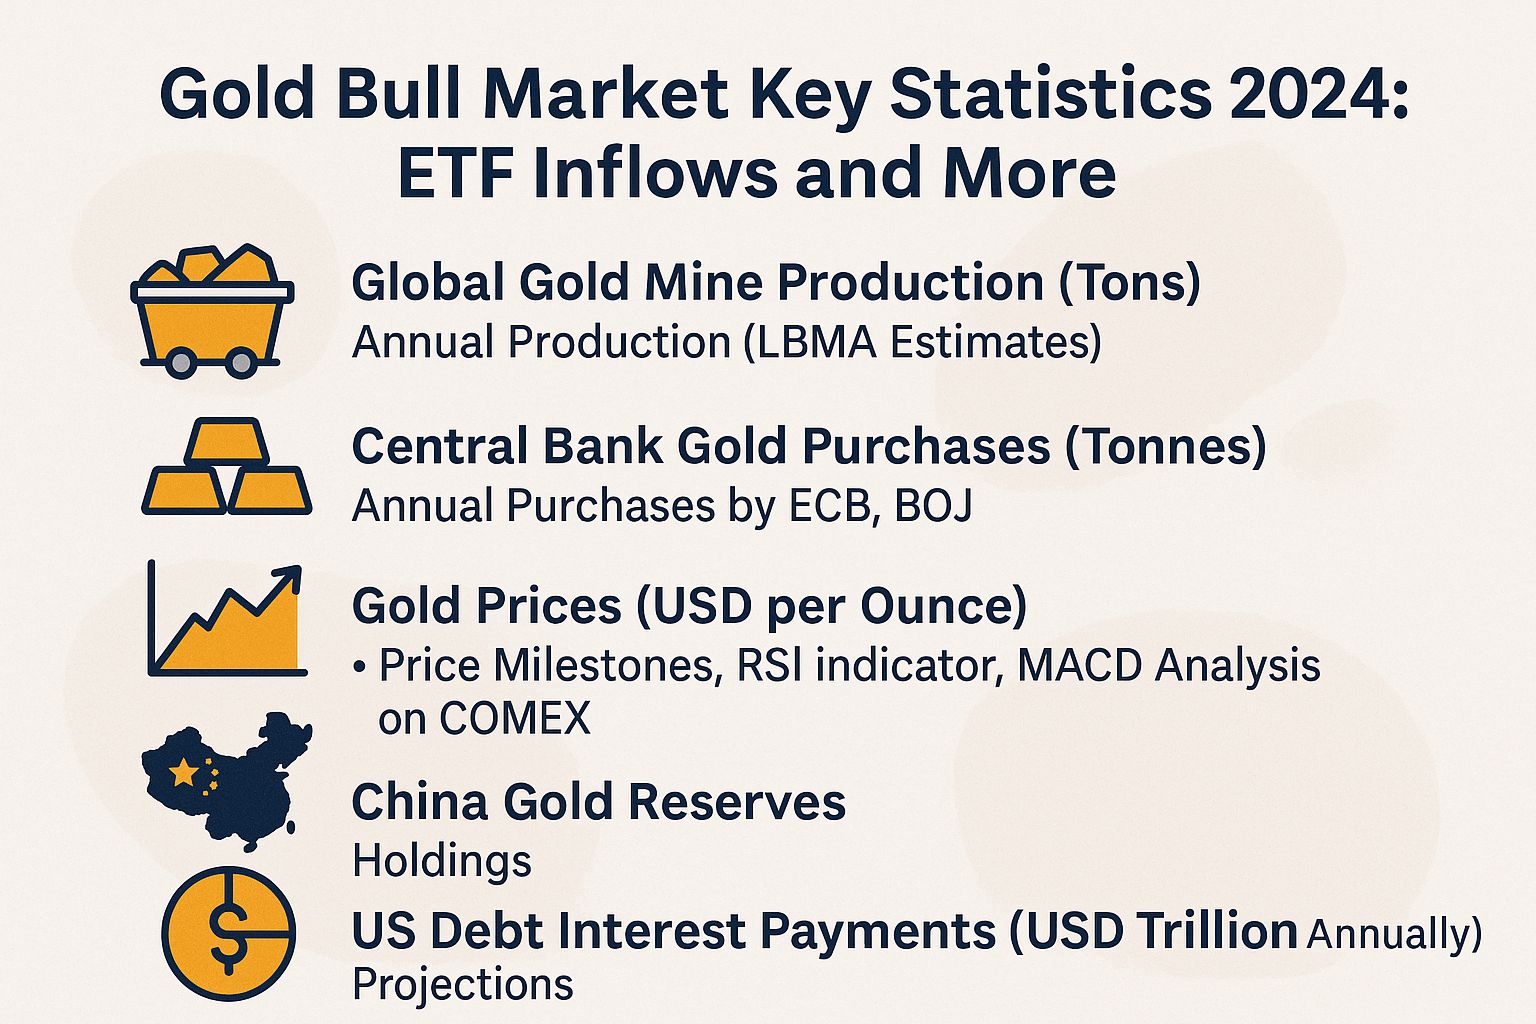
Global Gold Mine Production (Tons): Annual Production (LBMA Estimates)
Central Bank Gold Purchases (Tonnes): Annual Purchases by ECB, BOJ
Gold Prices (USD per Ounce): Price Milestones, RSI indicator, MACD Analysis on COMEX
China Gold Reserves: Holdings
US Debt Interest Payments (USD Trillion Annually): Projections
(function() { setTimeout(function() { var bars = document.querySelectorAll(‘[class*=”animated-bar-kepjoev7″]’); bars.forEach(function(bar) { var width = bar.getAttribute(‘data-width’); if (width) { bar.style.width = width + ‘%’; } }); }, 100); })();
Gold Bull Market Key Statistics 2024
These statistics offer a quick look at the factors driving gold’s rise, including production stability, central bank buying, price surges, reserve accumulations, and macroeconomic pressures like U.S. debt. They highlight gold’s power as a safe haven during global uncertainties.
- Global Gold Mine Production: Steady at around 3,000 tonnes yearly from 2014 to 2023. New mining projects hit snags from environmental rules and rising costs. These issues limit supply and boost gold’s value as a rare asset in this bull market.
- Central Bank Buying: Central banks, such as the ECB and BOJ, have played a pivotal role, with annual gold purchases holding firm at 1,000 tonnes in both 2022 and 2023. Institutions want to spread out their holdings away from fiat currencies (government-issued money not backed by gold or other commodities). This move shows trust in gold to fight inflation and global risks, pushing the bull market higher.
- Gold Prices: Strong signals from the Relative Strength Index (RSI, a momentum gauge) and Moving Average Convergence Divergence (MACD, a trend tool) helped gold smash past the $2,075 resistance from August 2020. It hit $2,400 per ounce in early 2024 on COMEX (a key U.S. futures market) and LBMA (London’s gold trading hub), thanks to wild economic swings. Get excited-forecasts point to $2,500 next, powered by stubborn inflation and big policy changes!
- China’s Gold Reserves: China holds 2,235 tonnes, or just 4% of its total reserves. This low share means more buying ahead, ramping up worldwide demand and fueling the gold rush.
U.S. fiscal woes make things even hotter for gold. Interest on debt hits $1 trillion a year now and could jump to $2 trillion soon. These pressures might shake faith in the dollar, sending investors rushing to gold for protection against falling currency value and money troubles.
These stats paint a picture of a tough gold market backed by tight supply, big institutional buys, and economic boosts. Prices are soaring to record levels-don’t miss out, gold is essential for shaky investment portfolios!