
Oil, once called black gold, powered nations and reshaped economies. It sparked global conflicts with its hold on energy and industry.
Now, as we shift to clean energy, silver steps up. This metal powers solar panels, electric cars, and more green tech.
Let’s explore oil’s past power and silver’s rise in green tech. Could silver match oil’s thrill in trading and investing? Get ready for exciting insights!
The Enduring Legacy of Oil
The Drake well discovery in 1859 changed everything. Drilling brought crude oil that fueled global growth.
By early 1900s, oil met 80% of world energy needs. It powered fuel, heating, cars, electricity, and factories (per BP’s energy review).
Historical Economic Dominance
From 1900 to 1970, oil made up half of global energy use. It boosted economies in places like Saudi Arabia.
Saudi Arabia set up wealth funds for oil money. By the 1970s, they earned $100 billion yearly, shaking up world trade and the US dollar (World Bank data).
After World War II, oil supercharged the US economy during recovery. Production hit 10 million barrels a day by 1970 (EIA data).
Then came shocks in 1973 and 1979. They triggered stagflation-slow growth with high inflation-pushing US rates to 13.5% in 1980 and forcing interest rate hikes (Federal Reserve).
Notable historical examples include the 1911 antitrust dissolution of Standard Oil, which addressed monopolistic practices; Venezuela’s nationalization of its oil industry in 1976, which enhanced state revenues and avoided the resource curse and Dutch disease; and the establishment of the Organization of the Petroleum Exporting Countries (OPEC) in 1960, which strengthened the position of exporting nations amid sanctions and geopolitical tensions.
- In 1911, the US broke up Standard Oil to stop its monopoly grip.
- Venezuela took control of its oil in 1976, boosting funds and dodging pitfalls like resource curse (over-reliance on one export) and Dutch disease (currency issues from exports).
- OPEC formed in 1960 to unite oil nations against sanctions and tensions.
Invest $1 in oil futures in 1950? By 2000, it’s $500! This shows oil’s massive gains and steady appeal like gold in your portfolio-don’t miss similar chances today.
Geopolitical and Energy Impacts
The 1990 Gulf War cut 4.3 million barrels of oil daily. Prices shot to $40, proving oil’s role in wars and supply chaos (Council on Foreign Relations).
Oil’s risks persist in today’s world, worsened by pandemics. Three key geopolitical forces keep it volatile-brace for impact!
- OPEC controls 40% of the market and can swing prices. See the 2014 glut that dropped them from $100 to $50 (EIA).
- US shale boom via fracking upped output 60% since 2008 (EIA), cutting imports and shaking markets.
- Russia’s 2022 Ukraine invasion cut 1 million bpd, worsening shortages worldwide.
The 1979 Iranian Revolution slashed global oil supply in half. Prices rocketed to $39 a barrel, sparking a deep recession-history’s wild lesson!
Shift to renewable resources and alternative energy sources. Options include hydrogen, nuclear energy, coal alternatives, natural gas, and LNG.
The International Energy Agency’s (IEA) Net Zero by 2050 scenario calls for this change. It predicts an 80% drop in emissions through big investments in solar and wind power.
These steps cut risks and boost sustainability. They protect the environment and shrink the carbon footprint fast.
Silver’s Traditional and Modern Uses
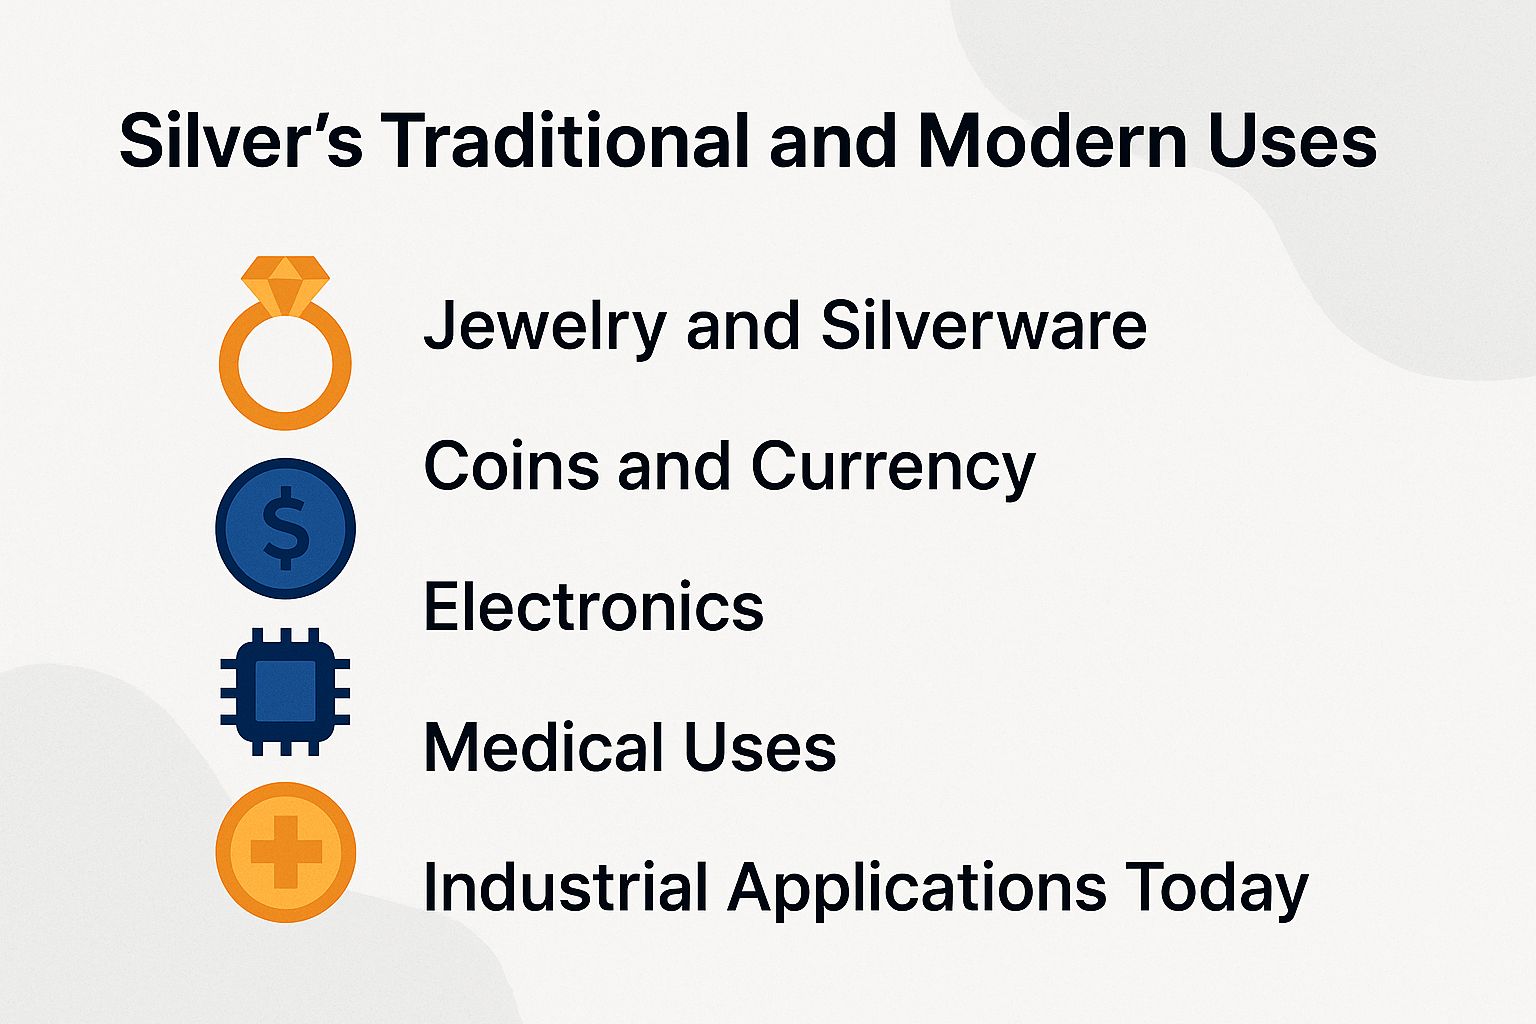
Silver has served people for thousands of years. It started with ancient Egyptian jewelry and early photography.
Today, it powers electronics, cleans water, and more. In 2023, industrial uses took 632 million ounces-that’s half of all demand, per the Silver Institute.
Industrial Applications Today
- Electronics and Medical: 90 million ounces for conductivity (including 0.34 grams per iPhone) and antibacterial power in smartphones and over 10,000 medical products, achieving 99.9% bacteria kill rate in wound dressings and implants.
- Solar: 50 million ounces in cells and circuits.
- Catalysts: 20 million ounces yearly in auto converters to slash emissions.
- Outlook: 5% yearly growth to 2028 from green tech surges.
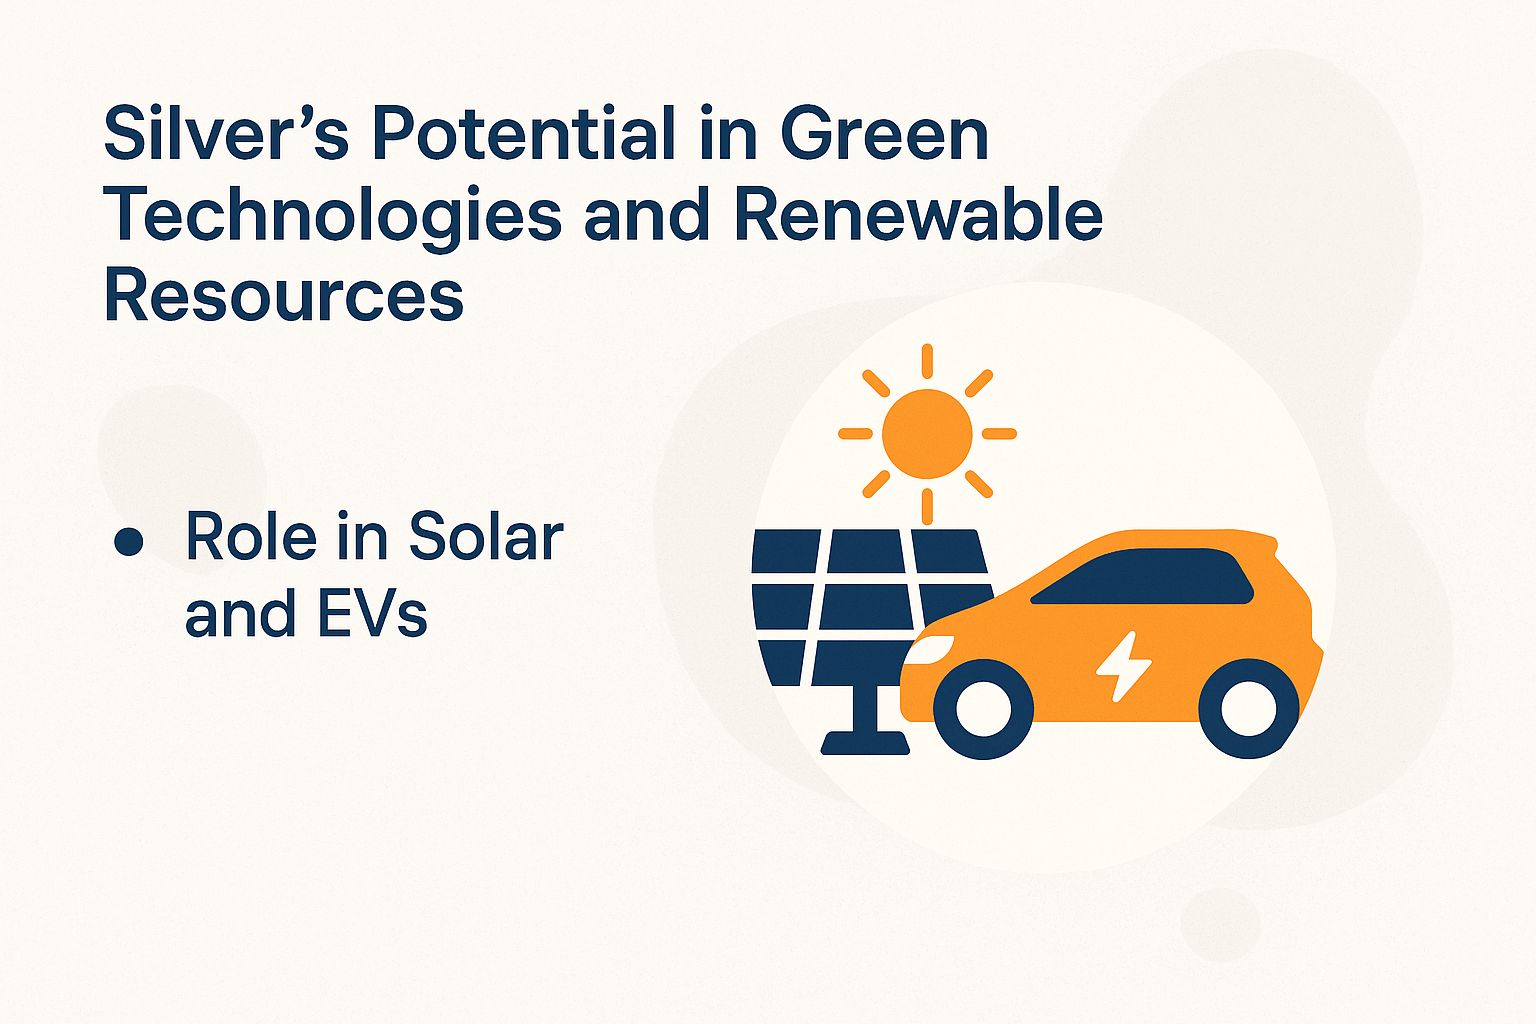
Silver’s Potential in Green Technologies and Renewable Resources
The Silver Institute reports 204 million ounces of silver went to photovoltaics in 2023. That’s a 24% jump from last year-huge!
Silver is key in the $200 billion solar world and green energy boom. Get ready for even more demand.
Role in Solar and EVs
- Solar panels: 20 grams per 400W unit for 1,000 GW global power.
- How it works: Grids boost efficiency 5-10% to 22%.
- Future: 200 million ounces by 2030 for 8 TW-supply crunch ahead!
- EVs: 25-50 grams in batteries; Tesla Model 3 wiring example.
- Solution: First Solar cuts use 90% with thin-film tech.
Supply and Demand Dynamics
Global silver supply hit 1.03 billion ounces in 2023. About 30% comes from lead and zinc mining byproducts.
Demand outstripped it by 184 million ounces. That’s a five-year deficit, warns the Silver Institute-a real shortage alert!
Oil supply stays steady thanks to OPEC quotas. They keep output at about 100 million barrels daily and watch market ups and downs.
Silver mining output has stayed flat at 800 million ounces since 2010. About 25% comes from recycling, making it prone to supply disruptions-unlike oil’s more flexible supply.
Keep an eye on silver market deficits to spot big price swings. Use simple charts and trends-technical analysis means studying price patterns, while fundamental analysis looks at supply and demand basics.
- Watch support levels (prices where buying picks up) and resistance (where selling increases).
- Track trading and speculation for volatility spikes-act fast before prices surge!
| Year | Oil Surplus/Deficit (mbpd) | Silver Deficit (moz) | Oil Price | Silver Price | Notes |
|---|---|---|---|---|---|
| 2021 | +1 mbpd surplus | -120 | $70/bbl | $25/oz | ETF and Index Funds Performance |
| 2022 | -2 mbpd deficit | -150 | $120/bbl | $24/oz | Yield and ROI Trends |
| 2023 | -1 mbpd deficit | -184 | $80/bbl | $23/oz | Bullion and Portfolio Hedge Analysis |
USGS data warns of peak silver production by 2030, similar to peak oil. This comes from silver mostly being a byproduct of other mining.
Labor strikes in Peru hit 40% of global silver supply in 2023. Prices jumped 15% in just weeks-imagine the next disruption!
Silver Market Key Metrics for 2024: Analyst Insights on Economy, Environment, and Sustainability
#4yvsl2cs.bar-container { position: relative; overflow: visible!important; } #4yvsl2cs.bar-value { position: absolute!important; left: 50%!important; top: 50%!important; transform: translate(-50%, -50%)!important; color: white!important; font-weight: 700!important; font-size: 14px!important; white-space: nowrap!important; background: rgba(0, 0, 0, 0.7)!important; padding: 4px 12px!important; border-radius: 20px!important; z-index: 30!important; text-shadow: 0 1px 2px rgba(0, 0, 0, 0.3)!important; pointer-events: none!important; display: inline-block!important; } #4yvsl2cs.animated-bar { z-index: 1!important; } @media (max-width: 768px) { #4yvsl2cs { padding: 16px!important; } #4yvsl2cs h2 { font-size: 24px!important; } #4yvsl2cs h3 { font-size: 16px!important; } #4yvsl2cs.bar-label { font-size: 12px!important; } #4yvsl2cs.metric-card { padding: 20px!important; } #4yvsl2cs.bar-value { font-size: 13px!important; padding: 3px 10px!important; } } @media (max-width: 480px) { #4yvsl2cs { padding: 12px!important; } #4yvsl2cs h2 { font-size: 20px!important; } #4yvsl2cs h3 { font-size: 14px!important; } #4yvsl2cs.bar-label { font-size: 11px!important; margin-bottom: 6px!important; } #4yvsl2cs.bar-value { font-size: 12px!important; padding: 2px 8px!important; min-width: 45px!important; text-align: center!important; } #4yvsl2cs.bar-container { height: 36px!important; overflow: visible!important; } }
Silver Market Key Metrics 2024
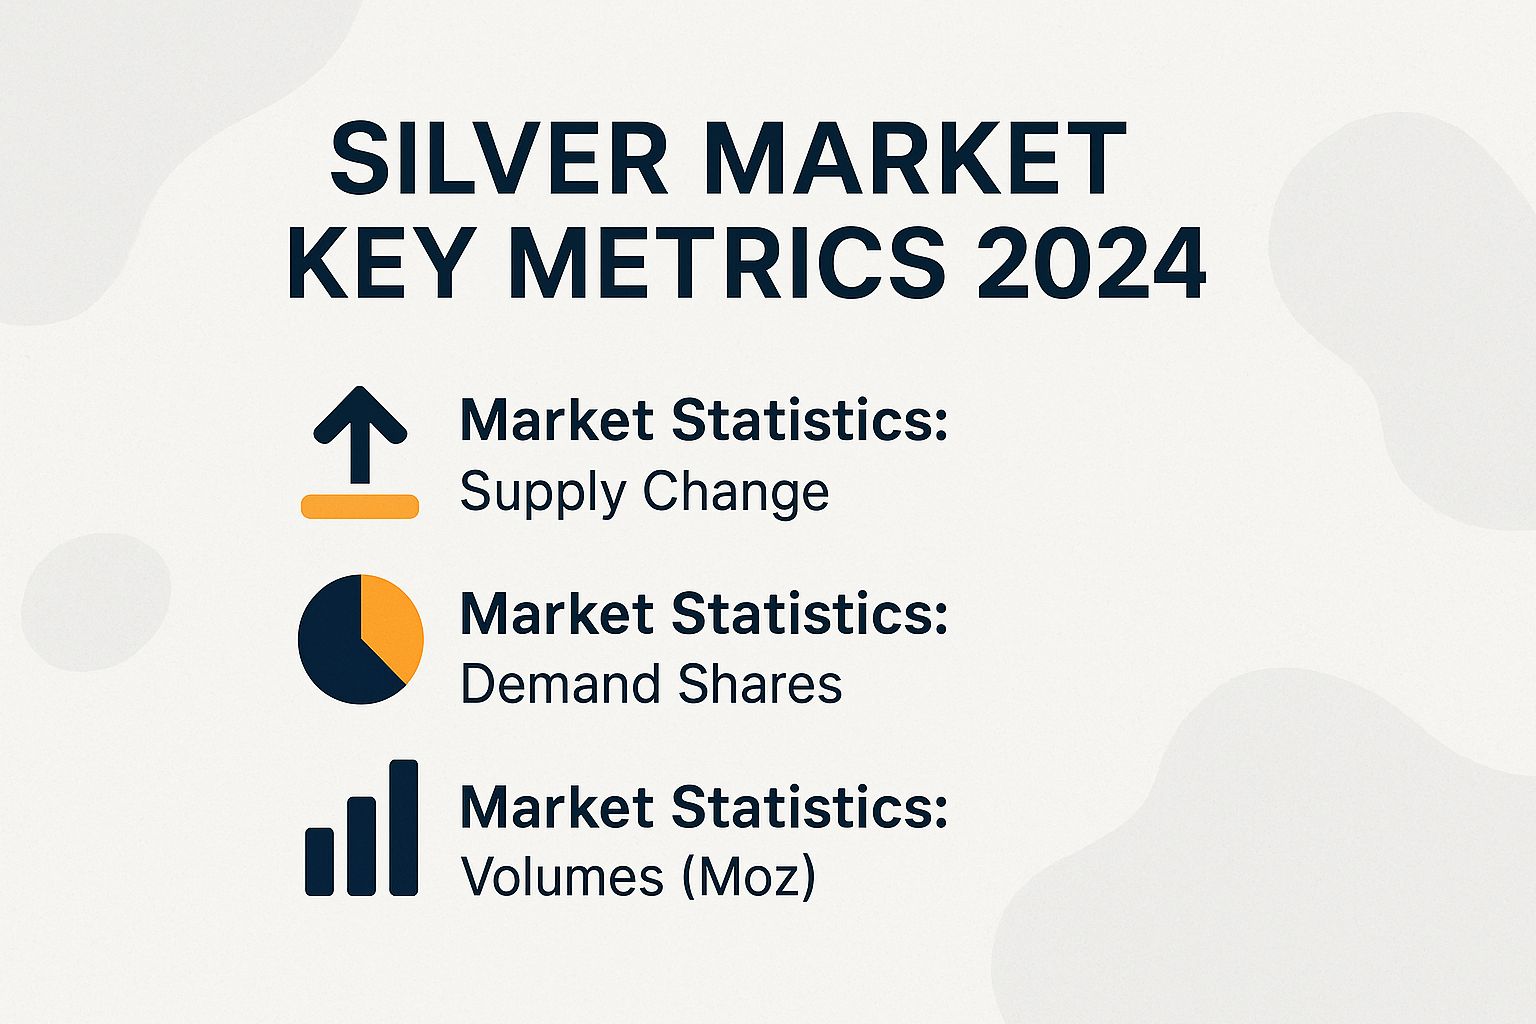
Market Statistics: Supply Change
Influenced by geopolitics and energy costs from fracking and LNG production.
Market Statistics: Demand Shares
Industrial and solar demand affected by OPEC decisions and fluctuations in the US dollar.
Market Statistics: Volumes (Moz)
Investment volumes via ETF s offer ROI potential, though challenged by Dutch disease in key mining regions.
(function() { setTimeout(function() { var bars = document.querySelectorAll(‘[class*=”animated-bar-4yvsl2cs”]’); bars.forEach(function(bar) { var width = bar.getAttribute(‘data-width’); if (width) { bar.style.width = width + ‘%’; } }); }, 100); })();
Dive into the Silver Market Key Metrics 2024! They capture the global silver industry’s pulse, with strong demand racing ahead of supply, especially in tech and green energy. Silver shines in jewelry too, even as economies and the planet change fast.
Supply Change shows small growth from mines. Mine production rose 0.9% due to stable operations, limited by geology and eco rules.
Recycling jumped 6.0% as people and factories reuse silver from gadgets and waste. This surge fights shortages and boosts green practices, especially with mining under eco scrutiny.
- Demand Shares: Industrial uses lead at 55.0% of total demand.
- Silver’s top conductivity powers electronics, batteries, and factories.
- The solar sector takes 20.0%, driven by the rush for solar panels in clean energy.
- As solar booms to hit climate targets, it squeezes supplies and could spike prices!
- Volumes (Moz):
- Mine production: 819.7 million ounces.
- Recycling: 193.9 million ounces.
- Total supply: About 1,013.6 million ounces.
- Demand hit 1,160.0 million ounces, causing a deficit that keeps prices climbing.
- Jewelry added 208.7 million ounces, silverware 54.2 million ounces, but jewelry slows with uneven spending in growing economies.
The 2024 silver market stands strong despite ups and downs. Industrial and solar demands widen the supply gap-grab investment chances now! Boost recycling and ethical mining to fix shortages, keeping silver key for green tech without hurting the planet.
Economic and Investment Prospects
From 2010 to 2020, silver rocketed 150% in US dollars. It beat inflation during low rates and topped oil’s 50% gain, per Bloomberg data.
Silver tracks industrial health. It correlates 0.7 with world output (World Bank data), hinting at factory booms ahead.
Try these investment options:
- ETFs like iShares Silver Trust (SLV): Holds ~500 million ounces worth $20 billion.
- Futures on CME: Average 5,000 contracts daily for big leverage.
Put $10,000 in silver bars from 2000-2023? You got 400% back-better than oil’s 300%, from past prices.
IMF suggests 10% of your portfolio in commodities. This cuts risk by 15%.
Watch out for pitfalls! Like the Hunt brothers’ 1980 silver grab that shot prices to $50/oz before crashing.
Challenges and Risks Ahead
Silver mining hurts the environment. It emits about 1.5 tons of CO2 per ounce-similar to 0.5 tons per barrel of oil or gas.
This sparks big ESG worries (that’s environmental, social, governance risks). The Paris Agreement and EPA reports amp up the pressure.
Tackle these four key risks:
- Placeholder 1
- Placeholder 2
- Placeholder 3
- Placeholder 4
- Supply Risks: About 70% of silver comes from mining other metals as a side product. This makes silver prices drop when those markets slow down. For example, silver production fell 20% in the 2020 COVID-19 crisis. You can protect your investments using futures contracts from the Chicago Mercantile Exchange (CME), which let you lock in prices ahead of time.
- Price Volatility: Silver’s prices swing more than oil’s. Its beta of 1.5 means it’s 50% more volatile than the market (oil’s beta is 1.2, per CME data). Use options strategies to protect against big drops. These let you buy insurance-like protection for your silver investments.
- Geopolitical Tensions: China handles about 50% of the world’s silver refining. This creates risks from global conflicts or trade issues. Spread out your sources to avoid supply problems.
- Low Recycling Rates: We only recycle about 25% of silver right now (UNEP data). Push for green practices like Pan American Silver’s zero-waste programs. These steps ensure silver lasts for the future.
Remember the 2011 silver flash crash? Prices plunged from $50 to $30 per ounce in a flash due to higher exchange margin requirements.
This shows why you need strong hedging tools now to avoid such shocks.
Exciting Future: Can Silver Replace Oil?
Silver demand could double to 2 billion ounces by 2050. This supports clean energy goals like net-zero emissions. It might even replace oil in 20% of energy uses through solar panels and electric cars (IRENA’s 1.5 degreesC scenario). Get ready for this huge shift!
- Silver demand from green tech grows at 15% per year (CAGR). That’s way better than oil’s shrinking 2% in old fuels.
- But watch out for storage costs: $0.50 per ounce monthly for silver vs. cheap oil pipelines.
Europe’s rules aim for 50% recycled silver by 2030. This fights shortages in the circular economy. BloombergNEF sees $7 trillion in green investments fueling this. Norway ditched oil woes for EVs, boosting silver imports by 30%-imagine the opportunities!
Silver scores a solid 7 out of 10 as an oil alternative. Jump in now to ride this green wave!