In 1980, silver’s price hit a peak of $50 an ounce. The Hunt Brothers tried to corner the market amid high inflation.
Today, economic worries like rising rates and green tech demand remind us of that time. Investors wonder if silver can climb back.
This analysis looks at history, prices, supply-demand shifts, economic forces, and global events. Can silver reach those heights again, or will new risks block it?
The 1980 Silver Surge: Key Drivers
The 1980 silver bull market surged due to speculation, volatility, and economic pressures. Prices jumped from $6 to over $49 per ounce in months, hitting the all-time high in dollar value without adjusting for inflation.
Hunt Brothers’ Market Manipulation
The Hunt Brothers-Nelson Bunker Hunt and William Herbert Hunt-tried to control the silver market. They bought about 200 million ounces, half of U.S. annual production, using COMEX futures contracts.
They started in 1973 to hedge against inflation. By 1980, they invested $1.7 billion, per SEC filings, but with heavy debt.
They used futures contracts and leverage to control big positions with little upfront money.
Leverage means borrowing to buy more-often with just 5-10% margin-which boosted gains but risked huge losses if prices fell.
On March 27, 1980-Silver Thursday-prices crashed from $50 to $10.80 an ounce. Higher COMEX margins and manipulation claims sparked a $1.1 billion margin call, ruining their scheme in a short squeeze.
A short squeeze forces sellers to buy back at higher prices.
In 1982, the CFTC ruled in a settlement that their actions unlawfully manipulated the market. This included risks like a gamma squeeze in options trading.
This wild story shows why regulators must watch markets closely. Bloomberg’s old reports capture the chaos.
Inflation and Economic Turmoil
The 1970s era of stagflation and economic recession saw inflation reach 13.5% in 1980 according to the U.S. Bureau of Labor Statistics.
Silver positioned itself as a reliable inflation hedge and safe haven asset, closely paralleling gold’s remarkable 2,300% appreciation and strong returns over the decade.
Key triggers included:
- The 1973 OPEC oil embargo, which quadrupled oil prices and sparked commodity bets.
- Loose money policies in the early 1970s that fueled inflation.
These dynamics propelled silver prices from $1.60 per ounce in 1970 to more than $50 per ounce by January 1980.
In 1979, Paul Volcker took over the Fed and hiked rates to 20%. This killed inflation but crashed silver prices by 80% fast.
To handle similar risks today, try:
- ETFs like SLV for easy access.
- Physical silver coins or bars.
- Mining stocks for growth.
- COMEX futures for quick trades.
Check this table showing inflation and silver prices (correlation r=0.85 from Reuters). It highlights the link.
| Year | Inflation Rate (%) | Silver Price ($/oz, avg) |
|---|---|---|
| 1973 | 6.2 | 2.50 |
| 1975 | 9.1 | 4.80 |
| 1977 | 6.5 | 4.70 |
| 1979 | 11.3 | 11.00 |
| 1980 | 13.5 | 20.90 |
Post-1980 Silver Market Evolution
After the 1980 market crash and recovery, silver prices settled between $5 and $10 per ounce for decades. This shows steady long-term trends.
Adjusted for inflation, the $49 peak equals about $180 today. Use the Consumer Price Index (CPI) from the U.S. Bureau of Labor Statistics to see the difference between nominal and real values.
Price Decline and Stabilization
Silver prices dropped 78% in the bear market, from $49.45 to $10.89 by April 1980.
They stayed under $6 until 2003, while the gold-silver ratio (the ratio of gold price to silver price) hit 100:1, far from its usual 50:1, as supply chains steadied.
The downturn happened in two phases:
- First, the Hunt brothers sold 200 million ounces, flooding the market.
- Then, Fed Chair Paul Volcker raised rates to 20% in the 1980s, cooling demand.
LBMA charts from 1980 to 2000 show prices hitting lows of $4-$5 often.
Low demand from solar panels, electronics, and jewelry, plus high interest rates, kept prices down.
The iShares Silver Trust (SLV) ETF launched in 2006 and changed everything. It boosted liquidity for everyday investors and grew to $10 billion in assets by 2010-get in on this accessible silver action!
A 1999 Fed study on commodity cycles notes high volatility and chart patterns. It urges investors to diversify portfolios to handle gold-silver ratio swings and boost returns.
Current Silver Supply Dynamics
In 2023, global silver mine output hit 830 million ounces, per the Silver Institute. Mexico led with 24%, Peru added 14%, and China’s strong demand shaped the market.
Yet, a 184 million ounce deficit loomed due to low investment, few new finds, higher costs, and strict environmental rules. Act now-supply is tightening!
Key producers in 2023:
- Mexico: Fresnillo PLC mined 56 million ounces.
- Peru: Buenaventura produced 15 million ounces.
See the Silver Institute’s 2024 survey for forecasts.
Strikes and the pandemic worsened shortages. For example, the 2022 Peasquito mine strike in Mexico halted 200,000 ounces monthly. These disruptions signal bigger issues ahead-watch closely!
The USGS warns of a 5% annual production drop without new mines. This could worsen deficits. Track top silver stocks now to spot risks and opportunities!
The following table provides an overview of the top silver-producing nations, including their 2023 output in million ounces and year-over-year changes:
| Country | 2023 Output (M oz) | YoY Change |
|---|---|---|
| Mexico | 199 | -1.2% |
| Peru | 116 | +0.8% |
| China | 118 | -2.5% |
| Chile | 60 | +3.1% |
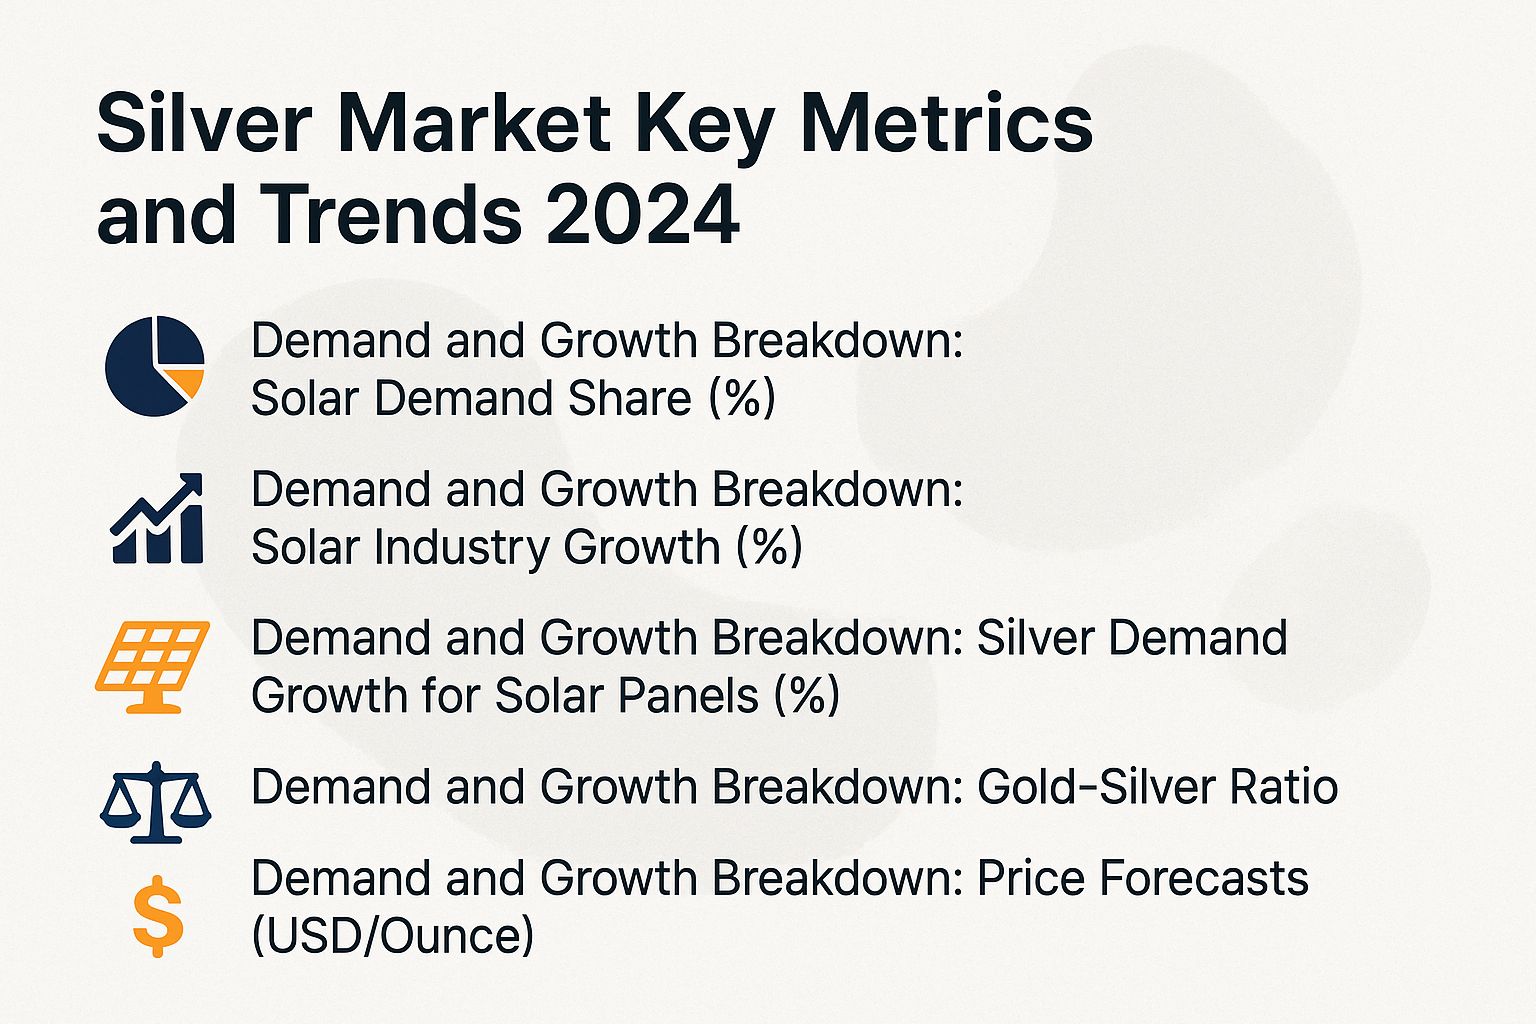
Silver Market Key Metrics and Trends 2024
Dive into 2024’s hot silver trends-don’t miss out!
Silver looks set for a bull market. Demand is surging in solar panels, electronics, and jewelry.
Technical charts show patterns with key resistance and support levels. A breakout could happen soon despite the ups and downs.
- Buy physical silver for hands-on ownership.
- Grab coins or bars for easy storage.
- Invest in silver ETFs to spread your risk without hassle.
Global events shake up silver prices. Watch these key factors:
- Central banks printing more money (that’s quantitative easing).
- Sky-high national debts.
- Tariffs sparking trade wars.
- India’s huge silver imports.
- Geopolitical tensions worldwide.
These could shift the gold-silver price ratio big time.
Top experts like Jim Rickards and Peter Schiff swear by silver. It shields your money from inflation in crises or recessions, delivering solid returns as a safe haven asset.
Join the buzzing silver community! Fans called ‘silver bugs’ and ‘stackers’ chat on forums, Reddit’s r/Silverbugs, and WallStreetBets about market manipulation claims.
They talk shorts (bets against price rises), squeezes (forced buying panics), gamma squeezes (options-driven spikes), and leveraged derivatives (high-risk trades amplified by borrowing).
Long-term trends look bright, even through bear markets (price drops). Short-term trades offer quick wins-act now on recycling and existing stockpiles shaping supply.
#m30iux7o.bar-container { position: relative; overflow: visible!important; } #m30iux7o.bar-value { position: absolute!important; left: 50%!important; top: 50%!important; transform: translate(-50%, -50%)!important; color: white!important; font-weight: 700!important; font-size: 14px!important; white-space: nowrap!important; background: rgba(0, 0, 0, 0.7)!important; padding: 4px 12px!important; border-radius: 20px!important; z-index: 30!important; text-shadow: 0 1px 2px rgba(0, 0, 0, 0.3)!important; pointer-events: none!important; display: inline-block!important; } #m30iux7o.animated-bar { z-index: 1!important; } @media (max-width: 768px) { #m30iux7o { padding: 16px!important; } #m30iux7o h2 { font-size: 24px!important; } #m30iux7o h3 { font-size: 16px!important; } #m30iux7o.bar-label { font-size: 12px!important; } #m30iux7o.metric-card { padding: 20px!important; } #m30iux7o.bar-value { font-size: 13px!important; padding: 3px 10px!important; } } @media (max-width: 480px) { #m30iux7o { padding: 12px!important; } #m30iux7o h2 { font-size: 20px!important; } #m30iux7o h3 { font-size: 14px!important; } #m30iux7o.bar-label { font-size: 11px!important; margin-bottom: 6px!important; } #m30iux7o.bar-value { font-size: 12px!important; padding: 2px 8px!important; min-width: 45px!important; text-align: center!important; } #m30iux7o.bar-container { height: 36px!important; overflow: visible!important; } }
Silver Market Key Metrics and Trends 2024
Key factors in the silver market include silver futures traded on COMEX, historical volatility from the Hunt brothers, and current mining production led by Mexico production and Peru silver mines. Investor interest via ETF silver such as SLV is driven by China demand and India imports. Experts like Jim Rickards and Peter Schiff highlight opportunities discussed in Reddit silver communities and WallStreetBets, amid risks of margin calls.
Demand and Growth Breakdown: Solar Demand Share (%)
Demand and Growth Breakdown: Solar Industry Growth (%)
Demand and Growth Breakdown: Silver Demand Growth for Solar Panels (%)
Demand and Growth Breakdown: Gold-Silver Ratio
Demand and Growth Breakdown: Price Forecasts (USD/Ounce)
(function() { setTimeout(function() { var bars = document.querySelectorAll(‘[class*=”animated-bar-m30iux7o”]’); bars.forEach(function(bar) { var width = bar.getAttribute(‘data-width’); if (width) { bar.style.width = width + ‘%’; } }); }, 100); })();
The Silver Market Key Metrics and Trends 2024 dataset illuminates the evolving role of silver in industrial applications, particularly in the renewable energy sector, alongside investment dynamics and price outlooks. This data underscores silver’s dual nature as both an industrial metal and a safe-haven asset, with growing China demand from green technologies driving market shifts.
Demand and Growth Breakdown highlights the surge in solar-related silver use. The solar demand share has risen dramatically from 6% in 2015 to 16% in 2024, reflecting silver’s critical role in photovoltaic (PV) cells, where it conducts electricity in conductive pastes. This growth aligns with the global push for clean energy, as solar installations expand to combat climate change, bolstered by rising India imports. The solar industry growth metrics further emphasize this momentum: a robust 76% increase in 2023, a forecasted 34% in 2024, and an impressive 27% annualized growth since 2015. These figures indicate sustained expansion in solar capacity, potentially straining silver supplies and elevating prices if mining doesn’t keep pace.
- Silver demand growth for solar panels jumped 158% from 2019 to 2023, fueled by technological advancements like thinner, more efficient PV cells that still require high-purity silver. The 20% forecast for 2024 suggests continued, though moderating, upward trajectory, as efficiencies improve but overall adoption accelerates in regions like Asia and Europe.
- The gold-silver ratio, at 85 in 2024 compared to a historical average of 70 since the 1980s, implies silver is relatively undervalued against gold. Investors often view a higher ratio as a signal to accumulate silver, anticipating mean reversion that could boost its price relative to gold amid economic uncertainties, much like the Hunt brothers‘ legendary squeeze on the COMEX.
Price forecasts add nuance to the outlook, with 2024 targets at $34.7 and $37.7 per ounce, reflecting optimism from industrial demand. However, the projected end-of-December 2024 price of $28.9 suggests potential short-term volatility, possibly due to macroeconomic factors like interest rates or supply gluts from key producers such as Mexico production and Peru silver mines. Overall, these trends position silver as a key beneficiary of the energy transition, urging stakeholders to monitor solar innovations and geopolitical influences on mining output.
In summary, the 2024 silver market data reveals robust growth in solar applications, positioning the metal at the intersection of sustainability and investment. With demand outpacing historical norms, silver’s value proposition strengthens, offering opportunities for diversified portfolios while highlighting supply chain challenges in the green economy.
Demand Factors in Modern Economy
According to the Silver Institute, silver demand reached 1.2 billion ounces in 2023, with industrial applications accounting for 54% of total consumption. This growth was primarily driven by the photovoltaics sector, which utilized 131 million ounces annually, alongside surging ETF silver investments.
Industrial and Green Tech Uses
In solar panels, the usage of silver paste per module increased by 20% to 20 grams in 2023, according to the ITRPV report. This development supports 12% of global photovoltaic (PV) capacity additions in pursuit of net-zero emissions objectives.
This notable increase highlights silver’s critical importance across various industries.
In the electronics sector, silver consumption reaches 265 million ounces annually, facilitating high-conductivity components essential for electric vehicles (EVs) and 5G networks, as evidenced by EPA conductivity studies. Demand from solar applications reached 131 million ounces in the same period, reflecting a 30% year-over-year growth (Bernreuter Research).
In the medical field, silver is incorporated into antibacterial coatings for more than 1,000 products.
A representative case is Tesla’s Gigafactory, which utilizes approximately 500 kilograms of silver each year for battery production.
Recent innovations, as detailed in a 2023 Nature publication, have enhanced PV efficiency by 5-10% through the optimization of silver paste formulations.
The demand distribution for silver is as follows:
- electronics (50%),
- solar (25%),
- and medical/industrial applications (25%).
To capitalize on these trends, manufacturers are advised to conduct thorough audits of their silver sourcing strategies to enhance supply chain resilience.
Macroeconomic Influences on Silver
Silver prices move opposite to real yields. JPMorgan data from 2010 to 2023 shows a strong inverse correlation, with a coefficient of -0.72. A negative coefficient means they trend in opposite directions.
This makes silver a great shield against inflation. Prices rose 25% in 2022 as U.S. inflation (measured by the Consumer Price Index) hit 8%.
Interest Rates and Inflation
The Federal Reserve kept interest rates steady at 5.25-5.50% in 2024. Silver prices fell 5% from last year but bounced back as inflation worries grew, just like the 15% jump in 2022 when CPI-a key inflation measure-reached 9.1%.
High interest rates make holding silver less appealing. It earns no interest, so people prefer assets that do. But inflation eats away at cash value. This pushes folks toward silver for protection, like when prices hit $50 per ounce in 1980 during 13.5% inflation.
Post-COVID-19 quantitative easing initiatives, including a $4 trillion expansion of the Federal Reserve’s balance sheet, propelled silver prices to $30 per ounce by 2021.
The historical correlation between inflation and silver returns, drawn from World Bank data spanning 1971 to 2023, is presented in the table below:
| Period | Avg. Annual Inflation (%) | Silver Annual Return (%) |
|---|---|---|
| 1971-1980 | 7.1 | 28.5 |
| 1981-1990 | 5.3 | -4.2 |
| 2001-2010 | 2.5 | 12.8 |
| 2011-2023 | 2.1 | 3.4 |
Key takeaways from the data:
- High inflation in the 1970s led to huge silver gains of 28.5% yearly.
- Lower inflation in later decades meant smaller or negative returns.
- Silver shines brightest when prices rise fast.
Forecast sensitivity analysis suggests that a 2% reduction in interest rates could elevate silver prices by $5 per ounce, in line with the consensus view of Reuters analysts.
Geopolitical and Investment Trends
Geopolitical risks, such as the 2022 conflict in Ukraine, drove a 10% increase in silver prices as investors sought safe-haven assets. This resulted in the iShares Silver Trust (SLV) ETF accumulating holdings of 500 million ounces, while institutional allocations rose by 15%, as noted by experts like Jim Rickards and Peter Schiff, according to data from BlackRock.
This momentum continues in the face of growing demand for exchange-traded funds (ETFs), with SLV’s assets under management reaching $12 billion. Retail investors are contributing significantly to this expansion through accessible platforms like Robinhood and communities such as Reddit silver and WallStreetBets, where approximately 1 million ounces of silver are traded daily.
The current gold-silver ratio of 80:1 signals potential undervaluation of silver, a pattern reminiscent of Warren Buffett’s strategic acquisition of a $140 million silver position in 1997 as a hedge against economic crises.
For effective portfolio diversification, financial experts recommend allocating 5-10% to silver, in line with principles advocated by Ray Dalio. This approach aligns with insights from the World Gold Council regarding the stabilizing role of precious metals.
A 2023 BIS report highlights how commodities like silver save portfolios in crises. Get started with these easy options:
- Buy SLV ETF shares for simple exposure without storing metal.
- Grab physical silver bars from trusted sellers like APMEX.
- Use cheap brokers and tools like TradingView to track prices and ratios.
Act now-build your silver position before the next big move!
Price Projections: Can It Hit $50 Again?
Citigroup analysts see silver hitting $32 per ounce by 2025. In a hot market with supply shortages and booming green tech demand, it could soar to $50-echoing the 2011 high of $48.70 (about $65 today after inflation adjustment). Imagine the gains!
Expert price outlooks:
- UBS base case: $28-$35 per ounce, thanks to steady factory use.
- CPM Group warning: If supply falls short by 200 million ounces a year, expect a bull run to $45-$60. Solar panels and electric cars will fuel the surge-get in early!
Silver now has support at $22 per ounce. This matches recent lows.
It faces resistance at $30 per ounce. This lines up with the 50-day moving average on Kitco charts.
Try dollar-cost averaging into ETFs like SLV. Also, watch Commitments of Traders (COT) reports closely. COT reports show how big traders are positioning in the market.
Check out these exciting scenarios for silver prices. Get ready for potential big moves!
| Scenario | Trigger | Price Impact |
|---|---|---|
| Inflation Spike | 10% rise in Consumer Price Index (CPI) | $40+ (Silver Institute 2024) |
| Recession | GDP contraction | $25-28 safe-haven dip |
Remember the 1980 silver surge? It shows these price jumps can happen as we shift to green energy.
Risks and Barriers to Recovery
CBOE and COMEX data show silver’s 30-day volatility at 25%. Volatility is how much prices swing up and down. That’s higher than gold’s 15%.
Watch out for more recycling from e-waste, hitting 150 million ounces. This could balance out shortages from mines in Mexico and Peru.
Demand from China and India is growing fast. But the Federal Reserve, the US central bank that sets interest rates, rate hikes might limit price gains.
Investors are advised to address the following four key risks.
- Volatility swings prices wildly. Protect yourself with options or silver ETFs like SLV. Note the VIX link of 0.6, where VIX measures market fear.
- Solar panels might switch to copper instead of silver. IRENA’s 2022 study highlights this risk.
- Regulators are watching closely after events like GameStop and the Hunt brothers’ squeeze. Reddit chats on WallStreetBets about silver add to the buzz.
- Economic slowdowns hurt demand. Industrial use could drop 20% in a recession.
Silver dropped 55% in the 2008 crisis. Build a diverse portfolio to bounce back, as experts like Jim Rickards and Peter Schiff advise. IMF studies back this up. Don’t repeat that mistake!
Grab this risk matrix now to assess threats quickly!
| Risk | Probability (%) | Impact (High/Med/Low) | Solution |
|---|---|---|---|
| Volatility | High (70) | High | Use options to hedge |
| Substitution | Med (40) | Med | Diversify sources |
| Regulatory | Low (20) | High | Monitor SEC rules |
| Slowdown | Med (50) | High | Stockpile strategy |