As silver prices surged 25% in 2024 amid industrial booms and economic uncertainty, investors eye it as a hedge against volatility. This metal’s dual role in precious assets and green tech amplifies its appeal for 2025. Explore its historical trends, supply-demand dynamics, inflation impacts, solar-driven demand, geopolitical risks, and comparisons to gold-uncovering if silver truly stands out as the premier investment choice.
Historical Performance of Silver
Silver’s price history shows big ups and downs. In the 2000s bull market, it skyrocketed 500% from $5 to $30 per ounce, based on Kitco charts.
Key Trends Over the Past Decade
Between 2014 and 2024, silver prices fluctuated significantly, reaching a low of $11.80 per ounce in 2015 and a high of $29.45 per ounce in 2020. This period marked a cumulative gain of 150 percent, influenced by various global events.
Silver Institute data shows volatility with a 12% compound annual growth rate (CAGR, the average yearly growth over time). After the 2011 correction, prices dropped 70% to $14 per ounce by 2015 due to weaker industrial demand.
This trend highlights silver’s sensitivity to economic shifts.
The COVID-19 pandemic triggered a notable rally in 2020, doubling silver values within months as investors sought safe-haven assets. Prices peaked at $26 per ounce in 2022 amid inflationary pressures and supply chain disruptions.
By 2023 and 2024, silver prices stabilized around $23 per ounce, propelled by the growing demand from the electric vehicle (EV) sector, particularly for photovoltaic applications and battery production.
Investors, check the XAGUSD chart on TradingView. It shows a drop after 2015, a big jump in 2020, and steady rise since 2022 thanks to green tech growth.
Spread your risk with exchange-traded funds (ETFs, baskets of silver shares traded like stocks) like SLV for easy market access.
Lessons from Previous Market Cycles
The 1980 Hunt Brothers’ squeeze drove silver to $50 per ounce before an 80% crash. It warns against wild speculation in metals-learn from history to invest smarter!
Historical market cycles provide valuable lessons for investors.
- During the 1970s stagflation era, silver prices rose by 300% amid double-digit inflation, according to Federal Reserve data. This demonstrates the efficacy of precious metals as inflation hedges; allocate 10-20% of your portfolio now to protect against rising prices!
- The 2008 financial crisis resulted in a 50% decline in silver prices due to liquidity constraints during recessions, as documented by CPM Group reports. To mitigate such downturns, maintain adequate cash reserves now to weather the storm!
- The 2011 market peak and subsequent bust, initiated by over-leveraged exchange-traded funds that triggered a flash crash, serves as a cautionary tale against futures speculation. Investors are advised to focus on physical holdings today to avoid pitfalls!
Try this smart move: Use dollar-cost averaging. Buy fixed amounts of silver each month via sites like APMEX to beat volatility-start today and build wealth steadily!
Current Market Overview
Silver’s spot price hit $24.50 per troy ounce (a standard weight measure) in late 2024. That’s a 25% jump this year, fueled by industry rebound and $1.5 billion in ETF (exchange-traded fund) investments.
2024 Price Dynamics
Silver prices swung wildly in 2024. Here’s the breakdown:
- January low: $22.
- March peak: $25.50, sparked by inflation fears.
- Fourth quarter: Stabilized at $24 after Fed rate cuts.
Break down the phases:
- First quarter rally: 15% gain from strong ETF inflows.
- iShares Silver Trust (SLV) holdings up 10%, per Bloomberg.
Get excited-silver’s momentum is building!
The summer saw an 8% drop in silver prices. A stronger U.S. dollar triggered overbought signals on the Relative Strength Index (RSI)-a momentum indicator that flags potential sell-offs when above 70 on daily charts.
The rebound in the fall was supported by a 20% expansion in industrial demand, bolstered by elevated trading volume in COMEX silver futures, which reached 150 million ounces.
- Spot patterns fast with TradingView-set up RSI alerts today!
- Dive into iShares reports for ETF flow details to nail your entry timing.
Supply and Demand Balance
In 2024, global silver supply totaled 1.03 billion ounces, while demand reached 1.2 billion ounces, resulting in a deficit of 180 million ounces, according to the Silver Institute.
- Mining: 61% of supply (630 million ounces)
- Recycling: 25% (170 million ounces from scrap materials)
See the USGS 2024 report for details.
- Mexico leads with 6,300 metric tons of output.
- Peru follows at 3,600 metric tons.
These countries supply over 25% of the world’s silver-huge players to watch!
- Industrial uses: 50% (600 million ounces) for electronics and solar panels.
- Jewelry: 20% (240 million ounces).
- Investment: 30% (1,200 tons of bullion).
Economic Factors for 2025
Economists project that silver prices will average $28 per ounce in 2025, driven by sustained inflation exceeding 2.5% and anticipated Federal Reserve interest rate reductions to the 3-4% range.
Inflation and Interest Rates
The Consumer Price Index (CPI)-a key measure of inflation-is set to hit 2.8% in 2025.
Silver shows a strong link to inflation (correlation of 0.7), making it a top hedge over bonds that yield under 4%.
Historically, silver prices have increased by approximately 15% for every 1% rise in CPI. For instance, in 2022, when inflation peaked at 9.1%, silver appreciated by more than 20%, rising from $23 to $27 per ounce (U.S. Bureau of Labor Statistics data).
Falling interest rates boost this trend.
The Fed’s latest projections point to cuts down to 3.5% by mid-2025. Expect silver to climb 10-20% as holding cash or bonds becomes less appealing (IMF World Economic Outlook, October 2024).
Jump into ETFs like SLV for easy silver exposure.
Put $10,000 in now-it could grow 12% yearly for a $1,200 gain! Beat inflation and spread your risk beyond other commodities.
Global Growth Projections
The International Monetary Fund (IMF) forecasts a global GDP growth rate of 3.2% for 2025, with emerging markets such as China and India accounting for 40% of silver demand through approximately 800 million ounces utilized in industrial applications.
- United States: 2% growth with a 25% recession risk (NBER). Turn to silver as your safe haven!
- China: 4.5% growth, fueled by 300 million ounces for EV batteries.
- India: 6.5% growth, using 150 million ounces for jewelry.
According to the World Bank’s 2024 report, these trends emphasize industrial momentum as the predominant driver, surpassing inflationary pressures.
Trade wars might shake things up with 5% volatility.
Build a diversified portfolio now to dodge risks and seize big wins from emerging market booms!
Industrial and Technological Demand
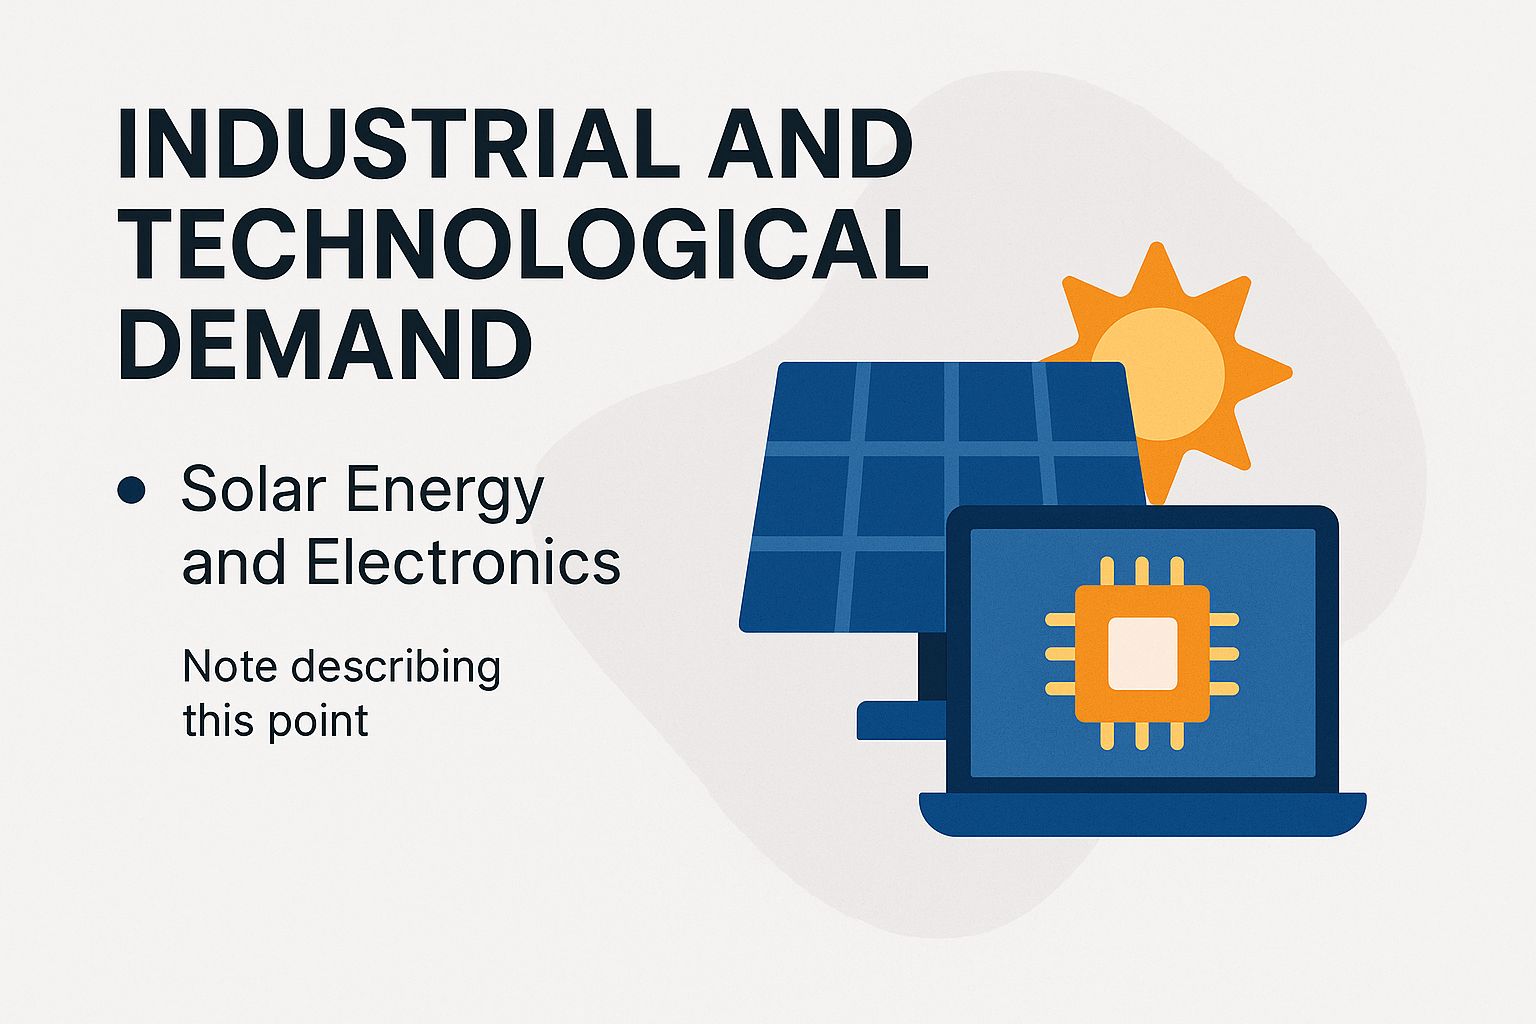
The industrial demand for silver is projected to reach 650 million ounces in 2025, representing a 10% increase from prior levels, driven predominantly by the solar panel sector, which is expected to consume 120 million ounces annually.
Solar Energy and Electronics
Photovoltaic solar panels are projected to require 150 million ounces of silver in 2025, an increase from 100 million ounces in 2023, as global installations reach 500 GW according to data from the International Renewable Energy Agency (IRENA). This surge corresponds to a 20% annual growth in solar demand, with each panel consuming approximately 20 grams of silver for conductive pastes, in line with BloombergNEF’s forecast of a 25% compound annual growth rate (CAGR) through 2030.
Electronics add even more pressure on silver supply. They need 200 million ounces for 5G networks and electric vehicles in 2025.
EV batteries use about 10 grams of silver each. Tesla’s 1 million vehicles a year require around 50 tons for key parts.
Advanced Investment Strategies for Silver
The economic outlook for silver in 2025 looks promising. Check market forecasts and price predictions now.
Invest in mining stocks. Also look at the jewelry market, coins, and bars. Factor in storage, taxes, and regulations.
Central banks’ policies and recession fears impact prices. Stay alert to these risks.
Silver plays a key role in exciting growth areas. Think 5G tech, EV batteries, water purification, and medical devices.
Silver investments are easy to start. Choose speculation, long-term holding, or quick trades.
Use these technical tools to make smart choices:
- Chart patterns
- Support and resistance levels
- Moving averages
- RSI indicator (measures speed and change of price movements)
- MACD (shows relationship between two moving averages)
Pair them with fundamental analysis for best results.
Keep a close eye on these factors to spot opportunities fast:
- News events and earnings reports
- Fed and ECB policy changes
- China demand and India imports
- Production from Peru and Mexico mines
Watch for supply risks too, like labor strikes or strict environmental rules. ESG standards and carbon concerns could shake things up.
Compare silver to other options like crypto, real estate, stocks, and bonds. Look at the yield curve (it shows interest rate differences over time). Key economic signs matter: PPI (producer price index, tracks wholesale inflation), unemployment rates, and global trends. Trade wars, sanctions, and currency swings add risks-act quickly to protect your portfolio!
Silver shortages hit recycling and jewelry hard. Central bank buying ramps up demand and volatility-get in before prices spike!
Start easy with bullion or ETFs for quick liquidity. Pick long-term holds or short-term trades using chart patterns and indicators.
Silver’s antibacterial powers are booming! EPA studies show nanoparticles in medical devices fight germs effectively.
This boosts demand fast. Optimize supply chains now by recycling from EV batteries and solar panels to meet the rush.
Geopolitical and Risk Influences
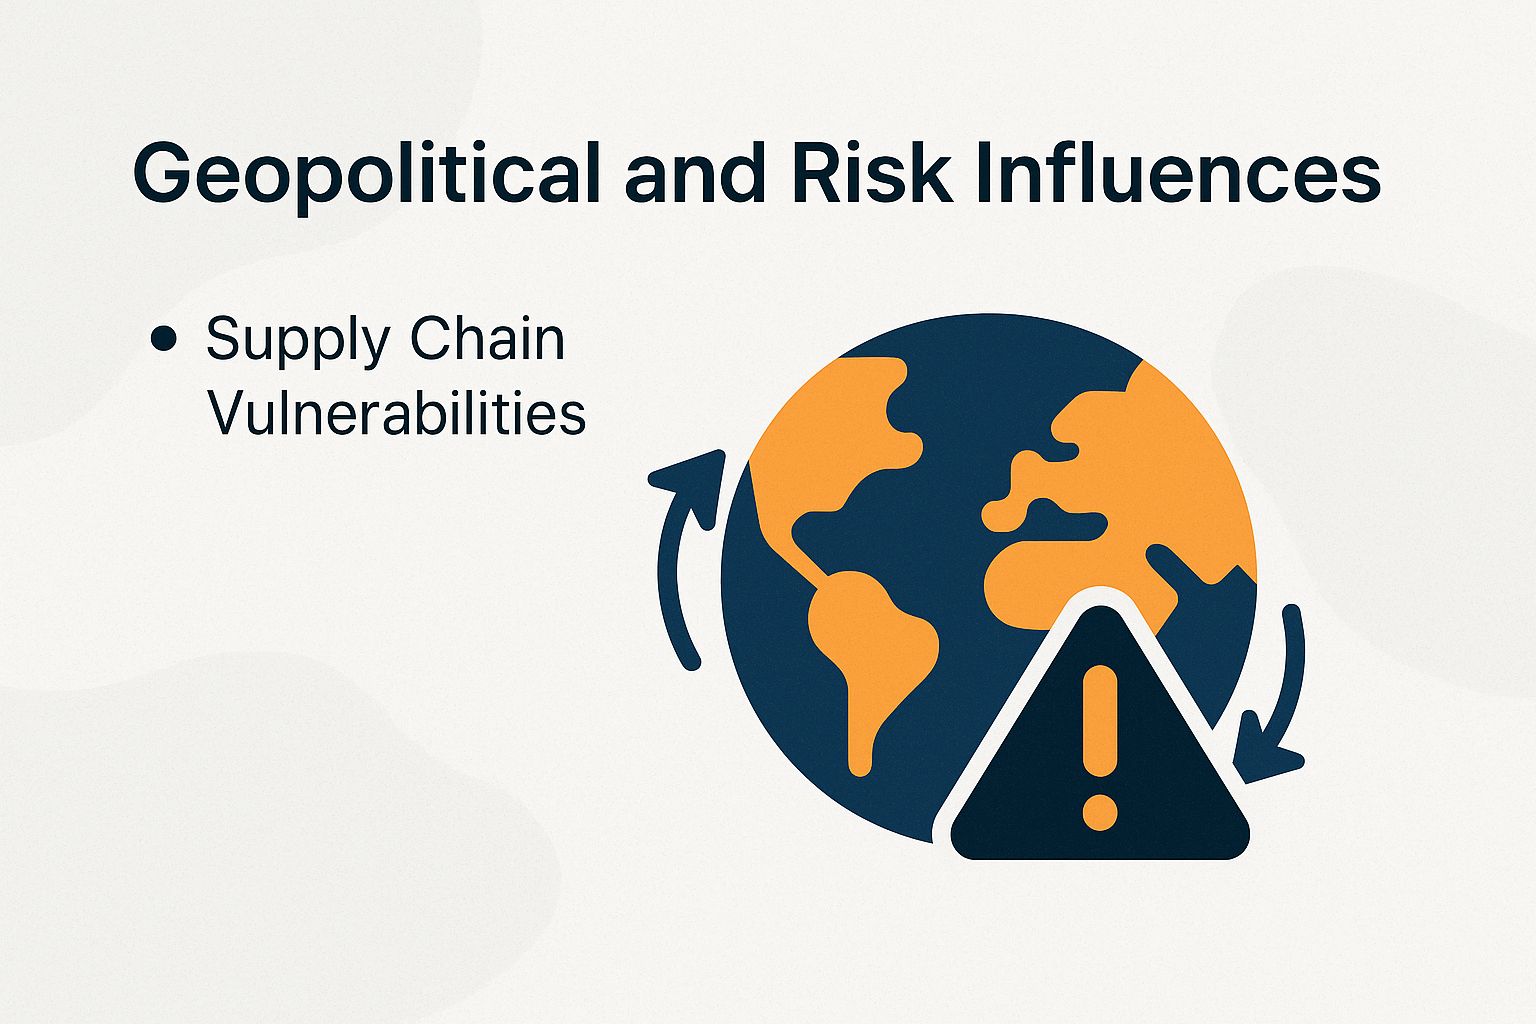
Geopolitical drama could push silver prices up 15% in 2025! US-China trade fights, strong USD, huge China demand, Fed moves, and ECB policies disrupt supplies-hitting 40% of global mining.
Supply Chain Vulnerabilities
About 70% of silver comes from polymetallic mines (mines that produce multiple metals) in Latin America and Asia.
Tariffs make these areas risky-they hiked costs 5% in 2024, per USGS. Rising India imports make it worse-supply could tighten soon!
Key vulnerabilities in the silver supply chain include mining strikes, escalating trade wars, and inadequate recycling efforts. For example, the 2023 strikes in Peru mines disrupted about 10% of global silver output, while Mexico offers more stable production.
Diversify suppliers to stable regions like Australia. Pay close attention to ESG factors, which stand for Environmental, Social, and Governance standards.
Trade wars add to the headaches. U.S. tariffs on Chinese imports raised costs by an extra 2%, according to the World Trade Organization’s 2024 report on mineral trade barriers. Smart organizations use sourcing strategies that follow WTO rules to handle this.
We only recycle enough silver to cover 25% of demand right now. Boost this with urban mining, which pulls silver from e-waste like old 5G devices using hydrometallurgical methods-a process that uses chemicals to extract metals.
Beat these risks head-on with silver futures options. They let you lock in prices now and keep your supply chain rock-solid-don’t miss out on this smart move!
Comparison with Gold and Alternatives
Silver swings more wildly than gold, with 25% volatility each year. It delivers better growth at a 12% compound annual growth rate (CAGR, or average yearly return) over the past decade, beating gold’s 7%.
This shines during strong economic growth and inflation spikes, tracked by CPI (Consumer Price Index) and PPI (Producer Price Index). Silver suits bold portfolios, especially paired with platinum ETFs (funds that track platinum prices).
To evaluate these metals comprehensively, it is advisable to review their key characteristics:
| Metal | Price/Oz | Industrial Use | Key Traits | Best For |
|---|---|---|---|---|
| Gold | $2,300 | 10% | Stable hedge; performs well in recessions | Wealth preservation |
| Silver | $25 | 50% | Growth-oriented asset; excels in economic expansions with exposure to technology sectors | Aggressive growth |
| Platinum | $950 | 80% | Primarily automotive applications; elevated risk profile | Industrial investments |
- Try palladium futures if you crave extra excitement and volatility.
- Go for ETFs like SLV for silver exposure or GLD for gold.
- Start small with just $50 to $100 through trusted brokers like Fidelity.
The CPM Group experts predict silver’s big rise, fueled by breakthroughs in green technology. Get excited-this could supercharge your investments!
Aim for a 60/40 split between gold and silver in your portfolio. This setup hedges risks while grabbing growth opportunities.
Investment Strategies and Risks
A balanced silver investment strategy may allocate 5-10% of a portfolio to physical bullion and the SLV ETF, with a target of 15% annual returns and downside protection limited to 20% through the use of stop-loss orders.
To implement this strategy, the following approaches are recommended:
- Physical Bullion: Buy 1-ounce silver coins for a $2 premium over spot price from dealers like APMEX. Store in pro vaults for $100 yearly-that’s only 0.5% of the value.
- Exchange-Traded Funds (ETFs): Invest in the SLV ETF, which closely tracks silver prices and carries an expense ratio of 0.5%, with a minimum investment of $10,000. This option provides liquidity and eliminates the need for physical handling.
- Mining Stocks: Allocate funds to established companies such as Pan American Silver, which recent Morningstar analyst reports indicate offers 20% upside potential, providing leveraged exposure to silver price movements.
- Futures Contracts: Engage in trading COMEX silver futures with a margin requirement of $5,000 for short-term positions, informed by RSI indicator and MACD analysis; however, restrict this allocation to no more than 2% of the portfolio given its high volatility (beta of 1.5).
Long-term holds often deliver 10% returns, while speculative plays get about 5%, based on SEC guidelines. Diversify to slash those risks and protect your gains.
Silver Investment Performance Metrics 2025
#me2z158r.bar-container { position: relative; overflow: visible!important; } #me2z158r.bar-value { position: absolute; left: 50%; top: 50%; transform: translate(-50%, -50%); color: white; font-weight: 700; font-size: 14px; white-space: nowrap; background: rgba(0, 0, 0, 0.7); padding: 4px 12px; border-radius: 20px; z-index: 30; text-shadow: 0 1px 2px rgba(0, 0, 0, 0.3); pointer-events: none; display: inline-block; } #me2z158r.animated-bar { z-index: 1!important; } @media (max-width: 768px) { #me2z158r { padding: 16px!important; } #me2z158r h2 { font-size: 24px!important; } #me2z158r h3 { font-size: 16px!important; } #me2z158r.bar-label { font-size: 12px!important; } #me2z158r.metric-card { padding: 20px!important; } #me2z158r.bar-value { font-size: 13px; padding: 3px 10px; } } @media (max-width: 480px) { #me2z158r { padding: 12px!important; } #me2z158r h2 { font-size: 20px!important; } #me2z158r h3 { font-size: 14px!important; } #me2z158r.bar-label { font-size: 11px!important; margin-bottom: 6px!important; } #me2z158r.bar-value { font-size: 12px; padding: 2px 8px; min-width: 45px; text-align: center; } #me2z158r.bar-container { height: 36px!important; } }
Silver Investment Performance Metrics 2025 for Portfolio Diversification
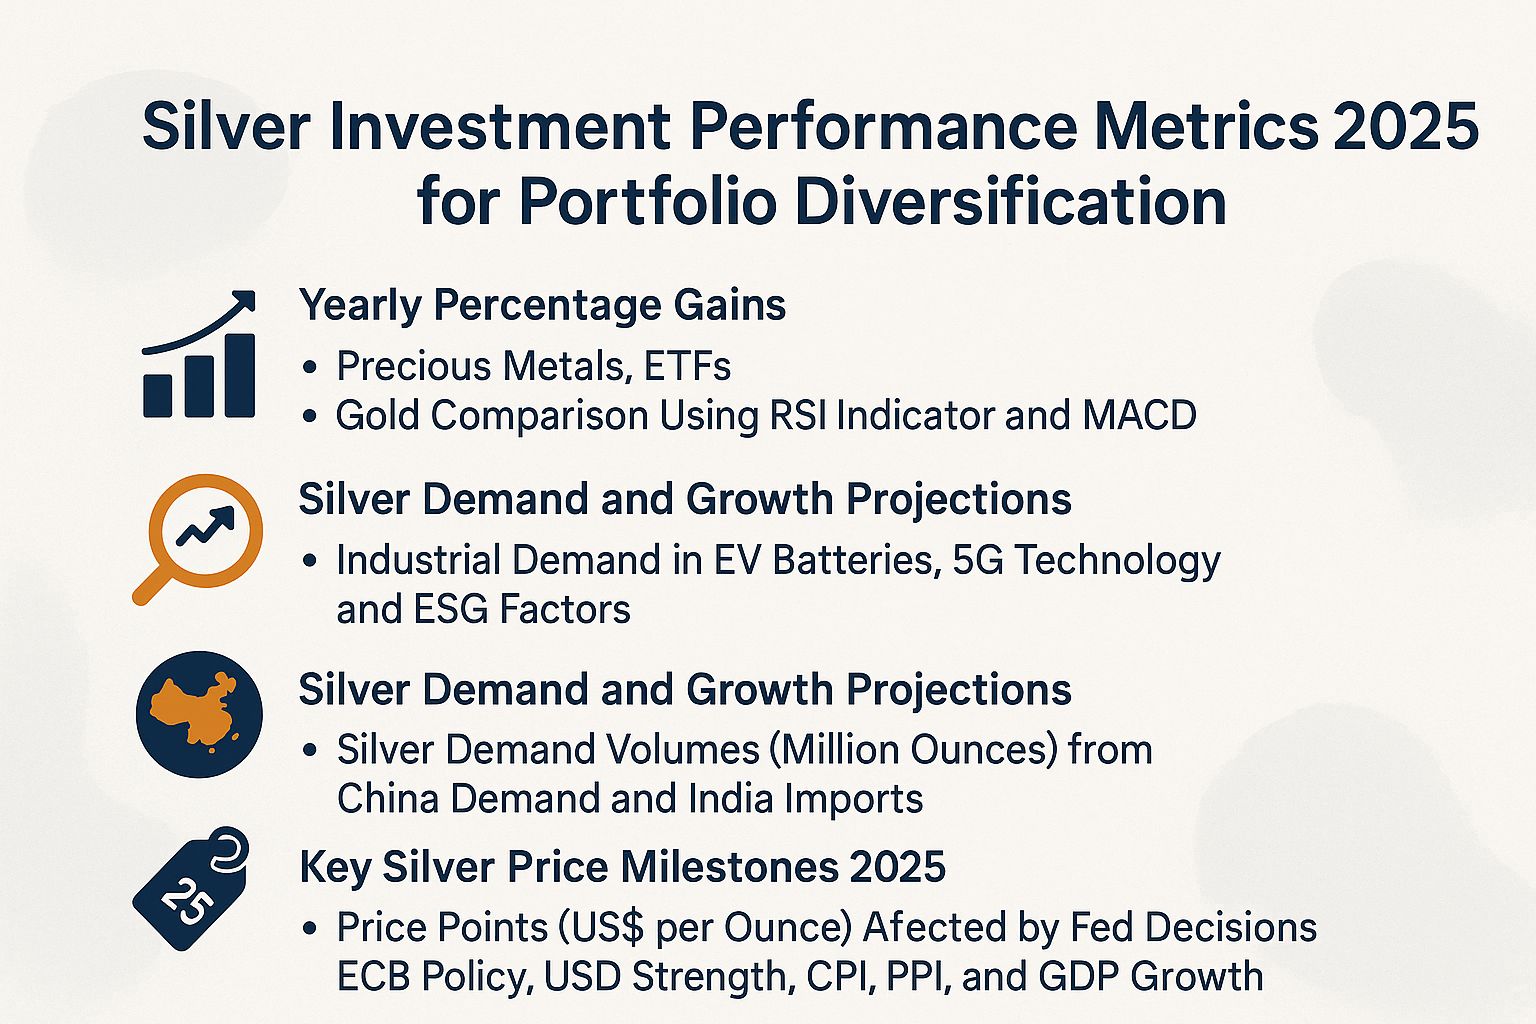
Yearly Percentage Gains: Precious Metals, ETFs, Gold Comparison using RSI Indicator and MACD
Silver Demand and Growth Projections: Industrial Demand in EV Batteries, 5G Technology, and ESG Factors
Silver Demand and Growth Projections: Silver Demand Volumes (Million Ounces) from China Demand and India Imports
Key Silver Price Milestones 2025: Price Points (US$ per Ounce) Affected by Fed Decisions, ECB Policy, USD Strength, CPI, PPI, and GDP Growth
(function() { setTimeout(function() { var bars = document.querySelectorAll(‘[class*=”animated-bar-me2z158r”]’); bars.forEach(function(bar) { var width = bar.getAttribute(‘data-width’); if (width) { bar.style.width = width + ‘%’; } }); }, 100); })();
Silver investments shone brightly in 2025! The Silver Investment Performance Metrics 2025 show huge gains in silver and related assets, thanks to booming industrial demand and market excitement. This data highlights silver’s double duty as a safe investment during tough times and a key metal for industries like renewable energy and 5G technology.
Yearly Percentage Gains show silver beating many precious metals.
Silver prices jumped 75%. This beat gold’s 51% rise but fell short of platinum’s 80% surge.
The iShares Silver Trust ETF climbed 68%. Other ETFs (exchange-traded funds that track prices) let investors join in without buying physical silver.
From 2024 lows, silver bounced back 105%. Silver junior stocks rocketed 183%, thanks to wild swings, big rewards, and ESG factors (environmental, social, and governance trends) in mining and exploration.
These numbers scream strong trust from investors despite shaky economies. Silver acts as a shield against rising prices, as shown by CPI (Consumer Price Index) and PPI (Producer Price Index) data.
- Silver Demand and Growth Projections point to steady industrial hunger. In 2024, demand from factories, boosted by China and India, rose 4% to 680.5 million ounces.
- For 2025, expect 677.4 million ounces. Photovoltaic (PV) demand for solar panels alone will hit 195.7 million ounces, plus more for EV batteries.
- Power needs for data centers will grow 21% over the next four years. AI electricity use jumps 33% each year, ramping up silver in 5G tech, gadgets, and buildings.
- Back in the 2010s, solar power grew 200% more than expected. This supercharged silver’s spot in green tech-get ready for more!
These forecasts mean demand will keep pushing. Supply from Mexico and Peru might tighten, driving prices up as silver powers tech faster than old uses like jewelry.
Key Silver Price Milestones 2025 show a thrilling climb:
- Q3 start: $36.03 per ounce.
- July high: $39.3.
- September breakout: $40.0.
- September 15 peak: $42.69.
- Q3 end: $46.66.
- All-time high on October 17: $54.47!
This ride came from global tensions, Fed and ECB moves, despite strong USD. Watch RSI (Relative Strength Index) and MACD (Moving Average Convergence Divergence) for smart buys-prices could soar higher!
Silver looks set for a stellar 2025, powered by tech and green energy. Jump in now-track GDP growth, supply squeezes, and economy twists to nail the best spot!