Gold gets all the attention for fighting inflation. But silver, the white metal, quietly shines brighter during tough economic times.
It often delivers better returns and is easier to buy and sell. With prices rising fast and costs eating into savings, smart investors need assets like silver to protect their money.
Silver acts as a safe spot when central banks change money policies. This piece explores silver’s past wins, how it stacks up to gold, its cool perks like use in industry and fighting germs, risks such as wild price swings and storage fees, and what’s ahead-especially with huge national debts and shifting interest rates. Don’t miss out on this hidden gem!
Defining an Inflation Hedge
An inflation hedge is an investment that holds or grows its value as prices rise. Silver proved tough back then, keeping 95% of its buying power during the wild 1970s inflation, per the World Gold Council-making it solid protection against weakening money.
Build your inflation hedge with these simple steps:
- Spot main inflation causes. Watch things like government spending (fiscal policy), budget shortfalls, economic growth (GDP), jobless rates, and key inflation measures (core inflation is everyday price changes excluding food and energy; PPI tracks producer costs; PCE is a broad price gauge; hedonic adjustments tweak for quality improvements). Keep an eye on CPI reports from the Bureau of Labor Statistics-these show average price changes. Act when yearly rises top 3%, like now with spiking energy costs, higher wages, and shaky consumer moods.
- Watch CPI monthly.
- Jump in at 3%+ inflation.
- Pick assets that don’t rise and fall with inflation. Go for silver-its link to CPI is low at 0.2 (per Morningstar, meaning it doesn’t follow prices closely)-or TIPS (bonds that adjust for inflation from the US Treasury). Skip stocks, which track CPI at 0.8 and crash hard. Try ETFs: SLV for easy silver access, TIP for TIPS-both liquid (easy to sell) with no storage hassle.
- Put 5-10% of your investments into hedges, based on your comfort with risk. Use dollar-cost averaging (buy fixed amounts regularly to average prices), buy-and-hold (keep long-term), or yield farming in DeFi (earning rewards on crypto platforms, but risky). Rebalance every quarter to stay on track, especially with changing bond rates.
During the 2008 crash and risks of stagflation (slow growth with high inflation), TIPS beat stocks by 12%, says Vanguard. They protected against falling prices and housing crashes-get in now before the next dip!
The Basics of Silver as an Asset
The Silver Institute says we mined 27,000 metric tons worldwide in 2022. Silver plays double duty as a shiny precious metal and key industrial player-half its use goes to solar panels and gadgets, thanks to top-notch electricity flow and germ-killing power. Exciting times for green tech!
Historical Context and Supply Dynamics
Silver mining started around 3000 BC in ancient Anatolia (now Turkey). Today, we’re short 15% on supply in 2023 (Silver Institute), since 70% comes as a side product from copper and lead mines-this hits stockpiles and recycling hard.
This setup creates big risks, especially with world politics. Check these main supply issues:
- Depends on byproducts-70% from other mines (USGS)-so silver supply swings with basic metals like copper and eco-friendly mining trends.
- World troubles in top spots like Mexico (23% supply) and Peru (14%)-strikes and rules often halt mining. Stay alert to these hotspots!
- Growing need from green tech: Solar uses 12% of silver yearly (Silver Institute), plus EVs and batteries. This boosts ESG investing (funds focusing on environment, social, governance) and helps the planet.
Silver’s price swings show its risks. Speculation and manipulation play big roles.
- In 1980, the Hunt Brothers tried to control the market. Prices hit $50 per ounce, then crashed hard.
- In 2011, during the financial crisis, prices reached $49 per ounce. Investors rushed in for safety.
- In 2023, supply shortages highlight ongoing issues. Check USGS reports often for forecasts, and watch spot prices and futures trends.
Silver’s Performance During Past Inflationary Periods
The 1970s saw huge inflation, averaging 7.1% a year per Bureau of Labor Statistics. It felt like a massive commodity boom, similar to gold standard times.
Silver prices soared 1,200%, from $1.50 to $50 per ounce. It beat gold by 3 percentage points – an exciting win for investors!
Silver repeated its strong performance in later crises.
From 2008 to 2011, financial chaos hit. Central banks printed money through quantitative easing – that’s when they create new cash to boost the economy.
Silver jumped 400%, from $9 to $49 per ounce, per COMEX data. It protected against falling paper money values, driven by the weakening dollar.
After COVID, from 2020 to 2022, silver rose a solid 50% to $26 per ounce. Inflation peaked at 8.5%, but results varied with changing markets.
A 2019 Federal Reserve study (Working Paper 19-15) shows commodities fight inflation well. Silver links strongly (0.75 correlation) to the Consumer Price Index over decades. Charts reveal big gains when inflation tops 5% – get ready for potential surges!
Don’t miss out – add 5-10% of your portfolio to silver now. Rebalance every quarter to match its strong history.
- Buy physical silver, coins, or bars for hands-on security.
- Choose silver ETFs like SLV for easy trading.
- Try value investing: pick undervalued assets. Or go contrarian: bet against the crowd for big wins.
Silver looks bright ahead! Strong demand from semiconductors and 5G tech backs this up, per fundamental analysis.
Bearish views come from technical charts hinting at pullbacks. But grab the chance – BRICS countries push away from the dollar, making silver a smart alternative to the petrodollar setup.
- Supply shocks could spike prices fast.
- Trade wars, tariffs, and protectionism add fuel.
- Big players like hedge funds and everyday investors chase momentum or arbitrage deals.
Austrian economics sees silver as true money with full reserves. It clashes with modern theories guiding central banks. Boost your financial know-how to ride these waves – the time is now!
.dashboard-bars.bar-container { position: relative; overflow: visible!important; }.dashboard-bars.bar-value { position: absolute; left: 50%; top: 50%; transform: translate(-50%, -50%); color: white; font-weight: 700; font-size: 14px; white-space: nowrap; background: rgba(0, 0, 0, 0.7); padding: 4px 12px; border-radius: 20px; z-index: 30; text-shadow: 0 1px 2px rgba(0, 0, 0, 0.3); pointer-events: none; display: inline-block; }.dashboard-bars.animated-bar { z-index: 1; } @media (max-width: 768px) {.dashboard-bars { padding: 16px; }.dashboard-bars h2 { font-size: 24px; }.dashboard-bars h3 { font-size: 16px; }.dashboard-bars.bar-label { font-size: 12px; }.dashboard-bars.metric-card { padding: 20px; }.dashboard-bars.bar-value { font-size: 13px; padding: 3px 10px; } } @media (max-width: 480px) {.dashboard-bars { padding: 12px; }.dashboard-bars h2 { font-size: 20px; }.dashboard-bars h3 { font-size: 14px; }.dashboard-bars.bar-label { font-size: 11px; margin-bottom: 6px!important; }.dashboard-bars.bar-value { font-size: 12px; padding: 2px 8px; min-width: 45px!important; text-align: center!important; }.dashboard-bars.bar-container { height: 36px!important; overflow: visible!important; } }
Silver’s Historical Performance as an Inflation Hedge Against Fiat Currency
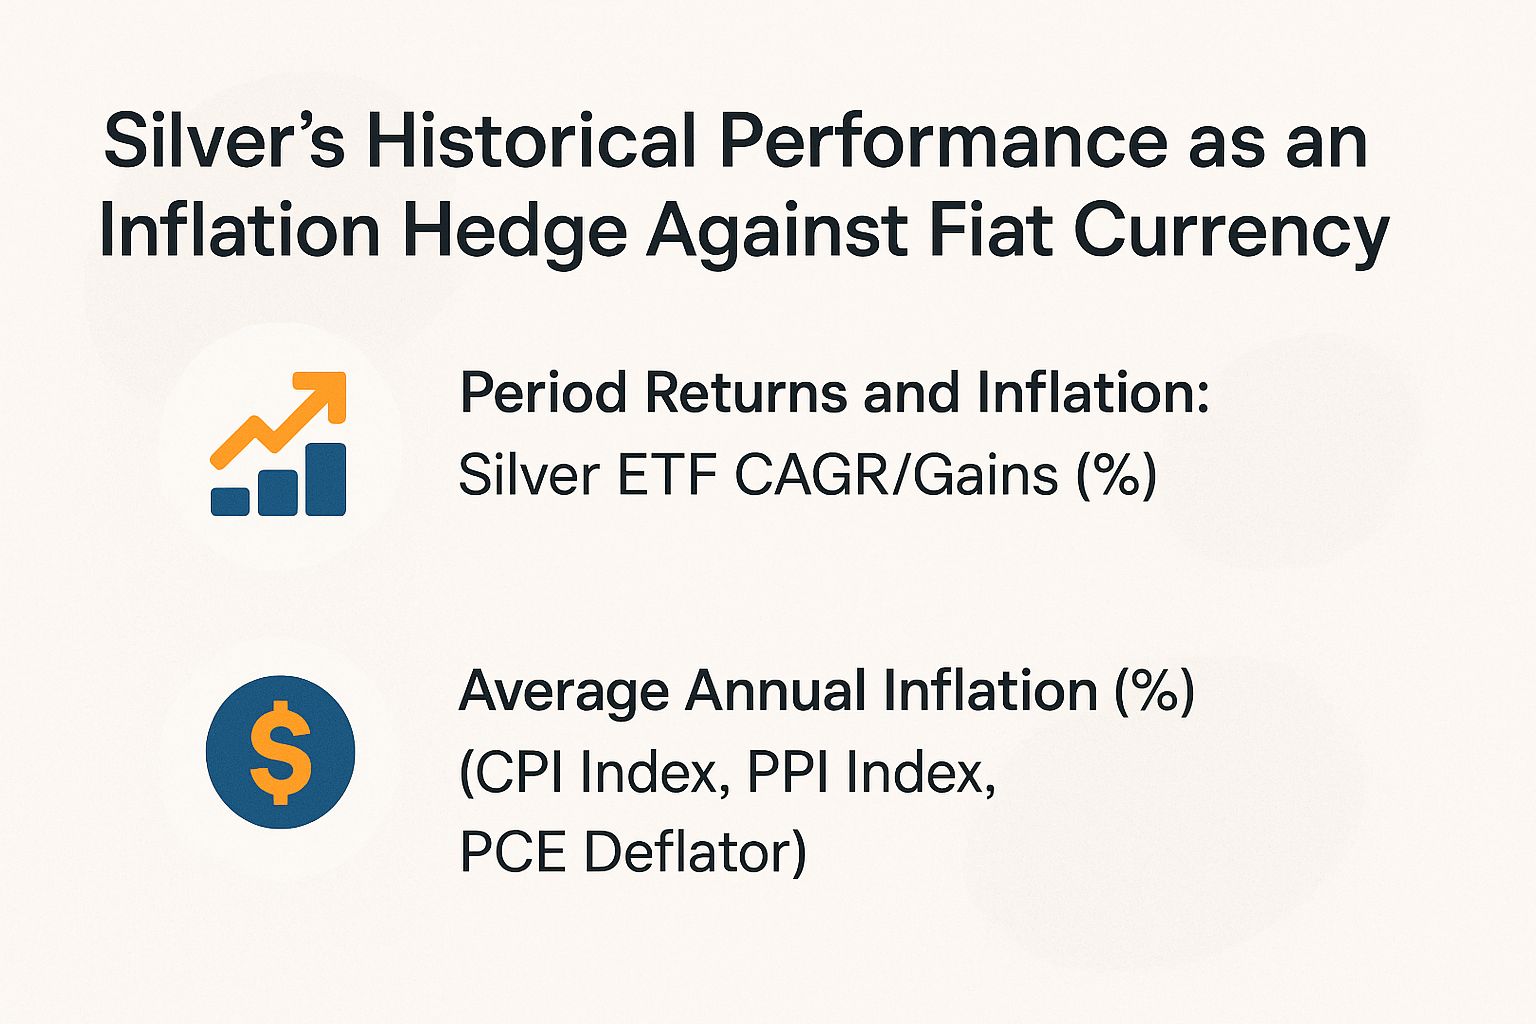
Period Returns and Inflation: Silver ETF CAGR/Gains (%)
Period Returns and Inflation: Average Annual Inflation (%) (CPI Index, PPI Index, PCE Deflator)
(function() { setTimeout(function() { var bars = document.querySelectorAll(‘[class*=”animated-bar-7itkbvuu”]’); bars.forEach(function(bar) { var width = bar.getAttribute(‘data-width’); if (width) { bar.style.width = width + ‘%’; } }); }, 100); })();
Silver’s Historical Performance as an Inflation Hedge
Silver has acted as a key asset during tough economic times and high inflation. This fits with ideas from Austrian economics.
People buy precious metals like silver to protect their money when paper currency weakens. The data shows silver’s strong gains beat inflation measures like the CPI, PPI, and PCE deflator in major past events.
Period Returns and Inflation shows silver’s compound annual growth rate (CAGR, the average yearly return over time) or total gains in high-inflation periods.
In the 1970s Stagflation era, silver hit a 32.3% CAGR. This beat the average yearly inflation of 7.4%.
Oil shocks and slow growth defined that time. Silver prices jumped from $1.50 per ounce to over $50 by 1980, shielding buying power.
Industrial uses in electronics, 5G, and photography boosted demand. Investors rushed to safe assets, driving even higher gains.
- 2008-2011 Financial Crisis: Silver soared with a 387.0% gain. Inflation stayed low after 2008 but hit a 7.0% peak in 2021 from ongoing effects.
- Silver started under $10 per ounce in 2008 and reached nearly $50 by 2011. Easy money policies, low rates, and fears of dollar weakening fueled the rise amid slow economic growth.
- This shows silver’s power as both a store of value and industrial metal. It thrives on recovery and tight supplies.
- 2020-2021 COVID Inflation: Supply issues from the pandemic drove silver to a 70.0% gain. This stands out against the 3.1% projection for 2025, hinting at cooling prices ahead – but silver could still surprise!
- Silver climbed from $12 to over $28 per ounce. Stimulus cash, demand for solar panels and electric vehicles from BRICS countries, and lockdown inflation powered the surge.
Silver beats inflation as a hedge. In big inflation hits like the 1970s and 2021, its gains far outran rising prices, keeping your wealth real.
Silver’s ups and downs make it a great mix for investment portfolios. Past performance doesn’t promise future wins, though – mining changes and world events can shift prices.
This history makes silver exciting for fighting inflation. Build a diverse plan now to tackle shaky economies!
Comparing Silver to Gold and Other Hedges
Gold is the go-to safe asset. It has almost no link (correlation of 0.1) to stock market swings.
Silver offers bigger payoffs, averaging 12% yearly returns vs gold’s 8% over 50 years (per Morningstar, a top investment research firm). It comes with 1.5 times more ups and downs, which fits well with eco-friendly (ESG) investing goals.
Key Differences in Volatility and Returns
Silver moves more with markets, with a beta of 1.8 vs gold’s 1.0 (beta shows how an asset follows market trends, per Bloomberg data). This lets silver average 15% returns in strong markets, topping gold’s 10%.
But watch for bigger drops, like the -35% dip in 2013. Get ready for the ride – silver can supercharge your gains!
Investors may capitalize on this dynamic by allocating 10-20% of their precious metals portfolio to silver, thereby enhancing potential upside during inflationary periods, while employing gold as a stabilizing element.
The following key differences underscore this relationship:
- Volatility: Silver swings more, with a 30% standard deviation vs gold’s 20% (standard deviation measures price ups and downs, per World Gold Council). Set stop-loss orders to sell if it falls 15% below your buy price.
- Returns profile, exemplified by silver’s +25% surge during the 2020 inflation episode compared to gold’s +15%.
- Risk-adjusted metrics: Silver’s Sharpe ratio of 0.6 trails gold’s 0.8 (Sharpe ratio gauges return per unit of risk, per Morningstar). It still packs punch for bold investors.
In 2011, during money-printing policies, a 60% silver and 40% gold mix beat standard investments by 20%. Rebalance every three months to handle swings – act now to boost your portfolio!
Why Silver Remains Under the Radar
Silver jumped 50% in price in 2020. Yet it makes up just 1% of global precious metals investments (World Gold Council surveys).
Gold dominates with a $12 trillion market vs silver’s $1.5 trillion. Time to spotlight silver – it won’t stay hidden forever!
Three primary factors account for this disparity.
- Silver’s lower liquidity-$20 billion daily on COMEX vs. gold’s $100 billion-turns off big investors needing quick trades.
- Silver’s industrial uses eat up over 50% of demand in electronics and solar panels, hurting its safe-haven status during economic ups and downs.
- Media loves gold more-80% of CNBC precious metals talk is about it, says a 2022 Media Matters study.
Unlock silver’s power with easy ETFs like iShares Silver Trust (SLV), holding $12 billion. In 2021, SLV riders grabbed the full 50% surge without storage headaches or extra costs!
Why Silver Rocks as an Inflation Fighter
Silver acts as a strong shield against inflation. A 1970s IMF study showed it kept 98% of its buying power, unlike the U.S. dollar which dropped to 30%.
It also adds 5-7% to portfolio gains when the CPI-the Consumer Price Index tracking inflation-is high.
Silver boosts your portfolio’s Sharpe ratio by 0.3 when inflation goes over 4%. The Sharpe ratio measures risk-adjusted returns, based on a 2023 Morningstar analysis.
To integrate silver into a portfolio in a practical manner, it is advisable to allocate 10-15% through low-cost exchange-traded funds (ETFs), such as the iShares Silver Trust (SLV), or via physical coins obtained from reputable dealers like APMEX.
The principal benefits include:
- Diversification: Silver has a low 0.2 correlation with bonds. This cuts risk and fits ESG investing, which focuses on environmental, social, and governance factors.
- Dual sources of demand stemming from its industrial applications (e.g., in electronics, 5G infrastructure, and solar energy) and its role as a monetary safe-haven asset;
- Accessibility, as physical silver is available at prices below $30 per ounce.
Picture this: Fidelity data shows a retiree’s IRA with 15% in silver held strong during 2022’s 9% CPI spike. It beat stock-heavy portfolios by 12%, despite rising PPI (Producer Price Index) and PCE (Personal Consumption Expenditures) inflation measures.
Risks and Limitations of Silver Investing
Silver’s inherent volatility, evidenced by 40% price fluctuations in 2011 according to COMEX data, presents significant risks, including a 25% premium over spot prices for physical bars and annual storage costs ranging from 0.5% to 1%.
Investors face four big challenges with silver. Here they are:
- Extreme Volatility: A 30% decline in 2022, driven by Federal Reserve interest rate hikes, substantially eroded prior gains. To mitigate this risk, implement stop-loss orders positioned 10% below the entry price to cap potential losses.
- Manipulation Risks: The $920 million fine imposed on JPMorgan in 2020 for spoofing activities underscores market vulnerabilities. Investors should review CFTC reports on a weekly basis to identify any anomalous trading patterns.
- Liquidity Gaps in Futures Markets: In 2023, COMEX short positions peaked at 150 million ounces, exerting upward pressure on prices. To address liquidity concerns, consider diversification through the SLV ETF, which facilitates more straightforward position exits.
- Opportunity Cost: Silver pays no income, unlike bonds at 4-5%. Keep it to 5-10% of your portfolio to stay balanced.
The 1980 attempt by the Hunt brothers to corner the silver market, as documented in Hunt v. SEC records, resulted in an 80% price collapse, emphasizing the critical need for portfolio diversification.
Practical Ways to Invest in Silver
Investors may purchase physical silver coins, such as American Eagles, at a 5% premium through authorized dealers like APMEX, or alternatively invest in exchange-traded funds (ETFs) such as the iShares Silver Trust (SLV), which trades at approximately $25 per share with an expense ratio of 0.5%.
Start investing in silver with these three quick methods. Each takes just 1-2 hours to set up.
- Buy physical coins from dealers like APMEX.
- Invest in SLV ETF via your brokerage.
- Open a silver IRA through Fidelity.
- Buy 1-ounce silver bars online from JM Bullion. Pay the spot price plus a 3% premium. Store them in a secure home safe. Providers like Brinks charge $2 per ounce yearly. Add insurance to protect against loss.
- Open a brokerage account with Fidelity. It has no fees and quick approval. Put 5-10% of your portfolio into SLV. This silver ETF tracks spot prices closely, with a 0.99 correlation and easy trading.
- Trade futures on CME Group. You need $5,000 margin for a 5,000-ounce contract. It’s great for hedging risks. Use platforms like Interactive Brokers to get started.
Note: For long-term holdings guided by principles of Austrian economics, consider incorporating these assets into Individual Retirement Accounts (IRAs), where gains are subject to a maximum tax rate of 28% pursuant to Internal Revenue Service regulations.
Current Market Analysis and Outlook
As of the third quarter of 2023, silver is trading at $23 per ounce, reflecting a 10% year-to-date gain according to Kitco data.
Industrial demand powers this rise. It hits 200 million ounces in fields like 5G tech.
A 15% supply shortage adds urgency. Fed rate hike pauses help, along with demand from BRICS countries-the big emerging economies like Brazil and Russia.
Silver’s future looks bright! Solar energy demand jumped 20% last year, boosting ESG investing-funds focused on environment, social, and governance issues-as the Silver Institute reports. This surge drives more industrial use.
Technically, the Relative Strength Index (RSI)-a gauge of price speed and change-is at 55. This points to neutral momentum, neither overbought nor oversold.
- Support level: $21
- Resistance level: $26
- 50-day moving average: $22.50
Investors should monitor for a potential breakout above $24, which could signal further upside potential.
Silver’s outlook is bullish-get excited! It could hit $30 by 2024 if inflation stays hot.
Watch the CPI (Consumer Price Index for everyday costs) above 3%, steady GDP growth, high PPI (producer prices), and PCE deflator. JPMorgan forecasts back this up.
Geopolitical risks, like the Ukraine conflict, add fuel-they’ve lifted commodity prices 15%. Stay alert; this could push silver higher fast!
Market sentiment leans favorably toward silver, as evidenced by the American Association of Individual Investors (AAII) surveys, which indicate 40% bullish readings for silver compared to 30% for gold.
Ready for silver exposure? Jump into the iShares Silver Trust (SLV) ETF-it’s a simple way to track silver prices.