
Understanding How to Profit from Gold Price Spikes
Gold prices often surge during bull markets, driven by inflation fears or geopolitical tensions. Savvy investors grab this chance to build wealth and protect against economic ups and downs.
Gold acts as a reliable hedge against inflation and a safe haven in volatile times. Navigate these spikes smartly to score big profits with the right strategies.
This guide breaks down what causes gold price rallies, like economic shifts and global events. Get ready to explore ways to cash in.
- Buy and sell physical gold, bars, or coins.
- Trade gold ETFs, futures, or options.
- Invest in gold mining stocks, from juniors to seniors, plus streaming and royalty companies.
- Manage risks with timing, diversification, and smart exits, using gold IRAs or brokerage accounts.
Understanding Gold Price Spikes
Back in 2011, gold jumped 28% amid the U.S. debt crisis and stock crash. Prices soared from $1,200 to $1,900 per ounce, showing how economic shocks boost gold values.
Economic Triggers
Gold shines as an inflation hedge. For example, when U.S. inflation hit 9.1% in June 2022 (measured by the Consumer Price Index, or CPI, which tracks price changes), gold prices rose 10% in a month.
- Lower interest rates: During the 2008 crisis, Fed cuts pushed gold from $700 to $1,900 per ounce.
- Weak U.S. dollar: When the Dollar Index (DXY, a measure of dollar strength) drops below 90, gold often surges 15%.
- Central bank buys: Russia added over 1,000 tons in 2022, spiking demand.
In 2020, the pandemic sparked a recession and uncertainty. Gold prices climbed 25%, proving its power among precious metals like silver and platinum.
Track gold using tools like TradingView for charts or Bloomberg for alerts. Set notifications for CPI releases and DXY changes to make smart decisions based on your goals and risk level.
- Watch moving averages, support, and resistance levels.
- Monitor volume and news events.
Advanced traders, get excited-leverage and margin can boost your gold returns! But watch out for high volatility; use options to hedge against price drops. Futures markets show contango (future prices higher than spot) or backwardation (the opposite), impacting trades.
Gold demand comes from jewelry, industry, ETFs, and central banks. Supply issues like mining disruptions add to price spikes.
- Speculate during market gaps for quick wins.
- For physical gold, factor in storage costs, taxes, and easy selling.
- Try alternatives like sovereign bonds, certificates, or numismatic coins.
- Invest via GLD ETF or mining stocks for dividends and growth potential.
Gold moves opposite to stocks, offering great diversification in crashes or recessions. Use strategies like dollar-cost averaging, stop-loss orders, and profit-taking to protect and grow your wealth.
Central Bank Role
Central banks boost gold by adding to reserves. Expect more buying to hedge global risks-act now to join the trend!
Central Bank Gold Holdings Expectations, Gold Reserves, and Reserve Allocations
/* Main bar styles */ #v4629sbe.bar-container { position: relative; overflow: visible; } #v4629sbe.bar-value { position: absolute!important; left: 50%!important; top: 50%!important; transform: translate(-50%, -50%)!important; color: white!important; font-weight: 700!important; font-size: 14px!important; white-space: nowrap!important; background: rgba(0, 0, 0, 0.7)!important; padding: 4px 12px!important; border-radius: 20px!important; z-index: 30!important; text-shadow: 0 1px 2px rgba(0, 0, 0, 0.3)!important; pointer-events: none!important; display: inline-block!important; } #v4629sbe.animated-bar { z-index: 1!important; } /* Tablet and smaller */ @media (max-width: 768px) { #v4629sbe { padding: 16px!important; } #v4629sbe h2 { font-size: 24px!important; } #v4629sbe h3 { font-size: 16px!important; } #v4629sbe.bar-label { font-size: 12px!important; } #v4629sbe.metric-card { padding: 20px!important; } #v4629sbe.bar-value { font-size: 13px!important; padding: 3px 10px!important; } } /* Mobile */ @media (max-width: 480px) { #v4629sbe { padding: 12px!important; } #v4629sbe h2 { font-size: 20px!important; } #v4629sbe h3 { font-size: 14px!important; } #v4629sbe.bar-label { font-size: 11px!important; margin-bottom: 6px!important; } #v4629sbe.bar-value { font-size: 12px!important; padding: 2px 8px!important; min-width: 45px!important; text-align: center!important; } #v4629sbe.bar-container { height: 36px!important; } }
Central Bank Gold Holdings: Expectations, Reserve Allocations, and Exciting Gold ETF Trends
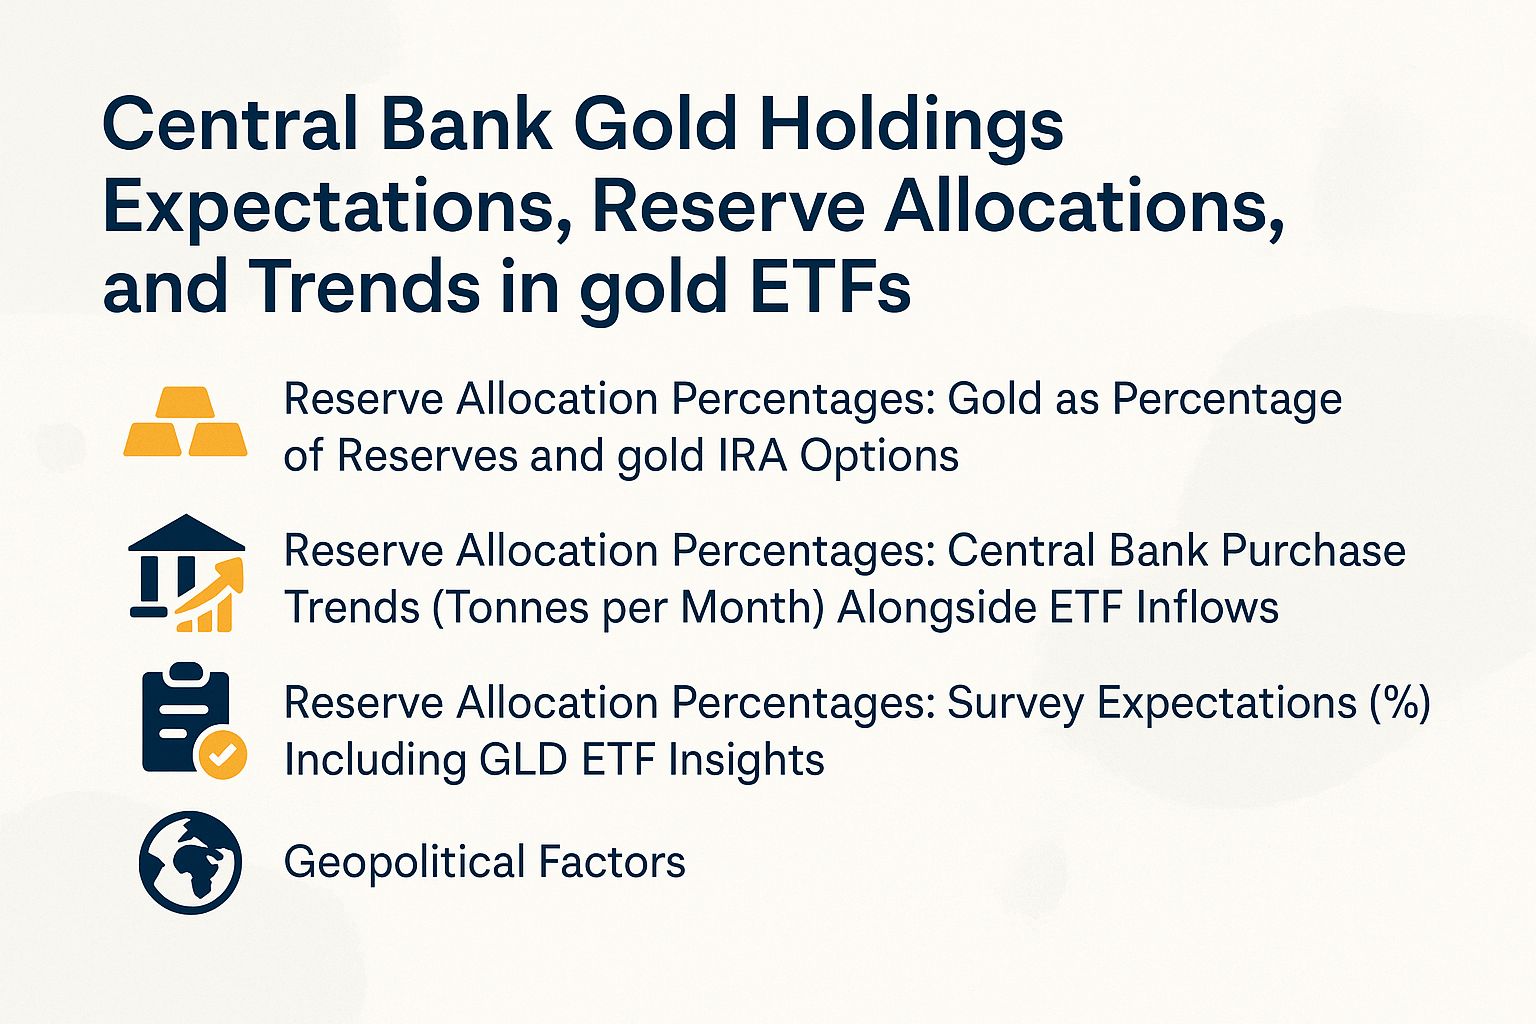
Gold’s Share in Reserves for Top Economies and Gold IRA Choices
Gold remains a key safe-haven asset. Check these stats to see why banks are stocking up now!
- US, Germany, France, Italy: 70.0%
- China: 10.0%
Central Banks Buying Gold: Actual vs. Forecast Trends in Tonnes per Month with ETF Flows
Gold remains a key safe-haven asset. Check these stats to see why banks are stocking up now!
- Forecast: 80.0 tonnes per month
- Actual 2024 Average: 64.0 tonnes per month
Central Bank Survey: Expectations for Global Gold Increases and GLD ETF Details
Gold remains a key safe-haven asset. Check these stats to see why banks are stocking up now!
- Expect Global Increase: 95.0%
- Plan Own Increase: 43.0%
(function() { setTimeout(function() { var bars = document.querySelectorAll(‘[class*=”animated-bar-v4629sbe”]’); bars.forEach(function(bar) { var width = bar.getAttribute(‘data-width’); if (width) { bar.style.width = width + ‘%’; } }); }, 100); })();
The Central Bank Gold Holdings Expectations and Reserve Allocations data shows gold’s lasting role as a safe-haven asset in global finance. It shines during economic uncertainties, inflation, and geopolitical tensions.
Central banks around the world see gold as a way to diversify. This helps reduce risks from fiat currencies-government-issued money like the dollar-and shaky markets.
Reserve Allocation Percentages show big differences in strategies.
China holds just 10.0% of reserves in gold. This conservative choice focuses on fast growth and other assets like U.S. Treasuries.
A low share limits gold’s upsides but gives room for other investments.
Western powerhouses like the US, Germany, France, and Italy keep 70.0% of reserves in gold.
History drives this, from post-World War II buys. It protects against dollar risks and value drops.
These choices show key differences: Western focus on steady ground, emerging markets on quick moves.
- Central Bank Purchase Trends: Banks bought an average of 64.0 tonnes per month in 2024. Big players like China’s People’s Bank and India’s Reserve Bank drive this demand to strengthen reserves.
- Forecast shows 80.0 tonnes per month soon. Higher interest rates and mining issues speed this up.
- Watch out: This rush might tighten gold supplies and push prices higher fast!
- Survey Expectations: A huge 95.0% of experts predict more global gold buys. Everyone agrees on its power in tough times. But just 43.0% will boost their own shares. Costs, rules, and hot options like crypto hold them back.
This data screams bullish for gold! Central banks keep demand roaring.
Shifts to metals like gold lock in its role as a steady shield-no yields, but total reliability.
It shapes investor vibes and global policies. Act now: Leaders need to mix this with smart portfolio plans to tackle coming storms.
Geopolitical Factors
- 2022 Russia-Ukraine war: Gold jumped 5% to $2,000/oz right away. It proved gold’s safe-haven power in crises.
- 1990 Gulf War: Prices shot up 20% from supply fears. Trading volumes on COMEX-a key gold exchange-rose 30% (COMEX data).
- 2018 U.S.-China trade fights with tariffs: Gold rose 15% (WTO reports). Investors hedged-protected-their bets.
- 2020 COVID-19 chaos: Gold gained $500/oz (World Bank data). Daily trades spiked 25%.
- 2019 Iran sanctions: Volatility jumped 10%.
- 1973 Yom Kippur War: Long-term 300% surge from oil shocks.
Stay ahead: Use Reuters API alerts to track news. API is a tool for real-time data feeds. This lets you make quick trades and spread out your investments smartly.
Direct Investment Strategies
Jump into gold with direct buys to ride price waves!
Options include physical gold, a gold IRA (tax-advantaged retirement account for gold), or ETFs-funds traded like stocks.
Physical gold gives real, touchable safety. ETFs bring easy buying and selling.
Check GLD ETF: It returned 25% in 2020’s gold boom. Don’t miss out!
Physical Gold Purchases
Buy physical gold bars from trusted spots like APMEX. Expect premiums starting at $50 above spot price-the current market rate-for true ownership and protection.
Example: Folks bought at $1,800/oz in 2021, sold at $2,000/oz later for big wins!
Get started with these steps. It takes 1-2 weeks, with 2-5% premiums.
- Research dealers and verify authenticity.
- Choose bar size and pay securely.
- Arrange storage or delivery.
- Track your investment.
- Select established dealers such as JM Bullion or Kitco; confirm their LBMA accreditation through their official websites to verify authenticity.
- Opt for highly liquid formats, such as 1-ounce American Eagle coins, to enhance resale efficiency.
- Authenticate the items by inspecting hallmarks and employing applications like Bullion Test for XRF analysis.
- Secure storage arrangements, either in a personal safe or via professional custodians such as Brinks, at an annual cost of approximately $100.
- Facilitate sales through platforms like eBay or local dealers, targeting bid-ask spreads of less than 2%.
It is essential to circumvent prevalent errors, including counterfeiting; Federal Bureau of Investigation reports indicate that annual losses from counterfeit gold exceed $100 million. In terms of return on investment, a 10-ounce purchase in 2022 generated 15% gains amid market volatility, according to data from Kitco.
Gold ETFs and Funds
The SPDR Gold Shares (GLD) Exchange-Traded Fund (ETF), managing approximately $60 billion in assets under management (AUM) bolstered by strong ETF inflows, seeks to track the spot price of gold, net of a 0.40% expense ratio. It has historically delivered returns of around 20% during years of significant gold price appreciation, such as 2019, when gold prices rose from $1,300 to $1,500 per ounce.
| ETF Name | Expense Ratio | AUM | Key Features | Best For | Pros/Cons |
|---|---|---|---|---|---|
| GLD | 0.40% | $60B | Physically backed gold | Long-term holders | Pros: High liquidity; Cons: No physical delivery |
| IAU | 0.25% | $30B | Low-cost shares | Cost-conscious investors | Pros: Cheaper fees; Cons: Less trading volume |
| SGOL | 0.17% | $3B | Allocated storage | Europeans | Pros: Tax advantages; Cons: Smaller size |
| PHYS | 0.39% | $5B | Redeemable for metal | Hedgers | Pros: Physical redemption; Cons: Higher minimums |
| DGLD | 1.35% | $10M | 3x leveraged inverse | Short-term speculators | Pros: Amplifies bearish bets; Cons: High risk/decay |
| UGL | 0.95% | $300M | 2x leveraged gold | Bullish traders | Pros: Magnifies gains; Cons: Increased volatility |
For novice investors, the GLD ETF is particularly suitable for active traders, given its substantial daily trading volume exceeding 1 million shares, which facilitates seamless entry and exit. The iShares Gold Trust (IAU) provides a more cost-effective alternative with its lower expense ratio, potentially yielding annual savings of approximately $150 on a $50,000 investment.
Investors may establish positions through platforms such as Fidelity, which offers commission-free trading. Fundamental concepts can be mastered in about one hour utilizing the educational resources available on ETF.com.
Trading Opportunities

Engaging in gold futures trading on the COMEX exchange offers investors the ability to place leveraged positions on anticipated price surges. Contracts such as GCZ23 facilitate 100-ounce positions with margins of $5 per point, enabling potential profits of $10,000 on a $100 price movement, as exemplified by the 8% rally observed in March 2022.
Gold Futures Contracts
Gold futures traded on the CME Group’s COMEX division, exemplified by the December 2023 contract priced at $1,950 per ounce, provide 100:1 leverage. This enables traders to manage positions valued at $195,000 with a margin requirement of just $5,000, as demonstrated during the 2020 market spike, which yielded returns of 30%.
To commence trading these contracts, adhere to the following procedures:
- Establish a brokerage account with a reputable firm such as Interactive Brokers or TD Ameritrade, both of which impose zero commissions.
- Deposit funds into a margin account, with a minimum of $5,000 required for micro contracts (MGC, equivalent to 10 ounces) or $20,000 for standard contracts (GC, equivalent to 100 ounces).
- Access the trading platform and select the desired contract, such as the December 2023 expiration or a comparable instrument.
- Execute the order while incorporating a stop-loss mechanism to limit risk to 2% (for instance, $100 on a $5,000 margin).
- Manage positions by rolling them over on a monthly basis or closing them prior to expiration to circumvent physical delivery obligations.
The account setup process typically requires approximately one day, while individual trades may be executed within 30 minutes.
Watch out for excessive leverage-it’s a big trap. This means using borrowed money to amp up your trades, and CFTC data shows it causes 70% of retail trader losses.
Picture this: A long position in the April 2022 MGC contract scored $8,000 profit from just a 10% price jump. Jump in now and chase similar gains!
Transaction costs average $1.50 per contract, with no restrictions on daily trading volume but a position limit of 10,000 contracts.
Options Trading
Call options on gold ETFs like the GLD ETF can deliver big wins. Take the $180 strike expiring in June 2023-it cost just $2 premium.
Gold prices surged to $2,000, turning that into an $8 profit per contract. That’s a thrilling 300% return, with your loss capped at the premium.
Options keep your risk low compared to futures. Check this quick side-by-side comparison:
| Aspect | Futures | Options |
|---|---|---|
| Risk | Unlimited | Limited to premium |
| Margin/Cost | $5K margin | $100-500 premium |
| Suitability | Directional bets | Volatility plays |
Three principal gold options strategies are outlined below:
- Covered calls on physical gold: Sell a $1,900 strike for a $50 premium (yielding 5-10%); medium difficulty, executable via Thinkorswim; suitable for stable markets, though it limits upside potential.
- Straddles for expected price spikes: Buy a call and put at $1,950. This won big in the 2022 Ukraine crisis (CBOE example: $20 premium each) and 200% in the 2020 pandemic.
- Time decay is a risk though. It can eat up to 50% of the value each week.
- Protective puts as hedges: Typically costing 1-2% of the portfolio; medium setup complexity; these protect against declines, as seen in the 2020 market crash, but are subject to similar time decay risks.
Gold options get exciting during big events. CBOE data shows average volatility hits 15% then-perfect for smart plays!
Indirect Profit Methods
Mining stocks like Newmont Corporation (NEM) can supercharge your returns. In 2019, NEM jumped 40% as gold surged, giving you 2-3 times the leverage of gold itself.
Operational leverage boosts profits from efficient mining. Plus, skip the hassle of storing physical gold.
Mining Company Stocks
In 2020, Barrick Gold Corporation (NYSE: GOLD) achieved a 50% increase in its stock price, paralleling a 25% rise in gold prices. This performance was propelled by efficient mining operations in Nevada, delivering leveraged returns to investors alongside a 2.5% dividend yield.
| Company | Market Cap | Key Features | Best For | Pros/Cons | Dividend Yield |
|---|---|---|---|---|---|
| NEM | $50B | Large reserves, global ops | Long-term stability | Pros: Stability; Cons: High debt | 2.5% |
| GOLD | $30B | Low-cost producer | Growth investors | Pros: Africa ops; Cons: Geopolitical risk | 2.0% |
| AEM | $25B | Canadian focus, royalties | Income seekers | Pros: Royalties; Cons: Exploration costs | 1.8% |
| KGC | $10B | Mid-tier producer | Speculation | Pros: High leverage; Cons: Volatility | 0% |
| FNV | $20B | Royalty/streaming model | Low-risk exposure | Pros: No ops costs; Cons: Dependent on partners | 4.0% |
| WPM | $18B | Precious metals streaming | Diversified income | Pros: Stable cash flow; Cons: Contract risks | 3.5% |
For novice investors, Newmont Corporation (NYSE: NEM) is well-suited to conservative portfolios, demonstrating 10% lower volatility than Barrick Gold (NYSE: GOLD) and providing dependable long-term investment opportunities during market fluctuations. Barrick Gold’s 20% reduction in operational costs bolsters profit margins amid surges in gold prices, rendering it an optimal choice for growth-focused strategies.
Professionals recommend conducting fundamental analysis through Yahoo Finance.
Set up a StockCharts account within one week. Use it to monitor technical charts and learn momentum indicators.
Risk Management Essentials
Smart risk management protected investors in 2013. Limiting gold to just 10% of the portfolio, as Morningstar advises, reduced losses when prices fell 28%.
Boost your approach with these five key practices:
- Spread your money across stocks, bonds, and a bit of gold. Try a 60/40 split between stocks and bonds, plus 5% gold, like Ray Dalio’s All-Weather portfolio for steady gains.
- Utilize stop-loss orders configured 5-10% below entry prices on trading platforms such as E*TRADE, enabling automated restriction of potential downside risk.
- Employ hedging strategies through options, such as purchasing protective puts at an annual cost of 1-2%, to provide insurance against significant market declines.
- Watch market ups and downs using the VIX index (a gauge of investor fear) and its link to gold prices. CBOE data shows VIX over 30 often means it’s time to sell.
- Conduct quarterly portfolio rebalancing by divesting from overperforming assets and acquiring underperforming ones, a practice that Vanguard research demonstrates can enhance returns by 2-3%.
Picture this: A $100,000 portfolio with 10% in gold earned 15% in 2022. That’s 5% better than plain portfolios, says JPMorgan.
Timing and Exit Strategies
In 2022, traders utilized technical indicators and tracked ETF inflows, such as the 50-day moving average crossover, to enter the gold market at the $1,800 support level and exit at the $2,050 resistance level, achieving a 14% profit within three months.
To implement similar strategies, adhere to the following structured steps for gold trading.
- Do basic research: Track the Consumer Price Index (CPI, a key inflation measure) on the Federal Reserve’s FRED site. Buy when inflation jumps over 5% yearly, just like the 2022 boom.
- Add chart analysis: Buy when the Relative Strength Index (RSI, a momentum tool) drops below 30, showing the asset is undervalued. Use TradingView to spot Moving Average Convergence Divergence (MACD) signals for trend changes.
- Establish entry criteria: Enter trades upon breakouts above the 200-day moving average, which has demonstrated a 70% historical success rate according to Bloomberg data.
- Define exit strategies: Exit positions upon reaching a 20% gain or implement a 5% trailing stop-loss to mitigate potential losses.
- Perform post-trade evaluation: Maintain a detailed trading journal to record outcomes and refine approaches, accounting for seasonal factors such as increased demand in the fourth quarter.
Best part? This plan takes just one hour a week to check.
Avoid chasing market highs. Dalbar research shows 80% of everyday traders fall behind because of it.
Want real results? A well-timed $10,000 gold investment in 2020 netted $2,500 profit, based on Kitco charts.