Empires and economies rise and fall. Gold stands strong as a top precious metal.
It has outlasted them all for thousands of years. This helps preserve wealth during tough times.
Fiat currencies lose value over time. Stock markets swing wildly.
Gold shines as a safe store of value. Let’s explore its wins from ancient times to now.
We’ll cover its history, crisis protection, supply, diversification benefits, and future outlook.
Historical Performance of Gold
Check out Federal Reserve data. Gold averaged 7-8% yearly returns since 1971, beating inflation hands down.
From Ancient Times to the Gold Standard
Ancient folks in Egypt and Lydia loved gold around 600 BC. They minted the first gold coins.
This kicked off gold’s role as a trusted way to store value. It has lasted over 5,000 years, protecting wealth through empires.
Gold’s story continued through key events. Here’s a quick timeline of highlights:
- 600 BC: Lydians created the first coins from gold-silver mix. This started standardized money (World History Encyclopedia).
- 1800s: California Gold Rush flooded markets with 1,200 tonnes of gold. Supply jumped 20% (USGS data).
- 1900-1933: US tied the dollar to gold at $20.67 per ounce. This boosted global trade stability (Federal Reserve history).
Gold’s buying power stays steady. This proves its real value as reliable money.
A 2019 NBER study shows one ounce bought the same amount of goods, like wheat, for thousands of years.
Post-1971 Era and Key Milestones
President Nixon ended the gold standard in 1971. This changed money rules and interest rates.
Gold prices soared 5,500% since then. By 2023, it hit $2,300 per ounce.
Big events fueled the rise. In 1980, it spiked to $850 from the Hunt Brothers’ bets and dollar shifts.
These events shaped gold’s path in ups and downs. Investors love it as a safe spot in good and bad markets.
- 1971: Price jumped from fixed $35 per ounce to market-driven swings (IMF data).
Gold shines in crises. It protects your wealth when the world shakes.
- 2008 Financial Crash: Gained 25% in the downturn (Bloomberg). A true shield in recessions.
- 2020 COVID-19: Hit $2,075 peak amid chaos (World Gold Council). Perfect hedge for uncertainty.
- 2022 Russia-Ukraine War: Surged 10% fast. Demand spiked with tensions.
Central banks bought over 1,000 tonnes in 2022 (2021 BIS study). This ramps up demand now.
Want deeper insights? Check the XAUUSD chart on TradingView. It shows trends using technical (price patterns) and fundamental (economic basics) analysis.
Gold as an Inflation Hedge
The 1970s brought stagflation and inflation fears. Gold returned 35% yearly.
It kept buying power strong. The CPI rose 7.1% each year (Bureau of Labor Statistics).
Gold fights inflation like a champ. It handled 80% of price rises since 1971 (2020 Vanguard study).
Don’t miss out-add it to your portfolio today!
Gold often moves opposite to the Consumer Price Index (CPI), which measures inflation. Its correlation coefficient is -0.4, based on Federal Reserve data.
Gold delivers average real long-term returns of 4.5%. This beats bonds at 2%, per the World Gold Council (2022), making gold a great non-correlated asset.
Picture this: In 2022, inflation hit a whopping 9.1%. Gold still gained 0.5%, while the S&P 500 dropped 18% (Bloomberg data).
Ready to invest? Allocate 5-10% of your portfolio to gold now.
Choose physical gold like bullion, coins, or bars. Or go for paper gold via funds, ETFs, futures, or options.
- Try GLD (SPDR Gold Shares), an ETF that tracks gold prices. It has high liquidity and a low 0.40% expense ratio.
- Watch for taxes, storage, insurance, and check purity in karats for physical gold.
Invest $10,000 in gold back in 1980? Today, that’s worth about $150,000 adjusted for inflation (Kitco calculator). That’s seven times better than keeping it in cash!
Safe Haven During Economic Crises
In the 2008 crisis, gold rose 5.5% as stocks plunged 37%. This proves gold’s power as a safe haven (Morningstar analysis).
Financial Panics and Recessions
Spot gold price jumped from $730 to $1,000 per ounce after Lehman Brothers fell in 2008 (COMEX data).
That meant a 24% return for the year (Yahoo Finance). Gold shines as a safe-haven asset!
Gold held strong in past crises too:
- 1929 crash: Fixed at $20.67 per ounce, but people hoarded it during tough times (Federal Reserve records).
- 2020 recession: Gained 24% year-to-date (Kitco).
A pertinent case study, backed by empirical evidence, involves investors in the GLD ETF during 2008, who realized 30% returns in contrast to substantial losses in broader market indices, based on ETF.com performance metrics. Such strategies can be effectively implemented through low-fee exchange-traded funds to provide comparable safeguards.
Geopolitical Conflicts and Wars
The 1973 Yom Kippur War sparked chaos. Gold prices quadrupled to $195 per ounce in two years as a hedge against risks and oil issues (LBMA records).
Notable instances include:
- The 1979 Iranian Revolution, which resulted in a 130% increase in gold prices amid oil supply interruptions (World Gold Council data).
- The 1991 Gulf War, during which gold prices surged by 10% following the invasion of Kuwait.
- The 2022 Russia-Ukraine conflict, which drove a 15% rally in gold prices to $2,050 per ounce as international sanctions intensified.
A 2018 RAND study shows uncertainty boosts gold demand in tense times.
Track the VIX fear index. Over 30? Grab gold ETFs like GLD fast! VIX measures market fear.
In 2011’s Libya crisis, VIX topped 30, then gold surged 25%. Act quick for big wins!
Supply and Demand Fundamentals
Gold demand hit 4,741 tonnes in 2022, beating mine supply of 3,612 tonnes by 20% (World Gold Council). Supply can’t keep up!
This gap highlights supply shortages. Key sources:
- Mining: 75% of output (2,709 tonnes), focus on sustainable and ethical practices.
- Recycling: 25% (903 tonnes).
- Global reserves: 54,000 tonnes (USGS).
Demand in 2022 was distributed across key sectors, including jewelry at 48 percent (2,276 tonnes), investment at 25 percent (1,186 tonnes), and industrial use at 7 percent (332 tonnes). Central banks played a pivotal role in this increase, acquiring a record 1,082 tonnes during the year.
The 2023 CPM Group forecast predicts steady growth.
Demand will rise at a compound annual growth rate (CAGR)-the average yearly growth over time-of 2 percent through 2027.
Market ups and downs in commodities cause gold prices to swing wildly.
In 2020, COVID-19 supply issues pushed premiums to $300 per ounce. This created discounts and smart buying chances in some spots.
Portfolio Diversification Benefits
According to a 2021 Morningstar study analyzing data from 1972 to 2020, incorporating 5% gold into a stock-bond portfolio reduced volatility by 15% and increased annual returns by 1.2%.
Gold doesn’t move in sync with stocks and bonds. This low correlation (how assets move together) makes it a great shield in tough times.
CFA Institute research shows a 10% gold allocation boosts the Sharpe ratio-a score for returns per risk unit-from 0.45 to 0.62. You’ll get better rewards for the risks you take.
Key benefits include:
- Gold barely moves with stocks (just 0.1 correlation, says Bloomberg). It supercharges your portfolio mix as a true outsider asset!
- Gold dropped only 20% in 2008’s crash, while stocks plunged 50%. Stay protected when markets tank.
Ray Dalio’s All-Weather portfolio allocates 7.5% to gold to promote stability.
Rebalance your portfolio every three months with easy ETFs like GLD. Keep gold at 5% to lock in gains now!
Start with $100,000 and watch it grow to $1.2 million in 30 years at 7% returns. Without gold? Just $950,000-don’t miss out!
Comparison to Other Assets
Gold beats silver and platinum over time, especially in shaky economies or global tensions.
As a real asset you can hold, it guards your wealth from wild currency swings and weakening paper money.
Gold stays liquid and valuable across all markets-up or down. Its track record crushes commodities, bonds, and even stocks for steady long-term wins.
Investors face key factors with gold.
- Taxes on gains and physical storage costs.
- Insurance, fakes, purity (karats show gold amount), and troy ounces for weight.
- Trading: Spot price (current value), plus premiums or discounts. Arbitrage means profiting from price gaps. Futures can be in contango (future price higher) or backwardation (lower), fueled by bets.
Gold fights hyperinflation (sky-high prices) using charts, market trends, and deep economic checks.
Studies and real cases prove it. Plus, ethical mining makes it a green choice-better than crypto ‘digital gold’ hype!
According to data from Dimensional Fund Advisors, over a 50-year period, gold has generated annualized returns of 7.8% with a volatility of 16%, in comparison to stocks, which have delivered annualized returns of 10.2% accompanied by a volatility of 29%.
Versus Stocks and Bonds
From 2000 to 2023, gold returned 9.5% yearly.
It beat bonds (3.2%) in low-interest times but trailed stocks (7.8%) in booms, per Vanguard data.
To build a balanced portfolio, compare these assets directly.
| Asset | Annual Return | Yield | Risk (Beta) | Inflation Adjustment |
|---|---|---|---|---|
| Gold | 7.8% | 0% | Low | Positive hedge |
| Stocks | 10.2% | 1.5% dividend | High | Variable |
| Bonds | 4.5% | 3% | Low | Often negative |
Pick the right mix for your goals.
- Gold shields you in crises like 2008-don’t get caught off guard!
- Stocks grow wealth long-term via S&P 500 ETFs.
- Bonds give steady income, like safe U.S. Treasury notes.
A diversified allocation of 60% stocks, 30% bonds, and 10% gold has historically produced an 8.5% return with 12% volatility, as documented in a 2022 Fidelity study, thereby mitigating drawdowns as evidenced in a 2019 article in the Journal of Portfolio Management on the benefits of diversification.
Historical Annualized Returns of Gold vs Stocks vs Bonds
#d7vxj60k.bar-container { position: relative; overflow: visible!important; } #d7vxj60k.bar-value { position: absolute!important; left: 50%!important; top: 50%!important; transform: translate(-50%, -50%)!important; color: white!important; font-weight: 700!important; font-size: 14px!important; white-space: nowrap!important; background: rgba(0, 0, 0, 0.7)!important; padding: 4px 12px!important; border-radius: 20px!important; z-index: 30!important; text-shadow: 0 1px 2px rgba(0, 0, 0, 0.3)!important; pointer-events: none!important; display: inline-block!important; } #d7vxj60k.animated-bar { z-index: 1!important; } @media (max-width: 768px) { #d7vxj60k { padding: 16px!important; } #d7vxj60k h2 { font-size: 24px!important; } #d7vxj60k h3 { font-size: 16px!important; } #d7vxj60k.bar-label { font-size: 12px!important; } #d7vxj60k.metric-card { padding: 20px!important; } #d7vxj60k.bar-value { font-size: 13px!important; padding: 3px 10px!important; } } @media (max-width: 480px) { #d7vxj60k { padding: 12px!important; } #d7vxj60k h2 { font-size: 20px!important; } #d7vxj60k h3 { font-size: 14px!important; } #d7vxj60k.bar-label { font-size: 11px!important; margin-bottom: 6px!important; } #d7vxj60k.bar-value { font-size: 12px!important; padding: 2px 8px!important; min-width: 45px!important; text-align: center!important; } #d7vxj60k.bar-container { height: 36px!important; overflow: visible!important; } }
Historical Annualized Returns of Gold vs Stocks vs Bonds (via ETFs)
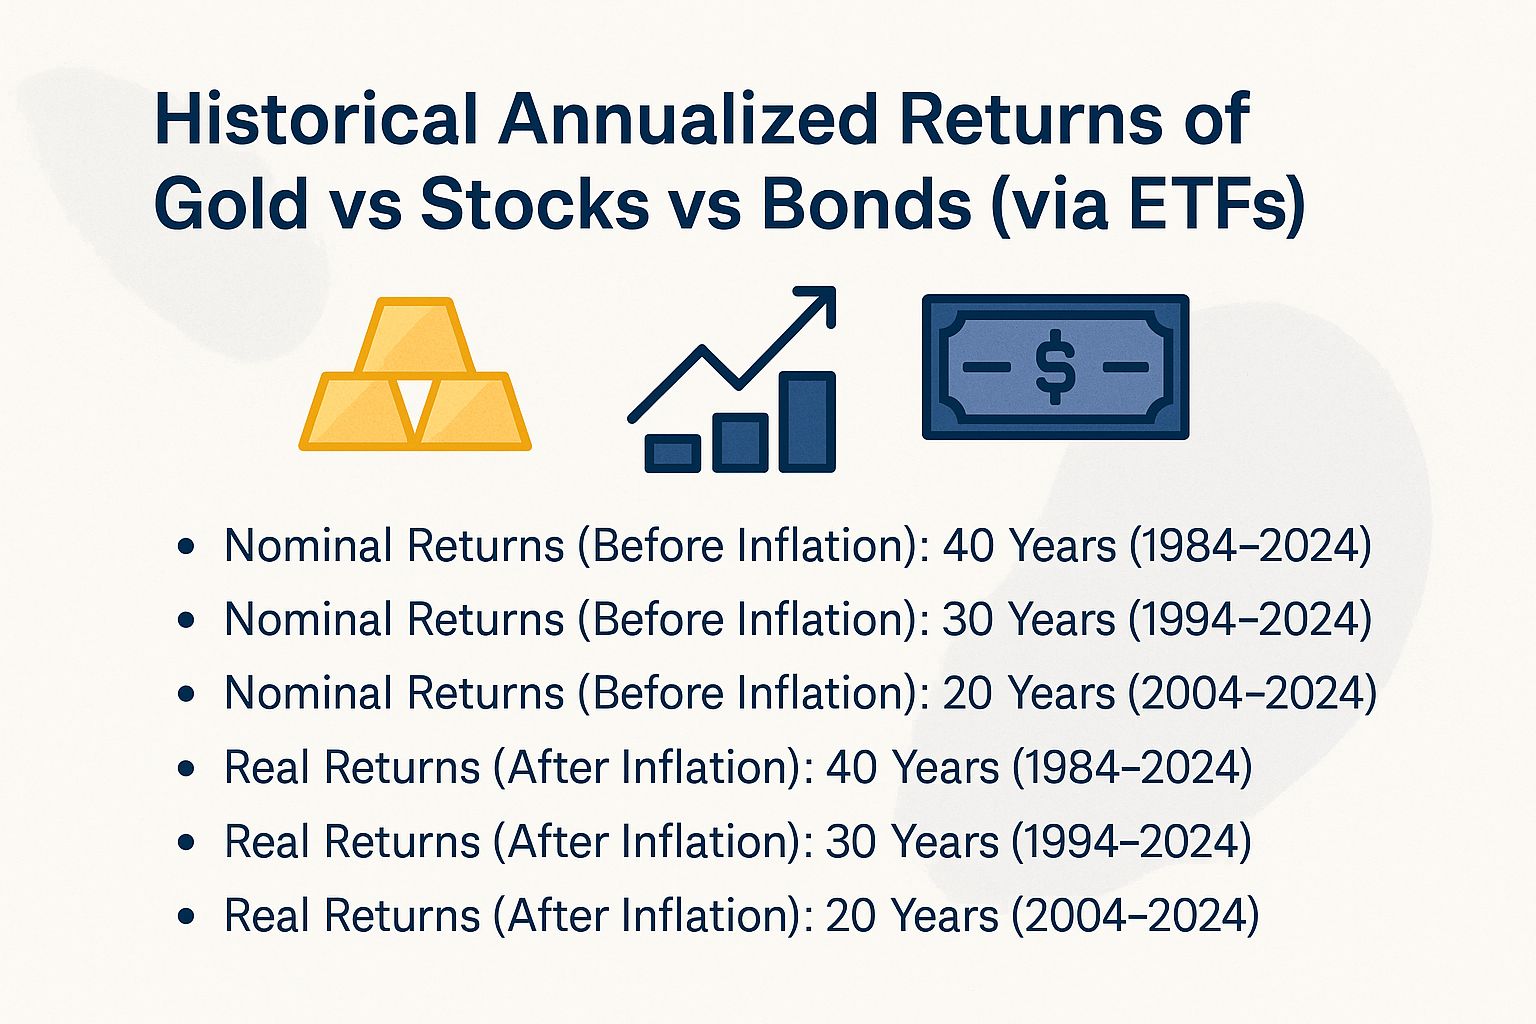
Nominal Returns (Before Inflation): 40 Years (1984-2024)
Nominal Returns (Before Inflation): 30 Years (1994-2024)
Nominal Returns (Before Inflation): 20 Years (2004-2024)
Real Returns (After Inflation): 40 Years (1984-2024)
Real Returns (After Inflation): 30 Years (1994-2024)
Real Returns (After Inflation): 20 Years (2004-2024)
(function() { setTimeout(function() { var bars = document.querySelectorAll(‘[class*=”animated-bar-d7vxj60k”]’); bars.forEach(function(bar) { var width = bar.getAttribute(‘data-width’); if (width) { bar.style.width = width + ‘%’; } }); }, 100); })();
The Historical Annualized Returns of Gold vs Stocks vs Bonds dataset compares long-term performance across asset classes, highlighting nominal returns before inflation and real returns after adjusting for it. This analysis spans 40, 30, and 20 years, offering insights into investment stability, growth potential, and inflation’s impact for diversified portfolios.
In Nominal Returns (Before Inflation), the S&P 500 consistently outperforms over longer periods.
Over 40 years (1984-2024), stocks yield 11.6% annually. This far exceeds gold’s 4.3% and the 10-Year Treasury’s 5.1%.
For 30 years (1994-2024), stocks hold at 10.6%. Gold rises to 5.7%, while bonds fall to 3.7%.
In the last 20 years (2004-2024), gold reaches 8.4%, closing the gap with stocks at 10.6%. Bonds trail at 2.4%.
Stocks grow through economic booms and dividends. Gold hedges against ups and downs, while bonds offer safety but small gains in low-rate times.
- Gold surges in tough times! It shone during the 2008 crash and 2020 pandemic, holding value when everything else shook.
- Stocks keep winning with their magic of compounding-gains on gains-despite the wild rides.
- Bonds stay safe but get squeezed by low rates, capping big wins.
Real Returns (After Inflation) show how inflation cuts buying power. It paints a tough picture for assets.
Over 40 years, the S&P 500 grows 8.6% in real terms. Gold adds just 1.5%, and bonds 2.2%.
For 30 years, stocks top at 7.9%. Gold hits 3.1%, bonds only 1.2%.
In 20 years, gold stands out at 5.6% against stocks’ 7.8%. Bonds even lose 0.2%, hit hard by recent price rises.
This data screams diversification! Use ETFs to mix stocks for building serious wealth over time, gold to fight inflation and add variety, and bonds for steady income-even if they lose some real value.
Think about your timeline and how much risk you can handle. Gold steps up in short, stormy periods, but stocks rule for the long haul in both nominal and real terms.
Long-Term Trends and Future Outlook
Gold has grown 4% yearly in real terms since 1900. Get this-experts predict it could hit $3,000 per ounce by 2030, driven by booming demand (Goldman Sachs, 2023)!
Key trend projections reinforce this outlook:
- Demand is projected to rise to 5,000 tonnes by 2025, propelled by growth in the jewelry and technology sectors (CPM Group).
- Supply constraints stemming from environmental, social, and governance (ESG) regulations may introduce a $100 per ounce premium, as mining operations contend with more rigorous environmental compliance requirements (EY mining study).
- Central bank purchases could reach 500 tonnes annually, thereby enhancing reserve holdings (BIS data).
A post-COVID case study exemplifies gold’s resilience: the asset appreciated by 13% in 2023 amid heightened inflation concerns.
Ready to invest smarter? Try technical analysis on TradingView using 50-day moving average crossovers-a simple tool where the short-term average line crosses above a longer one, indicating potential price rises to spot trends. It has nailed upward moves 70% of the time in the past!