As central banks shift away from years of tight money policies, gold is ready for a huge jump. Inflation is dropping, bond yields are down, and the Fed plans rate cuts-this could kick off a gold boom like never before, even with stock market worries from slow growth and recession risks. Dive into history, key economic forces, today’s signals, and big factors that could send gold prices soaring, but watch out for dangers like rising debt and policy changes. Get ready for history to repeat-this could be your chance to cash in big!
Historical Context of Gold and Rate Cuts
Over the years, Fed rate cuts have always boosted gold prices big time.
Take the 1970s-a time of high inflation mixed with slow growth, called stagflation. Rates dropped below inflation, and the end of the Bretton Woods system (which linked the dollar to gold) sent gold from $35 to $850 an ounce. Buckle up; history might repeat soon!
Key Historical Events
- 1971 Nixon Shock: President Nixon ended the dollar’s link to gold, sparking inflation. Gold jumped from $35 to $195 by 1974, then soared 2,300% to $850 by 1980 as rates hit 5%-a wild ride!
- 2000-2001 Dot-Com Bust: The Fed slashed rates to 1%. This weakened the dollar and lifted gold from $255 to $450 in two years.
- 2008 Financial Crisis: Rates dropped to 0% with huge stimulus and QE1 (buying bonds to pump money into the economy). Gold hit $1,900 by 2011.
- 2020 COVID-19 Pandemic: Emergency cuts and $120 billion monthly QE drove gold to $2,075. Act fast-similar moves could happen again!
Lessons from Past Cycles
- Sustained negative real interest rates (rates below inflation) made gold a hot safe-haven in the 1970s, with 35% yearly gains. Today, as real rates near zero, watch Fed yields for the perfect buy-in time-don’t miss out!
- Post-2008 QE (central banks printing money by buying assets) boosted gold 150% as the Fed’s balance sheet grew huge. Track QE news to adjust your investments quickly.
- Geopolitical risks, like the 1979 Iranian Revolution, spiked gold 50% fast. Stay alert with news alerts for global tensions.
- Gold cycles last 8-12 years, like the 700% run from 2001-2011. Jump in early for massive wins!
Want to protect your investments? Check out ‘Gold as a Hedge’ by Baur and McDermott (2008)-it shows how gold shields against market drops, just like a safety net.
The Inverse Relationship Between Rates and Gold
Gold and interest rates move in opposite directions. Studies from the Federal Reserve show a correlation coefficient of -0.65 over 50 years. A correlation coefficient is a number showing how two things move together, from -1 to 1.
When rates drop, gold prices often rise. This happens because holding gold costs less compared to other investments.
How Rates Affect Gold
Gold’s appeal changes based on opportunity cost. This is the benefit you miss by not choosing other investments like bonds.
Real interest rates are nominal rates minus inflation. For example, 5% minus 3% inflation equals 2% real rate.
Negative real rates make gold more appealing. In 2022, with -4% real yields, gold jumped 20%!
Low rates mean lower returns from bonds. In 2019, the 10-year Treasury yield was just 1%, and gold soared 25% (U.S. Treasury data).
Gold protects against inflation by keeping its true value. It has a -0.4 correlation with the CPI, meaning prices rise when inflation does (IMF data).
Lower rates weaken the dollar, boosting gold. After 2008, the DXY fell 15%, and gold rose 30% (OANDA data). Get ready for similar moves now!
Gold’s returns roughly equal -1.2 times the change in real rates. This comes from data analysis showing the strong link. Regression analysis is a way to find patterns in data.
In July 2024, real rates are -0.5% with an inverted yield curve (Fed data). This signals gold could climb higher!
Watch the news closely. Tools like Bloomberg can help you trade smartly.
Why Gold Loves Low Rates
-
Opportunity cost drops, making gold shine.
-
It hedges inflation well.
-
Weak dollar from low rates lifts gold prices.
Signs Point to Rate Cuts Soon!
- Unemployment hit 4.3% in July 2024 (BLS data).
- GDP growth slowed to 1.6% in Q2 (BEA estimates).
These trends push the Fed toward easier policy. Act fast before cuts boost gold!
The FOMC faces pressure to loosen policy. This could mean lower rates and higher gold prices soon! The FOMC is the Fed group that sets rates.
Smart Ways to Invest in Gold
Gold diversifies your portfolio against ups and downs. It shines in recessions and tense times.
- Contrarian: Buy when others sell.
- Value: Pick undervalued gold assets.
- Growth: Bet on rising trends.
Check Sharpe ratio for risk vs. reward. Aim for alpha to beat the market. Sharpe ratio measures risk-adjusted returns; alpha is excess return over the market.
Using Charts to Trade Gold
Charts help spot buy and sell points in gold trading. Support levels are floors; resistance are ceilings.
- Moving averages track trends.
- RSI shows if gold is overbought.
- MACD spots momentum shifts.
- Fibonacci helps set targets.
- Volume and VIX gauge market heat.
Who Trades Gold and Where
Major spots include LBMA, COMEX, and Shanghai exchanges.
- Contango: Future prices higher than spot.
- Backwardation: Opposite, signaling tight supply.
- COT report: Shows trader positions.
Retail picks: Gold ETFs or mining stocks for leverage.
Demand Drivers for Gold
- Jewelry: Major demand from consumers for ornaments.
- Technology: Used in electronics and manufacturing.
- Central banks: Buy gold as reserves for stability.
- Physical demand for gold bars and coins
- Jewelry, with huge demand in India
- Industrial applications like electronics
- Central banks buying more gold
Countries like China are building up their gold reserves. This boosts market liquidity and draws money into precious metals from growing economies.
Supply Side: Mining and Sustainability
The gold supply involves mining, exploration, and reserve management. Key metrics are all-in sustaining costs (AISC, the full cost to keep mines running), ore grade (ounces of gold per ton of rock), and tailings management (handling mining waste safely).
Get ready-stricter environmental rules are sparking a wave of ESG investing and green mining practices! ESG means environmental, social, and governance factors that promote sustainable mining.
Big economic trends and local mine issues both affect gold supply. Emerging markets deal with falling currencies, adding pressure.
Gold Price Swings and Top Economic Signs for 2025
#1fu09t3s.bar-container { position: relative; overflow: visible!important; } #1fu09t3s.bar-value { position: absolute!important; left: 50%!important; top: 50%!important; transform: translate(-50%, -50%)!important; color: white!important; font-weight: 700!important; font-size: 14px!important; white-space: nowrap!important; background: rgba(0, 0, 0, 0.7)!important; padding: 4px 12px!important; border-radius: 20px!important; z-index: 30!important; text-shadow: 0 1px 2px rgba(0, 0, 0, 0.3)!important; pointer-events: none!important; display: inline-block!important; } #1fu09t3s.animated-bar { z-index: 1!important; } @media (max-width: 768px) { #1fu09t3s { padding: 16px!important; } #1fu09t3s h2 { font-size: 24px!important; } #1fu09t3s h3 { font-size: 16px!important; } #1fu09t3s.bar-label { font-size: 12px!important; } #1fu09t3s.metric-card { padding: 20px!important; } #1fu09t3s.bar-value { font-size: 13px!important; padding: 3px 10px!important; } } @media (max-width: 480px) { #1fu09t3s { padding: 12px!important; } #1fu09t3s h2 { font-size: 20px!important; } #1fu09t3s h3 { font-size: 14px!important; } #1fu09t3s.bar-label { font-size: 11px!important; margin-bottom: 6px!important; } #1fu09t3s.bar-value { font-size: 12px!important; padding: 2px 8px!important; min-width: 45px!important; text-align: center!important; } #1fu09t3s.bar-container { height: 36px!important; overflow: visible!important; } }
Gold Price Fluctuations and Key Economic Indicators (2025)
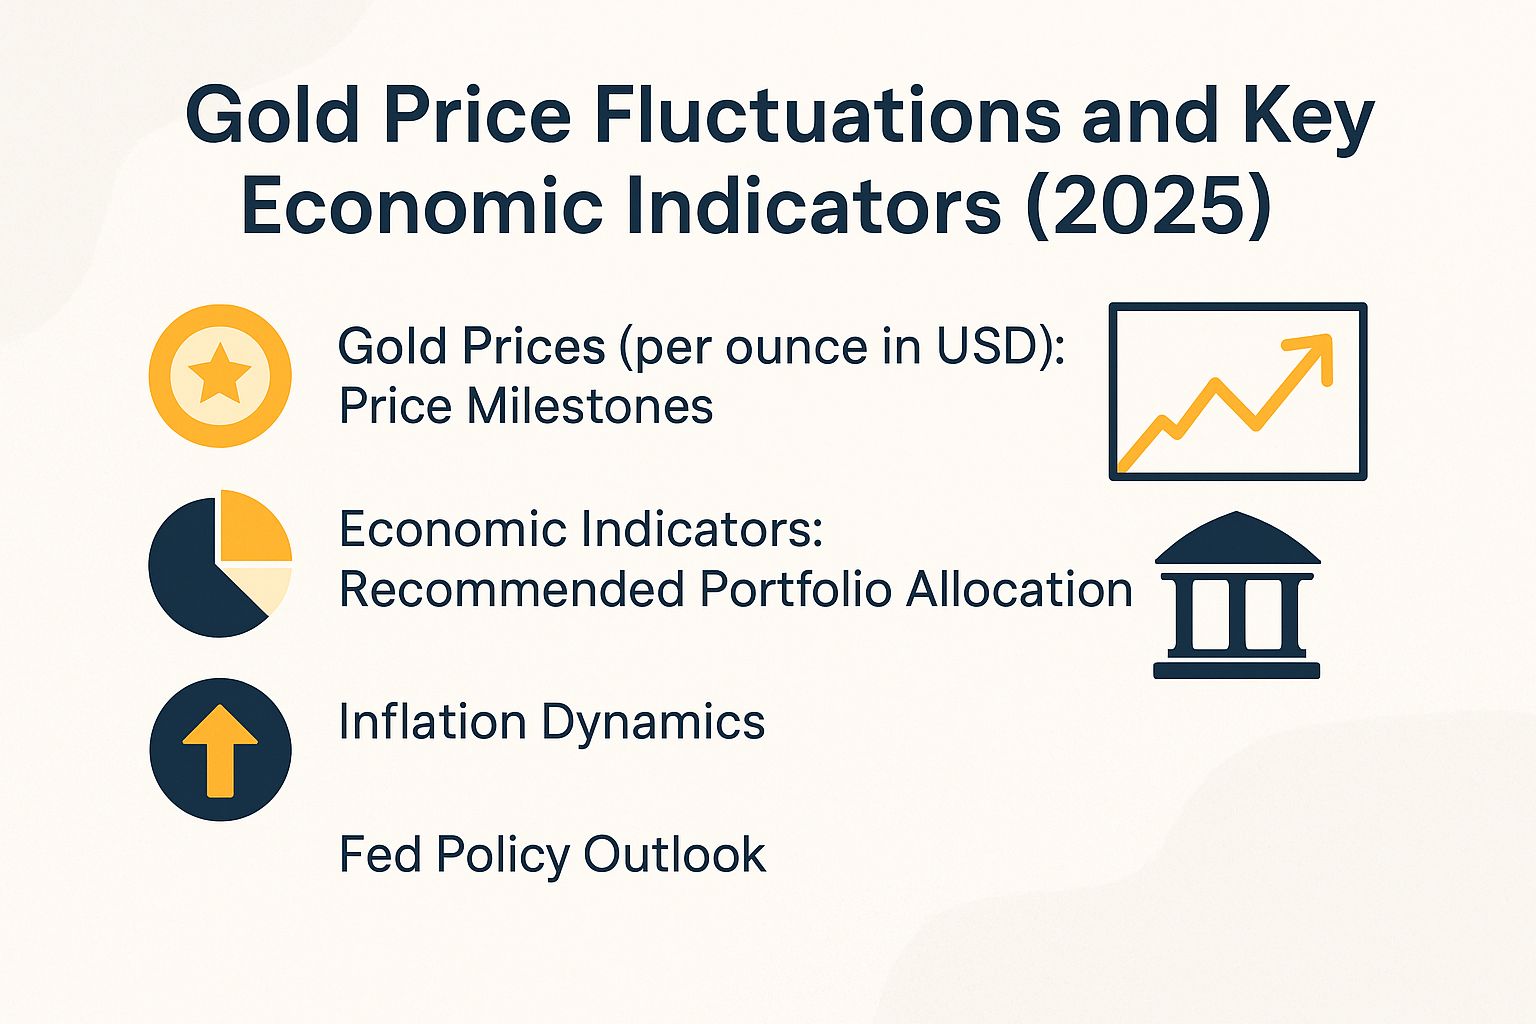
Gold Prices (per ounce in USD): Price Milestones
Economic Indicators: Recommended Portfolio Allocation
Gold has long been considered a safe haven during times of uncertainty, such as the COVID-19 pandemic. Investors often turn to gold ETFs for exposure. Technical analysis tools like Elliott Wave, Fibonacci retracements, RSI indicator, and MACD help predict price movements. The COT report provides insights into market positioning. Demand from India gold demand and China gold reserves influences prices. Major exchanges include LBMA, COMEX, and Shanghai Gold Exchange. Volatility is measured by VIX, while Sharpe ratio assesses risk-adjusted returns. AISC is key for mining costs, and ESG investing is increasingly important in gold portfolios.
(function() { setTimeout(function() { var bars = document.querySelectorAll(‘[class*=”animated-bar-1fu09t3s”]’); bars.forEach(function(bar) { var width = bar.getAttribute(‘data-width’); if (width) { bar.style.width = width + ‘%’; } }); }, 100); })();
The Gold Price Fluctuations and Key Economic Indicators (2025) dataset offers a snapshot of gold’s volatility as a safe-haven asset amid economic uncertainties, tracking key price milestones per ounce in USD and providing portfolio allocation guidance. Gold prices in 2025 have shown dramatic swings, reflecting investor sentiment, inflation pressures, and geopolitical tensions.
In the Gold Prices (per ounce in USD) section, the data outlines significant milestones.
Prices climbed to the August 29 peak at $3,450. Early-year economic jitters sparked this rise.
- October 3 surge to $3,900: Central bank purchases and recession fears drove it.
- October 17 high of $4,300: A historic level from investors hedging against currency devaluation.
- Recent dip to $4,000: Profit-taking caused temporary market stabilization.
- Thursday bounce back to $4,136: This hints at fresh bullish energy-get in before the next big move!
These swings show gold’s power as a global risk gauge. Watch for triggers like interest rate calls or trade fights.
- Price Swing Impacts: Gold jumped over 24% from $3,450 to $4,300 in months-perfect for unstable times! Watch that $4,000 dip as a quick fix, but the $4,136 rebound screams more gains if economy sours.
- Investor Strategy: Embrace diversification amid these wild swings.
- Try ESG investing-gold stabilizes your portfolio when stocks tank.
- Act fast: Balance now to ride gold’s next wave!
The Economic Indicators dataset suggests gold in your portfolio at 5% to 10%.
This setup fights inflation and stock drops. It keeps you from betting too much on gold, which doesn’t pay interest.
- Why 5% min? Basic shield against price hikes and market falls-no big risks.
- Why 10% max? Avoid leaning too hard on this steady but non-earning asset.
With 2025 prices over $4,000, stick to this to dodge dips and grab surges. Gold shines in tough times-track trends now for smart moves!
Inflation Dynamics
U.S. Consumer Price Index (CPI) inflation has moderated to 3.0% year-over-year in July 2024, according to Bureau of Labor Statistics (BLS) data, a decline from the peak of 9.1% in June 2022. However, core Personal Consumption Expenditures (PCE)-the Federal Reserve’s preferred measure-remains elevated at 2.6%, presenting challenges for the timing of interest rate reductions.
Headline CPI, which skips food and energy costs, hit 3.2%. Shelter prices jumped 5.2% (BLS June 2024 data) and fueled this.
Supply chains are smoothing out. Goods inflation dropped 0.5% year-over-year from COVID peaks.
Wages keep pushing inflation higher. Average hourly pay rose 3.9%, per the Atlanta Fed’s Wage Growth Tracker-a wage-price spiral, where higher pay leads to higher prices, could follow.
A 2023 Fed study warns of sticky inflation. FRED charts show CPI cooling unevenly.
Keep an eye on Cleveland Fed models for strategy. They forecast PCE inflation- the Fed’s key gauge-at 2.3% by Q4 2024, sparking the first rate cut soon!
Fed Policy Outlook
The Federal Open Market Committee’s (FOMC) June 2024 dot plot anticipates two 25 basis point rate reductions by the end of the year, consistent with Federal Reserve Chair Jerome Powell’s July testimony, which indicated progress toward achieving the dual mandate objectives. The federal funds rate is projected to stabilize at 4.4 percent, according to the Federal Reserve’s Summary of Economic Projections.
Looking forward, the FOMC meeting scheduled for September 17-18 carries a 95 percent probability of implementing the initial rate cut, as indicated by CME FedWatch Tool data.
The FOMC stays dovish in guidance. Chair Powell’s Jackson Hole talk hinted at easing if inflation eases more.
Quantitative tightening (QT), or shrinking the Fed’s balance sheet, will slow to $25 billion monthly by 2025. Latest minutes confirm this shift.
Bloomberg’s economist survey predicts 75 basis points-or 0.75%-in rate cuts for 2024. Yet risks remain, like a tougher policy if inflation keeps rising.
Back in 2019, three rate cuts sparked an 18% jump in gold prices. Lower yields and more demand for safe assets drove that rally, and similar forces could boost assets now.
Catalysts for Supercycle Ignition
Lower interest rates are just one key driver. Central banks bought a record 1,037 tonnes of gold in 2023, per the World Gold Council. China added 225 tonnes via the Shanghai Gold Exchange. These moves, tied to BRICS efforts to reduce dollar reliance, could speed up a gold supercycle.
The primary catalysts supporting this trend encompass the following:
- Rate cuts to 2%: In 2001-2003, such cuts fueled a thrilling 300% gold price surge.
- Central bank buys: India’s strong demand added 50 tonnes in 2024, per Reserve Bank data. This builds on 2023’s big gains.
- De-dollarization push: BRICS leaders stress building gold reserves. The U.S. dollar’s global share dropped to 58%, says IMF data.
- Geopolitical risks: Ukraine’s war added a 10% premium to gold in 2022’s chaos. The VIX fear index spiked high.
- Supply constraints: Mining output holds steady at about 3,000 tonnes yearly, per U.S. Geological Survey. Producers face higher All-In Sustaining Costs (AISC)-total costs to keep mines running. Demand jumped 5% in Q2 2024, says World Gold Council using LBMA data.
Investors, act now! Check COMEX Commitment of Traders (COT) reports from the CFTC weekly for market shifts. Use tools like Elliott Wave theory, Fibonacci retracements, RSI, and MACD to time your buys perfectly.
Broader Market Implications
A gold supercycle could extend the stock market boom. Rate cuts lower borrowing costs, boosting stock values-like the S&P 500’s 80% rise from 2009-2011. They also push bond yields down and ignite commodity rallies.
This market dynamic presents several key implications for investors.
- Stocks set for gains: Gold and stocks often rise when rates fall, averaging 15% jumps in cutting cycles (MSCI data). Put 20% of your portfolio into S&P 500 ETFs like VOO.
- Bonds see lower yields: PIMCO expects 10-year U.S. Treasury yields to hit 3% in 2024. Go for intermediate bonds via BND ETF.
- Commodities ready to soar: Silver and copper jumped 20-50% in past cycles (London Metal Exchange). Get in with SLV for silver or CPER futures.
- Diversify smartly: Add 5-10% gold to cut volatility by 25% and boost Sharpe ratio (Vanguard study). The Sharpe ratio measures risk-adjusted returns.
A 60/40 portfolio with GLD ETF beat benchmarks by 8% in 2022’s crash, per Morningstar. Balanced mixes like this boost your returns while managing risk.
Risks and Mitigations
The supercycle idea looks promising, but watch the risks. If inflation hits 4%-above the Fed’s 2% goal-they might turn hawkish, like in 2013’s Taper Tantrum that dropped gold 28%.
Watch these key risks:
- Inflation keeps coming back strong. A rise in the Consumer Price Index (CPI, which measures price changes for everyday goods) might push back interest rate cuts. Protect your investments now by putting money into Treasury Inflation-Protected Securities (TIPS). These adjust for inflation and yield 1.8% today.
- The U.S. dollar could surge again. In 2022, the Dollar Index (DXY, a measure of the dollar’s strength against other currencies) rose 7%, hurting gold prices. Fight back by using EUR/USD futures contracts. These let you bet on the euro versus the dollar to offset losses.
- The economy might dodge a recession with a gentle slowdown. This soft landing could make gold less attractive as a safe spot during tough times. Spread your risk by putting 10% of your portfolio into gold exchange-traded funds (ETFs, which are easy-to-buy shares tracking gold prices). Try SPDR Gold Shares (GLD), now at $220 per share.
- New mines could flood the market with gold. Projects in Nevada might hold back price jumps. Stay ahead by checking quarterly reports from the United States Geological Survey (USGS). They track mining trends closely.
Look at the 2011-2015 gold slump after the second round of quantitative easing (QE2, when central banks pumped money into the economy). Gold prices dropped 45%, but bounced back strong with just 5% in gold ETFs, according to BlackRock. Time your moves using Elliott Wave patterns and Fibonacci retracements for better results.
Dive deeper into gold’s ups and downs with the Bank for International Settlements (BIS) 2022 paper. It covers COVID-19 effects too.
- Track prices using tools like the RSI (Relative Strength Index, shows if gold is overbought or oversold) and MACD (Moving Average Convergence Divergence, spots trend changes). Check the COT (Commitments of Traders) report for trader positions.
- Watch global drivers: India’s huge gold buying and China’s reserves. Prices swing on exchanges like LBMA (London Bullion Market Association), COMEX (Commodity Exchange), and Shanghai Gold Exchange.
- Gauge market fear with the VIX (Volatility Index) index. Measure risk with the Sharpe ratio (how much return per unit of risk). Factor in AISC (All-In Sustaining Costs for miners) and ESG principles (Environmental, Social, Governance standards). Rebalance your portfolio every quarter to stay tough against shocks.