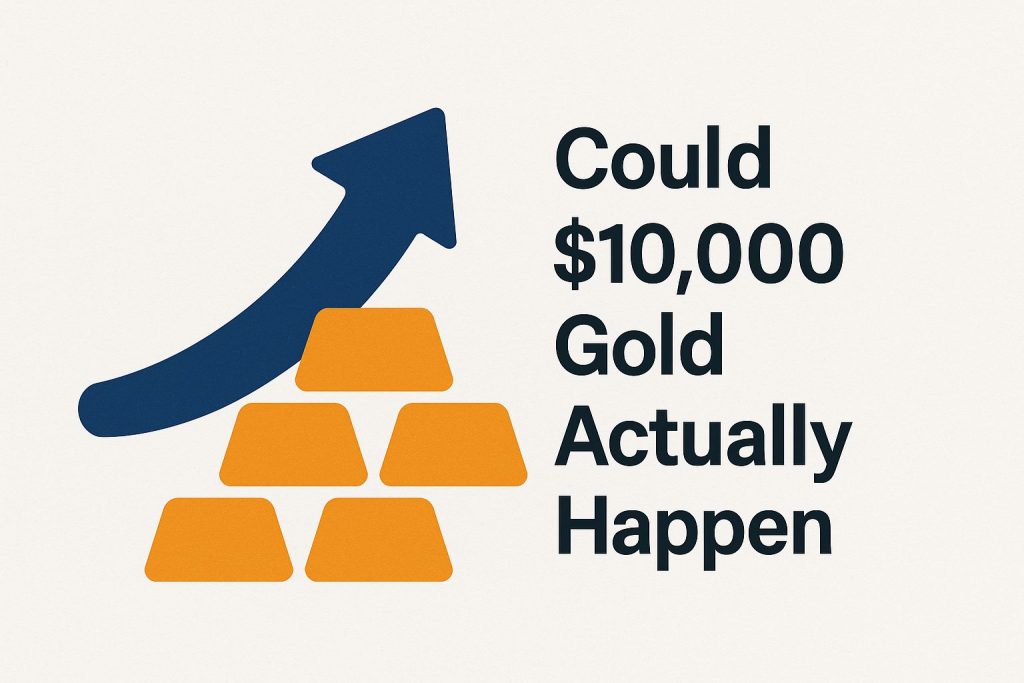
Picture gold prices exploding to $10,000 per ounce. That’s a huge jump from today, and with inflation eating away at money and world tensions rising, it could change how we save wealth.
Let’s dive into past highs, what drives prices like bank policies and supply issues, expert predictions, and the risks to see if this is possible.
Historical Gold Price Trends
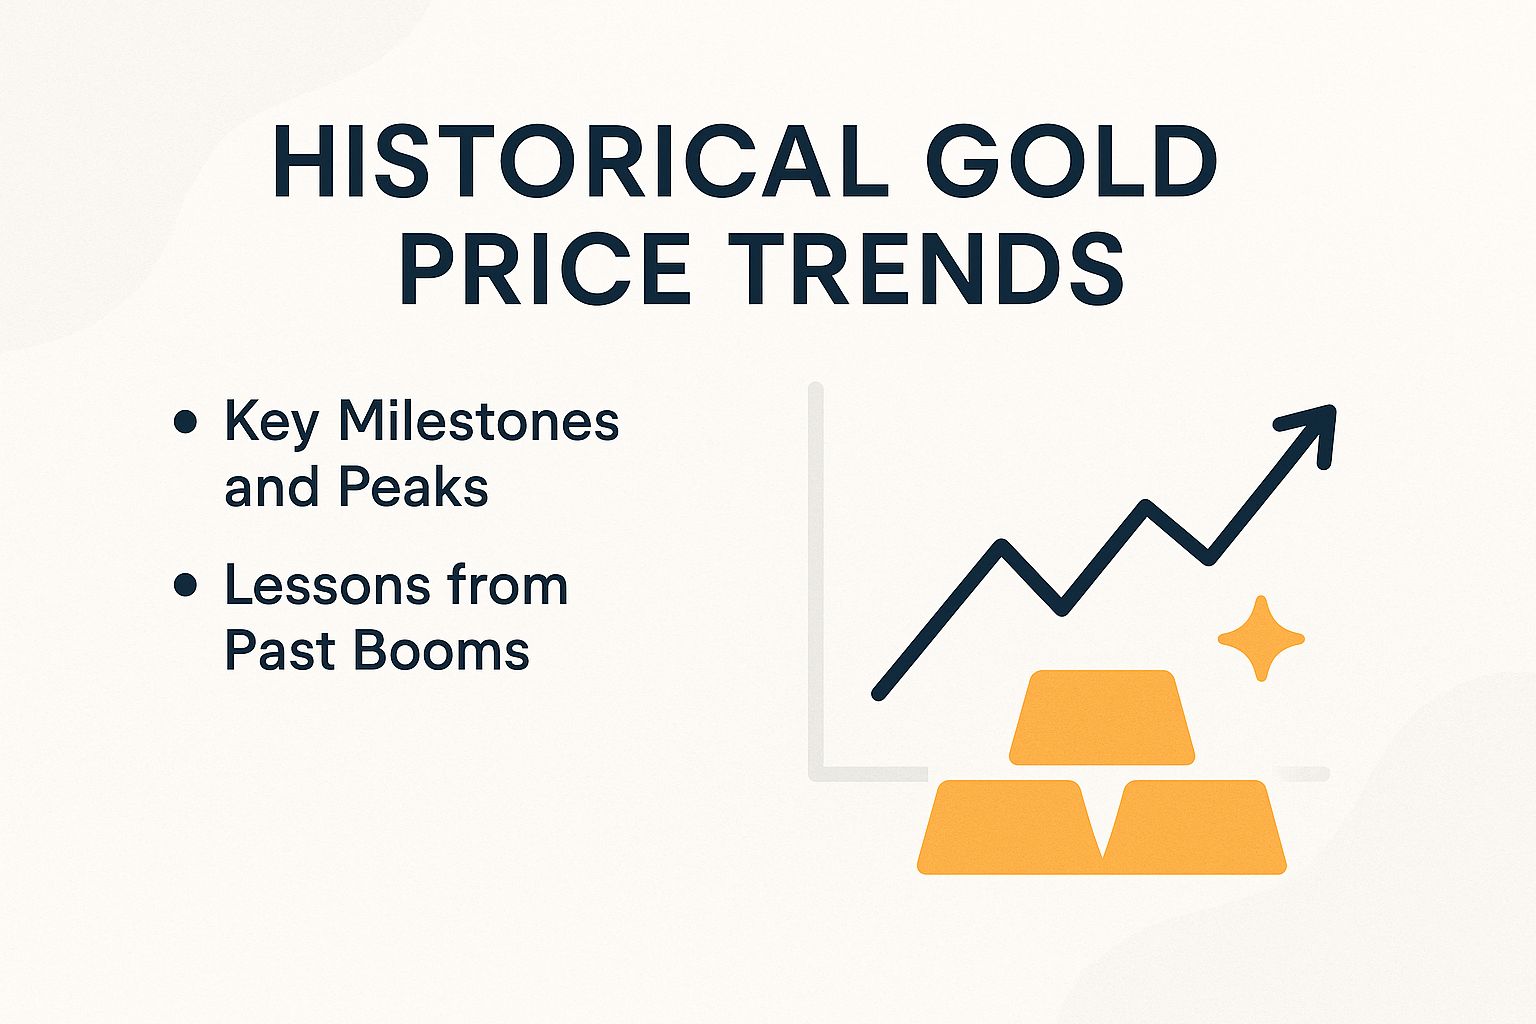
In the past five decades, gold prices have exhibited marked volatility through various cycles, ranging from the inflation-induced surge of the 1970s to the recovery-driven rallies following the 2008 financial crisis. These historical trends offer critical insights for investors navigating today’s markets.
Key Milestones and Peaks
- 1980 peak: $850/oz ($2,800 adjusted), driven by oil crises and high inflation.
- 2000 low: $252/oz ($450 adjusted) during dot-com bubble.
- 2011 high: $1,920/oz ($2,500 adjusted) post-2008 crisis.
- 2020 surge: $2,075/oz ($2,400 adjusted) amid COVID and bank buying.
Lessons from Past Booms
- 1970s: Hold steady through inflation for massive gains.
- 2008: Gold protects when stocks crash.
- 2011: Watch for volatility after peaks.
- 2020: Central bank actions boost gold fast.
Build a 60/40 stock-bond portfolio with 10% in gold via the SPDR Gold Shares ETF (GLD). Its low 0.40% fee hedges inflation and balances growth-act now to protect your wealth!
Current Market Conditions
Gold trades at about $1,950 per ounce as of October 2023. It’s up 8% this year.
A weaker U.S. dollar at 103 helps. The Fed might pause rate hikes soon-exciting times ahead!
- 52-week range: $1,680 to $2,050 (Kitco data).
- Gold moves opposite to 10-year Treasury yields at 4.8% now.
The job market stays strong with unemployment at 3.8%.
Banking worries linger after the Silicon Valley Bank collapse, per Bloomberg reports.
The Relative Strength Index (RSI), a tool that measures price momentum on a scale of 0 to 100, sits at 55.
This neutral reading shows balanced buying and selling.
Gold finds key support at $1,900 using Fibonacci retracement levels, which help predict price reversals.
Federal Reserve data shows U.S. GDP grew 2.1% in Q2 2023.
Consumer confidence hit 103.
These strong signs drive more interest in gold as a safe bet during tough times.
Set up weekly alerts on Yahoo Finance now to stay ahead. Look for buy chances when prices drop below the 50-day moving average of $1,920 – don’t miss out!
Factors Driving Potential Surge
Big economic shifts and world events are teaming up. They could push gold to $2,500 or higher, just like in past crises – get ready for the surge!
Inflation and Currency Devaluation
U.S. inflation stayed at 3.7% in 2023 despite rate hikes. Gold shines as a wealth protector.
The World Gold Council shows a 78% link between gold prices and CPI rises since 1971.
See the impact:
- In 2022, 9.1% U.S. inflation sparked a 10% gold jump.
- Venezuela’s 1 million% hyperinflation in 2018 boosted gold premiums by 500%.
U.S. debt hits $34 trillion, says the Treasury. Since 2008, $9 trillion in quantitative easing – money printing by central banks – adds fuel to the fire.
To mitigate these risks, financial advisors at BlackRock recommend allocating 5% of one’s investment portfolio to gold. Suitable options include:
- Physical one-ounce gold coins available from APMEX, with a $50 premium over the spot price;
- The iShares Gold Trust (IAU) exchange-traded fund, which carries an expense ratio of 0.25%.
Studies by the International Monetary Fund highlight that demand from emerging markets, such as India and China, has increased by 15% annually, further supporting gold’s appeal.
Geopolitical Tensions
Geopolitical fights boost gold demand. The Russia-Ukraine war spiked demand 20% in 2022 as investors fled to safe assets amid sanctions.
Other hot spots:
- Ukraine invasion: 15% price jump in March 2022 (LBMA data).
- US-China trade war: 25% rise from 2018-2020 amid $300B volatility.
- Middle East unrest and Iran sanctions: 10% gold increases.
- 2020 pandemic: Central banks bought 650 tons.
Russia’s reserves of 2,300 tons, now frozen, have hastened efforts toward diversification in global portfolios.
For practical application, it is advisable to monitor the Geopolitical Risk Index-developed by Caldara and Wu, which has risen 200% since 2022-through the Federal Reserve Economic Data (FRED) platform.
Consider investing in gold exchange-traded funds (ETFs), such as GLD, during periods when the CBOE Volatility Index (VIX) exceeds 30.
Grab reports from the Council on Foreign Relations. Use their scenarios to shape your gold investment plans.
Central Bank Policies
Central banks snapped up a record 1,136 tons of gold in 2022 – the most since 1967!
This shows distrust in paper money, especially with low rates and ballooning bank balance sheets.
This surge in acquisitions highlights gold’s inverse correlation with interest rates, as demonstrated by a correlation coefficient of -0.65 cited by JPMorgan. For instance, the European Central Bank’s EUR2.6 trillion quantitative easing program implemented after 2011 contributed to elevating gold prices to $1,900 per ounce.
China’s gold reserves top 2,200 tons, per People’s Bank of China data.
This supports ongoing demand.
According to a Reuters poll, 29% of central banks anticipate making additional purchases in 2023, within the context of global holdings totaling 36,000 tons, as reported in the Bank for International Settlements’ annual report.
Keep an eye on expected Federal Reserve rate cuts to 4.5% by 2024 using the CME FedWatch tool.
Check out the GDX ETF for gold mining stocks. It jumped 15% from recent policies, boosting your portfolio in these trends.
Think about futures market speculation on the COMEX exchange. Compare gold to other assets during global issues like Russia sanctions and Middle East conflicts.
Supply and Demand Dynamics in Precious Metals
Global gold supply stays tight at about 3,600 tons from mining each year.
Demand hit 4,700 tons, creating a 1,100-ton shortage that could push prices up per ounce, says the World Gold Council.
Mining provides 75% of supply, or 2,700 tons. Recycling adds the rest, 900 tons, per USGS data.
All-in sustaining costs average $1,200 per ounce due to supply issues.
Jewelry drives 48% of demand, led by India and China markets.
- Investment: 25%, via gold ETFs like GLD (exchange-traded funds, easy ways to invest in gold).
- Industrial use: 7%, in electronics.
The 2023 deficit grew over 1,000 tons from shortages. Mine production dropped 5% due to pandemic effects. This gap signals rising prices-act now!
Track commodities via GFMS and Thomson Reuters reports. Grab gold as a safe haven during disruptions, like South Africa strikes from Russia sanctions.
ESG factors-environmental, social, and governance rules-will raise costs 10-15% for sustainable mining, per EY study.
Diversify into silver and platinum for excitement in precious metals! They follow a 27:1 gold-to-silver ratio. They match gold mining trends.
| Category | 2023 Tons | YoY Change |
|————–|———–|————
This table highlights key aspects of the gold market, including historical prices trends. | Category | 2023 Tons | YoY Change |
|
Expert Predictions and Scenarios for Gold Price Target
Leading analysts with analyst opinion, such as those at Goldman Sachs, project gold prices to reach $2,050 by the end of 2023 as a price prediction, with optimistic scenarios extending to $2,500 per ounce amid ongoing inflationary pressures acting as an inflation hedge. This market forecast encompasses three primary scenarios influenced by the economy and dollar value.
In the bullish scenario amid monetary policy easing, prices could climb to $2,500 per ounce, supported by continued Federal Reserve easing and fiscal policy, according to UBS, which assigns an 80% probability to this outcome should the Consumer Price Index remain below 3% during potential recession.
The base case anticipates prices at $2,000 per ounce under conditions of stable economic growth in the economy, as modeled by JPMorgan and incorporating key indicators such as gross domestic product, unemployment rates, and yield curve inversions in the bond market.
In the bearish outlook tied to risk assets, prices may decline to $1,700 per ounce if interest rates rise to 6% due to money printing concerns and debt ceiling issues, per Citigroup’s analysis.
From a technical analysis perspective using price charts, a breakout above the $2,000 resistance levels would indicate potential upside momentum, evidenced by a head-and-shoulders pattern observed on weekly charts with moving averages (StockCharts), and RSI indicator signals.
Kitco’s Jon Nadler accurately predicted a 10% increase in gold prices during 2022, considering long-term trends and elliott wave theory, avoiding a market bubble.
For strategic implementation in speculation, analysts recommend conducting Monte Carlo simulations via Portfolio Visualizer to generate price forecasts and establishing price alerts at the $1,950 support levels, watching for parabolic price rise.
According to Reuters polls, 70% of analysts maintain a bullish stance on gold in the futures market and COMEX exchange.
Gold Price Forecasts for 2024 (USD per Ounce), Including All-Time High Projections
#en3iu4bm.bar-container { position: relative; overflow: visible!important; } #en3iu4bm.bar-value { position: absolute!important; left: 50%!important; top: 50%!important; transform: translate(-50%, -50%)!important; color: white!important; font-weight: 700!important; font-size: 14px!important; white-space: nowrap!important; background: rgba(0, 0, 0, 0.7)!important; padding: 4px 12px!important; border-radius: 20px!important; z-index: 30!important; text-shadow: 0 1px 2px rgba(0, 0, 0, 0.3)!important; pointer-events: none!important; display: inline-block!important; } #en3iu4bm.animated-bar { z-index: 1!important; } @media (max-width: 768px) { #en3iu4bm { padding: 16px!important; } #en3iu4bm h2 { font-size: 24px!important; } #en3iu4bm h3 { font-size: 16px!important; } #en3iu4bm.bar-label { font-size: 12px!important; } #en3iu4bm.metric-card { padding: 20px!important; } #en3iu4bm.bar-value { font-size: 13px!important; padding: 3px 10px!important; } } @media (max-width: 480px) { #en3iu4bm { padding: 12px!important; } #en3iu4bm h2 { font-size: 20px!important; } #en3iu4bm h3 { font-size: 14px!important; } #en3iu4bm.bar-label { font-size: 11px!important; margin-bottom: 6px!important; } #en3iu4bm.bar-value { font-size: 12px!important; padding: 2px 8px!important; min-width: 45px!important; text-align: center!important; } #en3iu4bm.bar-container { height: 36px!important; overflow: visible!important; } }
These forecasts consider factors like 1980 peak, 2011 surge, historical prices, all-time high, crypto comparison with bitcoin as digital gold versus fiat currency, central bank reserves, de-dollarization by BRICS nations, middle east conflict, oil prices, economic collapse, black swan events, dentistry applications, gold bars for secure storage, gold ira for retirement investing and capital gains tax implications.
Gold Price Forecasts for 2024 (USD per Ounce)
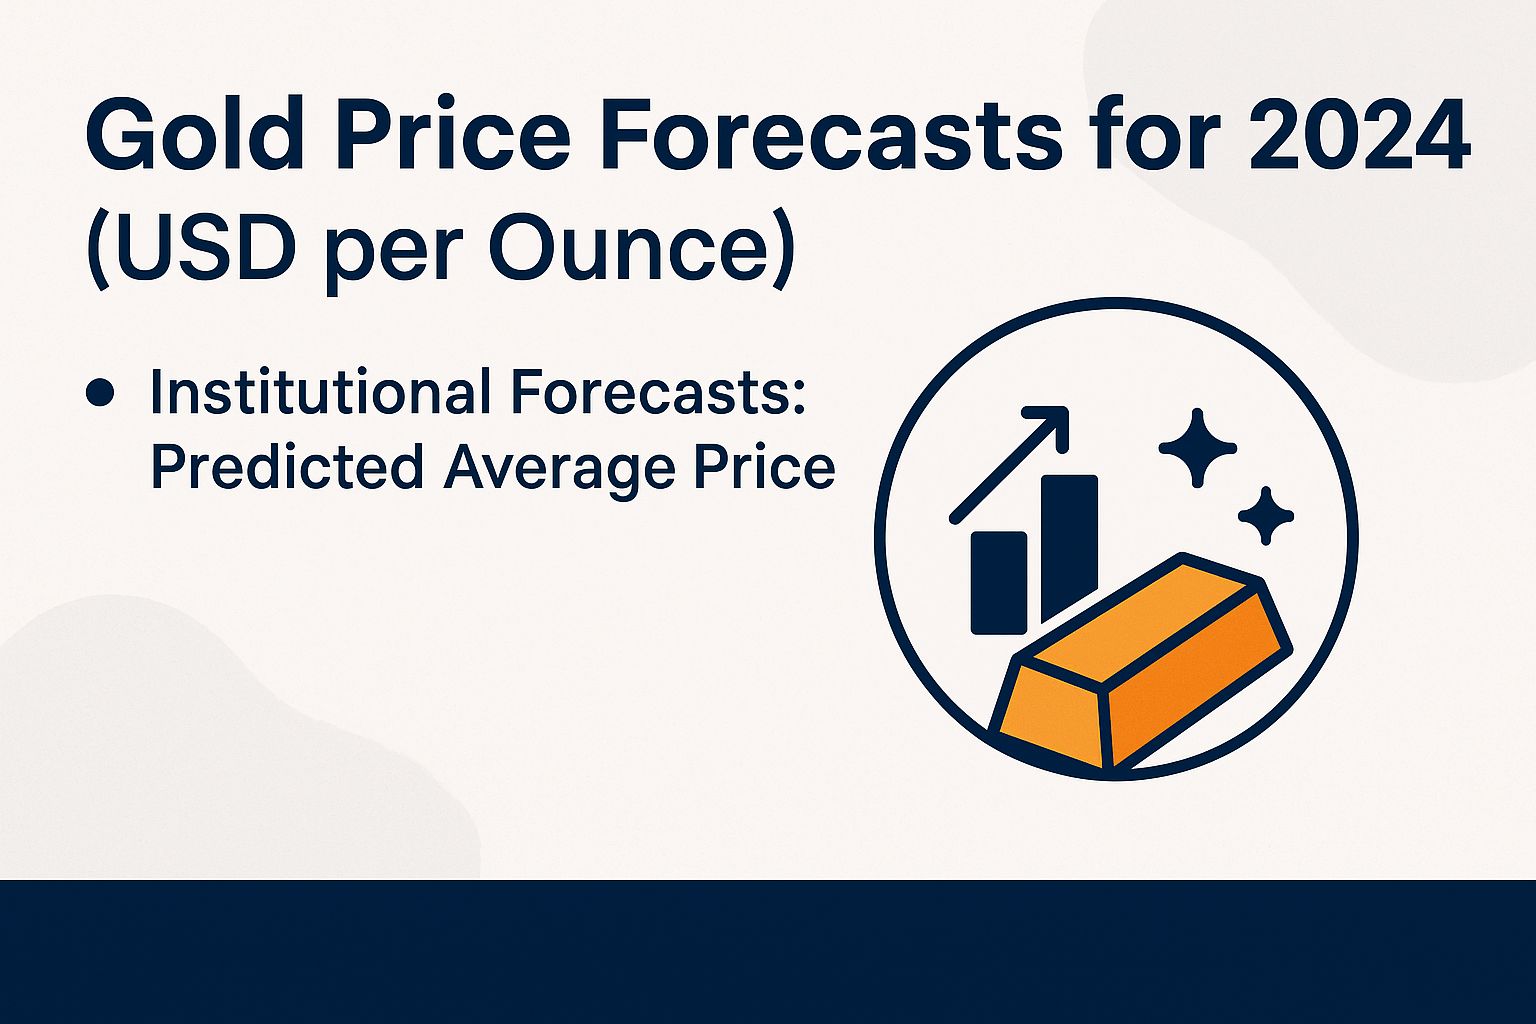
Institutional Forecasts: Predicted Average Price
These forecasts for gold prices on the COMEX exchange incorporate ESG factors, growing demand from BRICS nations, and technical analysis using the RSI indicator.
(function() { setTimeout(function() { var bars = document.querySelectorAll(‘[class*=”animated-bar-en3iu4bm”]’); bars.forEach(function(bar) { var width = bar.getAttribute(‘data-width’); if (width) { bar.style.width = width + ‘%’; } }); }, 100); })();
The Gold Price Forecasts for 2024 (USD per Ounce) offer valuable insights from leading institutions, reflecting expectations for gold’s performance amid global economic uncertainties, inflation pressures, and geopolitical tensions. Gold, often viewed as a safe-haven asset, is predicted to maintain or increase its value, with forecasts varying based on economic models and market analyses.
Institutional Forecasts for the predicted average price show a consensus around the $2,000 mark, signaling bullish sentiment. The World Bank projects a conservative 1950.0 USD per ounce, likely factoring in stabilized global growth and moderated inflation risks. In contrast, Bloomberg anticipates a higher 2068.925 USD per ounce for the first quarter, driven by early-year demand from central banks and investors hedging against volatility.
- ING forecasts 2031.0 USD per ounce, emphasizing gold’s role as an inflation hedge as central banks navigate interest rate adjustments.
- Goldman Sachs predicts 2050.0 USD per ounce, citing strong ETF inflows and industrial demand in electronics and jewelry markets.
- JP Morgan is the most optimistic with 2175.0 USD per ounce for the fourth quarter, attributing this to potential U.S. dollar weakening and rising safe-haven buying amid election-year uncertainties.
These projections, ranging from 1950 to 2175 USD, average approximately 2055 USD, indicating a 5-10% potential rise from recent levels around 1900-2000 USD. Factors influencing these forecasts include persistent inflation, supply constraints from mining influenced by ESG factors, and diversification away from fiat currencies. For investors, this suggests gold could outperform bonds or equities in a volatile environment, though risks like aggressive rate hikes could cap gains.
Overall, the Gold Price Forecasts for 2024 underscore gold’s enduring appeal. Businesses and individuals monitoring these trends can better position portfolios, while policymakers might consider gold’s stability in broader economic strategies. As 2024 unfolds, actual prices will depend on evolving global events, making these institutional views a critical starting point for informed decisions.
Risks and Counterarguments
Despite bullish market signals, potential risks such as interest rates rising to 5.5% and Bitcoin’s 50% year-to-date surge-as indicated by the RSI indicator-may constrain gold prices at $1,800, similar to the 28% correction observed in 2013.
To mitigate these risks, it is advisable to address the following four key factors:
- Higher Interest Rates: Federal Reserve rate hikes have an inverse effect on gold prices, as evidenced by the flattening of prices between 2015 and 2019. Recommended solution: Focus on real yields below 1% by utilizing Treasury Inflation-Protected Securities (TIPS) for effective inflation hedging.
- Strength of the U.S. Dollar: A Dollar Index (DXY) exceeding 105 exerts downward pressure on commodities. Countermeasure: Capitalize on demand from emerging markets, including BRICS nations’ gold acquisitions, which accounted for 20% of global supply in 2022.
- Recessionary Pressures: The International Monetary Fund (IMF) projects potential demand reductions of 10-15%. Hedging strategy: Gold’s beta of 0.2 relative to the S&P 500 provides low volatility, serving as a reliable stabilizer.
- Competition from Cryptocurrencies: Bitcoin’s price appreciation shows correlation with gold during periods when Bitcoin reaches $30,000 levels; however, gold’s 5,000-year track record of stability underscores its enduring value, in contrast to the 1980 commodity bubble, which resulted in a 50% price decline.
For actionable implementation, consider a 70/20/10 allocation across stocks, bonds, and gold, respectively, while incorporating 10% stop-loss orders through COMEX exchange futures contracts on the Chicago Mercantile Exchange (CME). For further analysis, refer to the Bank for International Settlements (BIS) study on commodity risks.