Gold prices just surged past $2,400 per ounce. Global uncertainties make this exciting for investors.
History shows explosive rallies in tough times. Gold acts as a key hedge against inflation and tensions.
Let’s dive into past bull cycles, current trends, and big drivers like interest rates and monetary policy. We’ll check if a super bull market is coming, perfect for protecting against recessions and stock volatility.
Gold’s Epic Historical Bull Markets

Gold bull markets deliver huge returns in crises and recessions. In the 1970s, prices rocketed from $35 to $850 per ounce due to inflation and the end of the gold standard.
Major Past Cycles
The 1971-1980 cycle lasted nine years amid inflation. It peaked with the Hunt brothers’ wild attempt to corner the market in 1980.
From 2001 to 2011, after the dot-com crash and financial crisis, gold jumped 650% from $250 to $1,900 per ounce. Everyday investors and big funds bought in heavily; it hedged against quantitative easing-when central banks print more money to boost the economy.
In 2020-2022, during COVID chaos, gold soared 50% from $1,500 to $2,070 per ounce in just two years. Fears of massive stimulus and stock sell-offs drove the rush.
Gold cycles usually last 7 to 10 years. After the 2022 high, we might see a pause or fresh climb amid global tensions.
Don’t miss out-time your entry below $2,000 per ounce on bullish signals. Retail investors, grab those forecasts now!
Key Drivers and Patterns
Gold bull markets spike during high inflation. In the 1970s, with CPI-a measure of price changes-at 13% yearly, gold gained about 30% annually.
Additional key drivers encompass:
- Geopolitical shocks, like the 2008 crisis, sent gold up 25% after Lehman fell. Investors flocked to this safe haven.
- Low real interest rates and inverted yield curves, as in 2011 with Fed rates at 0%, pushed gold to $1,900.
- A weak U.S. dollar, with a -0.7 correlation to gold, boosts prices during dollar drops.
- Mining supply issues, like 1979-1980 strikes and delays, tighten availability and spike costs.
- Gold ETF inflows and central banks buying reserves fuel demand surges.
- Rising rates can slow things, but uncertainty usually wins for gold bulls.
Bull markets in gold often consolidate for 3 to 5 years before big breakouts. They break through resistance levels using tools like RSI (Relative Strength Index, which measures price momentum) and MACD (Moving Average Convergence Divergence, a trend-following indicator), based on CME Group analysis.
Chart patterns and support levels help investors time their buys smartly. Get ready – this could signal the next gold rush!
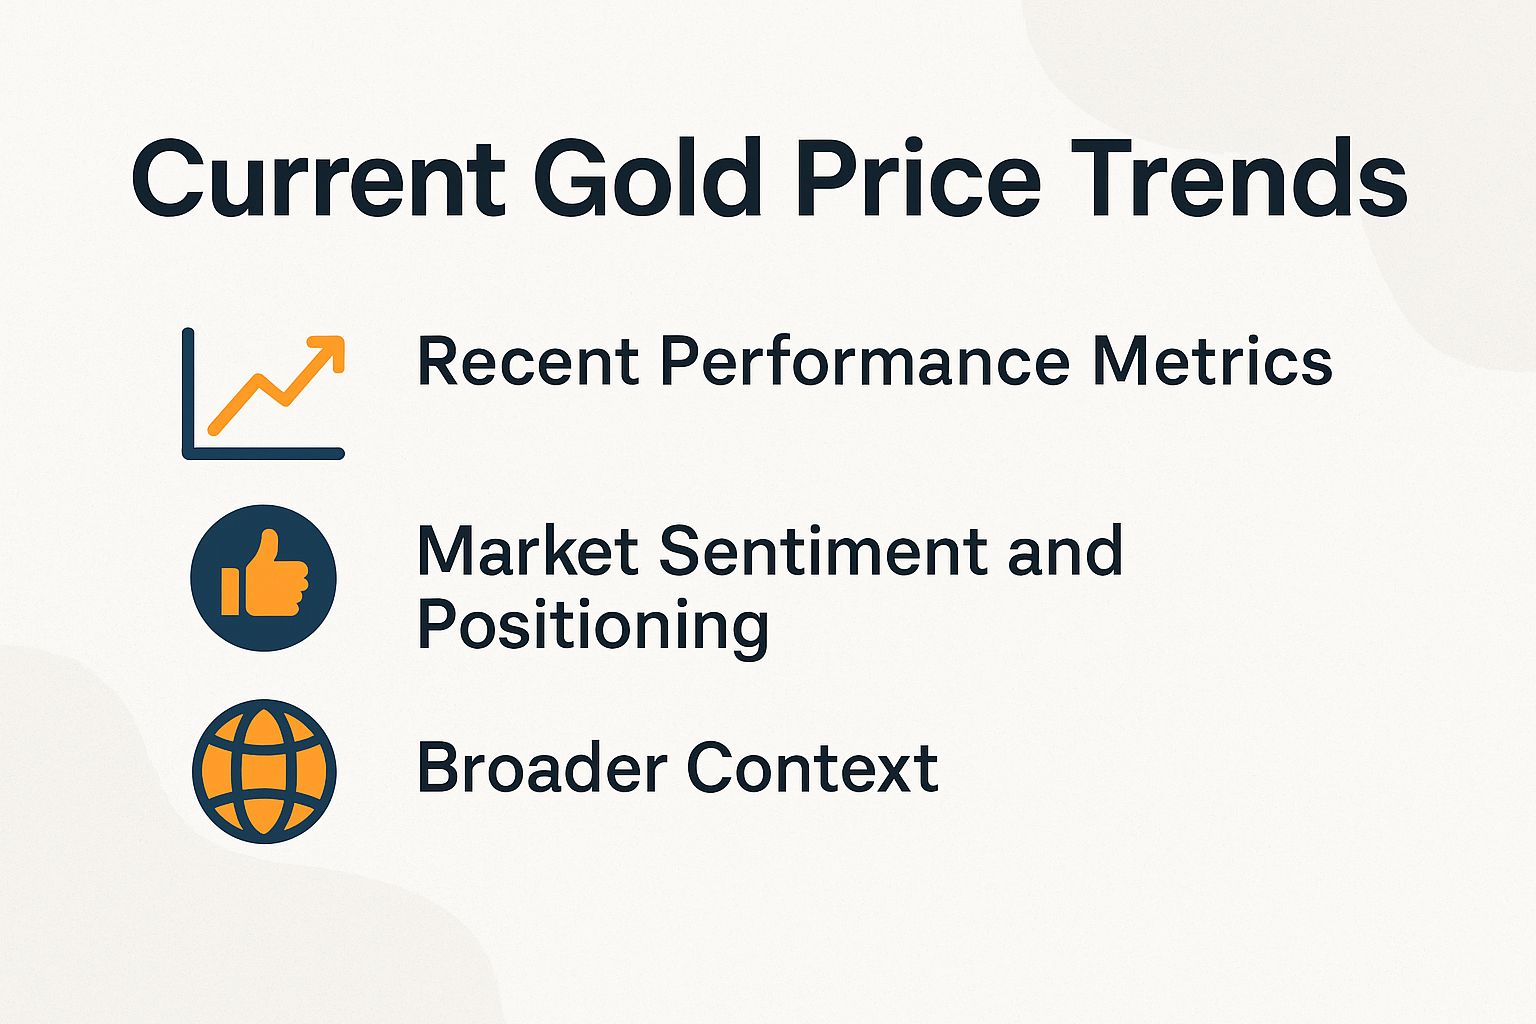
Current Gold Price Trends
Gold’s spot price jumped 18% in 2024 so far. It now tops $2,400 per ounce, beating its 2022 record high.
ETFs (funds that track gold prices and trade like stocks) saw huge inflows. Central banks bought big too, per Bloomberg.
Recent Performance Metrics
Gold ETFs like GLD pulled in $4.5 billion in Q2 2024. This drove a thrilling 12% price jump that quarter, says ETF.com.
Gold’s spot price hit $2,431 per ounce in July 2024. That’s from the London Bullion Market Association.
It beats the S&P 500’s 15% and even Bitcoin, the so-called digital gold.
- Daily trading volume on COMEX gold futures: 300,000 contracts (Chicago Mercantile Exchange).
- Gold’s yearly volatility: 16%, lower than the VIX index (a measure of stock market fear from Chicago Board Options Exchange).
Gold moves opposite to stocks with a -0.2 correlation. This makes it a smart diversifier for your portfolio during stock booms.
Watch for the 50-day moving average (short-term price trend) crossing above the 200-day (long-term trend). This ‘golden cross’ signals a buy in a bull market, especially with positive fear-greed index readings.
GLD hit this in June. Gains soared from there – don’t miss the next one!
The following table illustrates the quarterly price ranges:
| Quarter | High ($/oz) | Low ($/oz) |
|---|---|---|
| Q1 2024 | 2,200 | 2,000 |
| Q2 2024 | 2,431 | 2,200 |
Protect your money by putting 5-10% in GLD. It hedges against drops in bonds and stocks.
Market Sentiment and Positioning
The fear-greed index shows optimism. COT reports (Commitment of Traders, tracking big players’ bets) reveal hedge funds and everyday investors going long on gold.
This points to strong upward momentum. But watch for sellers cashing in at key resistance points.
Broader Context
Low Treasury yields and easy money from the ECB and Fed weaken fiat currencies. Gold hedges this, moving opposite to a strong dollar.
ESG investing (Environmental, Social, Governance factors) pushes for green mining. Yet, strikes and high costs squeeze miners’ profits.
Gold Bull Market Key Statistics 2024 – Exciting Numbers to Watch!
- Year-to-date gain: 18%
- Current price: $2,431/oz
- ETF inflows Q2: $4.5B
#2dawo2bf.bar-container { position: relative; overflow: visible!important; } #2dawo2bf.bar-value { position: absolute!important; left: 50%!important; top: 50%!important; transform: translate(-50%, -50%)!important; color: white!important; font-weight: 700!important; font-size: 14px!important; white-space: nowrap!important; background: rgba(0, 0, 0, 0.7)!important; padding: 4px 12px!important; border-radius: 20px!important; z-index: 30!important; text-shadow: 0 1px 2px rgba(0, 0, 0, 0.3)!important; pointer-events: none!important; display: inline-block!important; } #2dawo2bf.animated-bar { z-index: 1!important; } @media (max-width: 768px) { #2dawo2bf { padding: 16px!important; } #2dawo2bf h2 { font-size: 24px!important; } #2dawo2bf h3 { font-size: 16px!important; } #2dawo2bf.bar-label { font-size: 12px!important; } #2dawo2bf.metric-card { padding: 20px!important; } #2dawo2bf.bar-value { font-size: 13px!important; padding: 3px 10px!important; } } @media (max-width: 480px) { #2dawo2bf { padding: 12px!important; } #2dawo2bf h2 { font-size: 20px!important; } #2dawo2bf h3 { font-size: 14px!important; } #2dawo2bf.bar-label { font-size: 11px!important; margin-bottom: 6px!important; } #2dawo2bf.bar-value { font-size: 12px!important; padding: 2px 8px!important; min-width: 45px!important; text-align: center!important; } #2dawo2bf.bar-container { height: 36px!important; overflow: visible!important; } }
Unlock Exciting Gold Bull Market Stats for 2024!
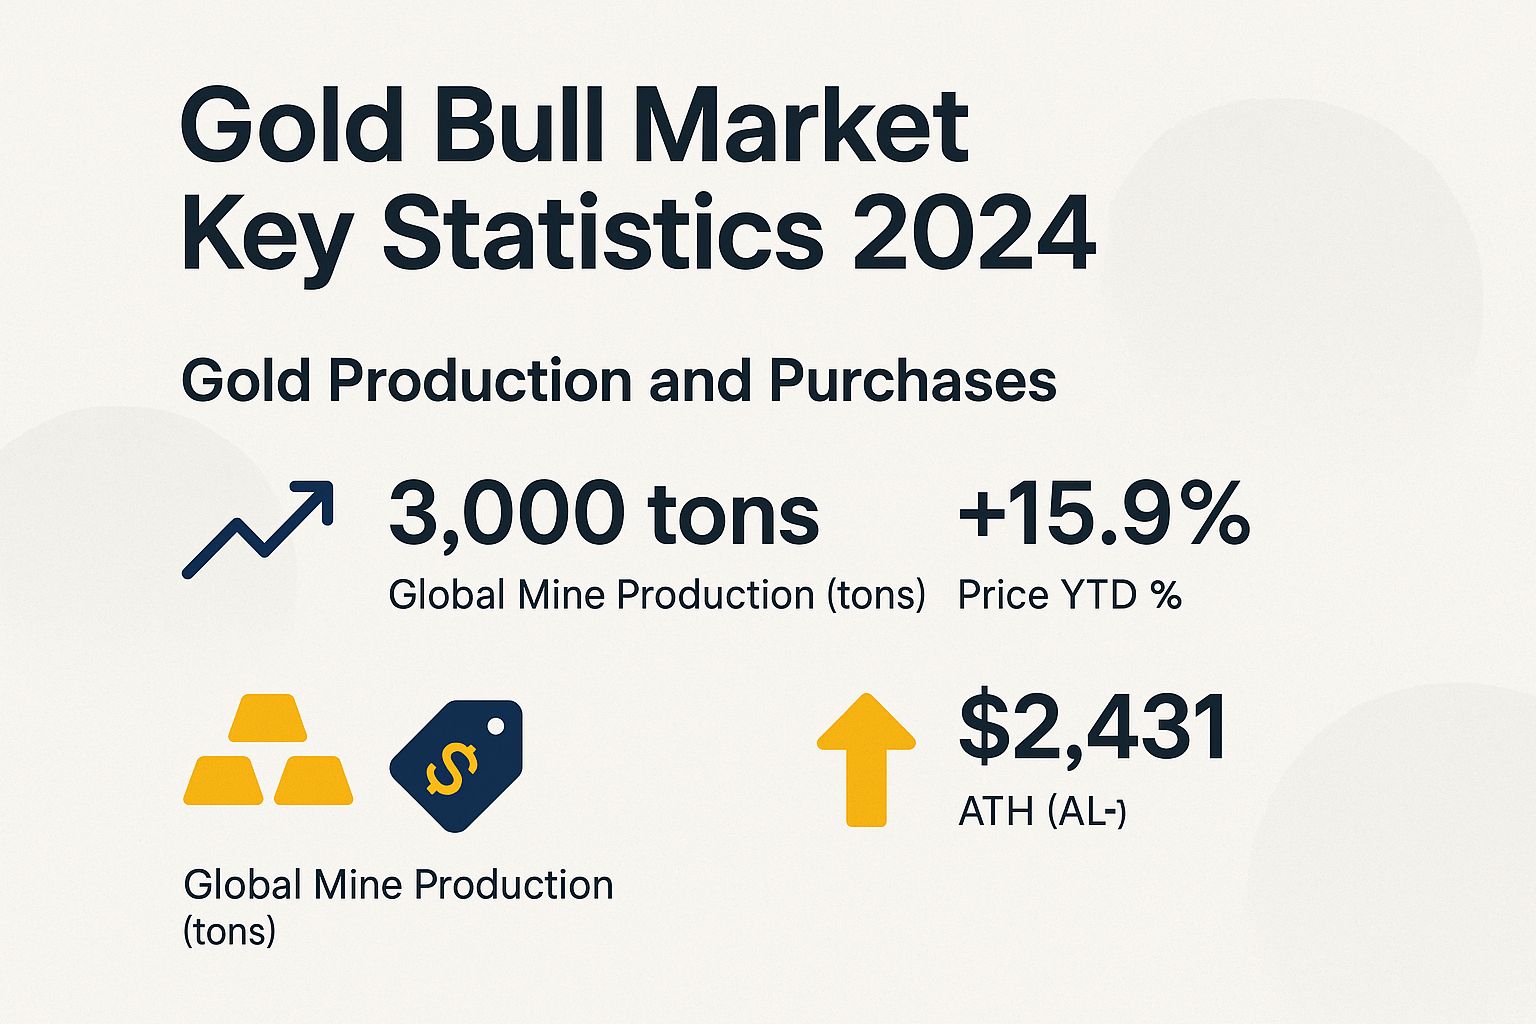
Global Gold Mine Production in Tons
Jump into the gold rush! These stats show why now is the perfect time to watch the market.
- 2023: 3,000 tons – Steady output keeps the market buzzing!
- 2014: 3,000 tons – Production has held strong for a decade.
Gold Bull Market Key Statistics 2024 shows stable global gold production in a surging bull market.
Prices hit record highs from economic worries, inflation fears, and demand from investors and central banks.
This data highlights mine production.
It shapes supply in the precious metals world.
Global Mine Production (tons) stays steady over the years.
In 2014, the world produced 2990 tons from top countries like China, Russia, Australia, and South Africa.
This marked peak efficiency before issues like lower ore quality and tough environmental rules hit.
By 2023, output rose just a bit to 3000 tons-a 0.3% gain in almost 10 years.
Gold mining is mature now. New finds are scarce, and costs climb from deeper digs and global tensions.
- Implications for the Bull Market:
- Stable production clashes with rising demand. This creates a big supply gap.
- Central banks in growing economies bought over 1,000 tons each year lately. (VIX measures stock market fear and volatility.)
- People rushed to buy gold coins and bars during market ups and downs.
- Supply can’t keep up. This drives prices up-over $2,400 per ounce in 2024 on exchanges like COMEX (a major U.S. metals market) and LBMA (London’s gold benchmark).
- Regional Breakdown:
- China tops the list with 370 tons in 2023. Its own huge demand fuels this.
- Russia follows at 310 tons, even with sanctions hitting hard.
- India’s buying power is massive.
- Australia keeps steady output. New African mines add to the mix.
- Watch out-strikes or water issues could squeeze supply and spike prices!
- Future Outlook:
- Production might flatten or drop without big tech advances in exploration or recycling.
- ESG standards (Environmental, Social, Governance rules for ethical investing) play a role here.
- In this hot bull market, scarcity will keep prices soaring-great for miners!
- But jewelers and industries face tough times with rising demand. (COT report tracks trader positions in futures markets.)
- Get in now before supply tightens more!
Gold shines as a safe haven during shaky times. Many pick it over trendy options like Bitcoin.
Production sticks near 3,000 tons yearly. Yet demand surges ahead, powering the 2024 bull market and boosting gold’s spot in global portfolios!
Macroeconomic Factors

Big economic forces push gold prices up. Inflation over 3% lingers, and the Federal Reserve may cut interest rates soon.
Fed studies show a strong link-0.8 correlation-between M2 money supply growth (total cash in the economy) and gold gains.
Inflation and Interest Rates
In May 2024, the U.S. CPI (a measure of everyday price changes) hit 3.3%.
Gold prices jumped 10% then, echoing the 1970s when high inflation sparked a massive 2,300% gold boom-Gold is repeating history!-per Bureau of Labor Statistics data.
Gold reliably fights inflation.
When CPI is 2-5%, it delivers 4.5% real returns, says Vanguard research.
Why? Gold moves opposite to real interest rates-nominal rate minus inflation. Example: 2% yield with 3% CPI means -1% real rate, boosting gold.
When real rates dip below -1%, gold averages 15% yearly gains. Bank for International Settlements (BIS, a global bank coordinator) confirms this.
Right now, Fed rate is 5.25%, heading to 4% by 2025 with sticky inflation. ECB (European Central Bank) eyes cuts too-Goldman Sachs sees 20% gold surge ahead! Act fast!
2022’s sharp rate hikes dropped gold 10%.
Keep an eye on Fed news. Diversify with ETFs like GLD (funds that track gold prices without buying the metal).
Currency and Debt Dynamics
The USD dropped 5% this year against major currencies. This fueled a 15% jump in physical gold prices.
Gold acts as a strong shield against currency swings. The U.S. national debt hit $34 trillion, per the U.S. Treasury.
Three key factors drive this link.
The Dollar Index (DXY) sits at 102 right now. It shows a strong inverse link (0.75 correlation) to gold prices, per an ECB study. Gold protects well when the dollar weakens.
Technical Indicators and Market Analysis
Technical tools back the gold bull run.
- RSI (Relative Strength Index, a momentum gauge) stays over 60, signaling strength.
- MACD (Moving Average Convergence Divergence, a trend indicator) crossed bullishly.
- Gold trades above main moving averages, like the 50-day and 200-day lines.
Futures and Derivatives
Gold futures trade in contango (future prices higher than spot) or backwardation (future prices lower), based on supply views.
The COT (Commitments of Traders) report shows more long positions in paper gold. Physical gold-like coins, bars, and jewelry-boosts demand.
The U.S. debt-to-GDP ratio hit 120%.
This could spark new QE (money printing by the Fed). Back in 2011, gold surged 30% from similar moves.
M2 money supply (broad measure of cash in economy) grew 2% last year.
History shows this leads to gold jumps of 25%, per St. Louis Fed data. Watch for inflation ahead!
In the 2010-2012 Eurozone crisis, gold soared 50% as a safe haven. Investors flocked to it-could history repeat?
Track emerging market currencies like the Brazilian real. It fell 10% vs. USD in 2023, boosting gold demand 15% there.
Diversify your portfolio now! Put 5-10% in gold ETFs like GLD for protection.
Geopolitical Influences
Events like the Russia-Ukraine war boost central bank gold buys, especially when the VIX (fear index) spikes.
Russia added 44 tonnes to reserves in 2023 despite sanctions, per World Gold Council. This helped gold rally 20%-exciting times!
Four big factors fuel this trend.
- Conflicts like the 2022 Ukraine invasion spiked gold 15%, per RAND study. Tensions drive safe-haven buys!
- Sanctions push shifts from dollars; Russia moved $100B to gold, UN docs say.
- Trade wars, like 2018 U.S.-China, lifted gold 5%.
- Middle East risks could boost gold 10-20%, JPMorgan predicts. Act fast!
Boost your portfolio with 5-10% in gold ETFs like GLD during escalations.
| Event | Historical Gold Reaction | Probability |
|---|---|---|
| Wars/Tensions | +15% (2022) | Medium (30%) |
| Sanctions | +20% (2023) | High (50%) |
| Trade Wars | +5% (2018) | Low (20%) |
| Middle East Risks | Potential +10-20% | Medium (40%) |
Supply and Demand Fundamentals
Global gold demand hit 4,899 tonnes in 2023, up 3% from last year, per LBMA.
Mine supply was only 3,644 tonnes, creating a 1,255-tonne deficit, says World Gold Council. This screams bullish!
The deficit strengthens the bullish case for gold prices. Get in before it climbs higher!
Demand breaks down into key areas. India leads consumption.
- Jewelry: 48%
- Investment: 25%
- Central banks: 23%
- Technology: 4%
Central banks bought a record 1,037 tonnes.
China led, growing reserves to 2,262 tonnes. India added 800 tonnes, mostly for jewelry.
ETF inflows added $10 billion to demand.
Mining makes up 75% of gold supply.
Output stays steady at 3,600 tonnes, with total mining costs at $1,300 per ounce (that’s the all-in sustaining costs, or AISC).
Interest grows from ESG investing, which focuses on environmental, social, and governance factors.
Recycling supplies the other 25%. This keeps the total supply balanced.
Get ready for bigger demand!
The World Gold Council predicts a market deficit of 1,500 tonnes by 2025. This boosts gold’s bright future.
Technical Analysis Signals
Gold’s daily chart shows a bullish golden cross.
That’s when the 50-day moving average ($2,300) crossed above the 200-day one ($2,100) in March 2024. TradingView says this points to new record highs ahead!
- A cup-and-handle pattern hints at a breakout past $2,400.
- Strong support holds at $2,300 against resistance at $2,500.
- The 50-day and 200-day EMAs stay in a bullish setup.
- RSI at 65 shows good momentum, not overbought (that’s above 70).
- MACD shows growing positive bars in its histogram.
Trading volume tops 200,000 ounces daily on COMEX futures. The COT report shows bullish bets, confirming the upward push.
CFA Institute studies reveal golden crosses succeed 70% of the time historically. Exciting stats for gold fans!
| Signal | Interpretation | Example |
|---|---|---|
| Golden Cross | Bullish trend reversal | 50-day MA exceeds 200-day MA |
| Cup-and-Handle | Continuation pattern | Breakout above $2,400 |
| RSI | Momentum indicator | 65 (bullish, not overbought) |
| MACD | Trend strength measure | Positive histogram expansion |
| Volume | Confirmation factor | Exceeds 200,000 oz/day |
Act now! Buy gold on a dip to $2,300 support. Aim for $2,500 and lock in gains.
Expert Forecasts and Risks
Experts have varying views on gold prices.
- Interest rate hikes could add a 5% risk premium.
- Stock market booms or Bitcoin jumps might pull money away if no recession hits.
- Sudden increases in gold supply could surprise the market.
Spot your chance at $2,300 support! It’s a great entry for long-term gold holds.
| Firm | Target | Timeline | Rationale |
|---|---|---|---|
| Goldman Sachs | $2,700 | End-2025 | Rate cuts, ETF inflows |
| UBS | $2,800 | 2026 | 20% central bank buying growth |
| JPMorgan | $2,500 | 2025 | Moderate inflation |
| Citi | $2,000 | 2025 | 10% dollar strengthening correction |