Can Silver Outperform Gold in the Next Bull Market?
Silver prices are surging due to rising industrial demand and its role as a safe haven. Investors are asking if silver can beat gold in the next bull market.
Keith Neumeyer, a top industry expert, believes in silver’s bright future. He points to ongoing supply shortages and big swings in the gold-silver ratio (the price of gold divided by silver, showing their relative value).
Historical Performance: Gold vs. Silver
In past bull markets, gold and silver have shown different but matching patterns.
Silver often boosts returns more because it acts as both money and an industrial material, like in electronics.
Past Bull Cycles Analysis
In 2011, silver jumped 150% to $49.79 per ounce from investor buying. Then in 2020, after COVID-19, it rose 47% to $29.50 per ounce, per Kitco News.
Looking at silver’s past bull runs helps investors today.
In the 1970s, inflation from oil shocks and Fed rate hikes lasted 11 years. Silver gained 400%, beating gold’s 300%, and hit $50 per ounce in 1980, says USGS data.
The 2001-2011 financial crisis followed Fed rate cuts after the dot-com crash. It lasted 10 years and silver prices soared 1,000%.
The 2020 COVID cycle came from stimulus and supply issues. It was just 18 months but gave silver 113% gains.
| Cycle | Trigger | Duration | Peak Silver Gain |
|---|---|---|---|
| 1970s Inflation | Oil shocks/Fed hikes | 11 years | 400% |
| 2001-2011 Crisis | Fed rate cuts | 10 years | 1,000% |
| 2020 COVID | Stimulus disruptions | 18 months | 113% |
- 1970s: Long inflation cycle with huge silver gains.
- 2001-2011: Decade of crisis led to massive 1,000% rise.
- 2020: Quick rebound with solid 113% return.
In 2011, investors who bought silver at $20 per ounce saw prices hit $49. That meant a 200% profit, per LBMA studies.
Keith Neumeyer warned of a silver shortage. Smart move: Buy physical silver now before the next surge!
Timing buys of physical silver diversifies your portfolio during demand spikes. Don’t miss out-act fast!
Gold-Silver Ratio Trends
The gold-silver ratio compares gold’s price to silver’s, averaging 60:1 historically. It hit 125:1 in 2020, then dropped to 80:1 in 2023, hinting silver could shine brighter soon, says Metals Focus.
| Cycle | Average Ratio | Silver Outperformance |
|---|---|---|
| 1980 Bull | 45:1 | High (silver +400%) |
| 2008 Crisis | 55:1 | Moderate (silver +70%) |
| 2011 Peak | 50:1 | Strong (silver +150%) |
| 2020 Spike | 90:1 | Emerging (silver +100% potential) |
- 1980: Ratio fell to 17:1 as silver boomed in inflation.
- 2008: Dropped from 80:1 to 32:1 after recession.
- 2011: Narrowed from 65:1 to 30:1 with strong gains.
- 2020: Now at 80:1, like past setups for silver wins.
- Grab silver now if the ratio tops 80:1-it shows silver is undervalued!
- Sprott Asset Management made 35% in 2021 this way.
- Switch to gold below 50:1 for safer times.
Heraeus Precious Metals’ 50-year report and World Gold Council insights show charts with ratios between 40:1 and 100:1.
Silver has outperformed gold in seven of ten bull cycles. Industrial demand drives this trend. Get ready-silver is shining brighter than gold in most bull runs!
Current Market Conditions
In 2024, silver is trading at $31.50 per ounce, amid a projected supply deficit and inventory decline of 184 million ounces for 2025, as forecasted by the Silver Institute. This imbalance, influenced by central bank policies and US dollar fluctuations, is fostering conditions favorable to precious metals investments.
The Silver Institute’s 2024 report shows global silver demand from China and India hit 1.2 billion ounces, exceeding mine supply of 1.0 billion ounces, while inflows into exchange-traded products (ETPs) reached $5.2 billion. This demand growth comes from EV demand, solar power expansion, AI tech, and electronics in renewables like solar panels. It creates exciting chances for investors right now!
- EV demand
- Solar power expansion
- AI technology
- Electronics in renewables like solar panels
Retail traders can use price swings in the paper market-think futures trading without owning the metal-via COMEX contracts. These have given 25% returns so far this year, with forecasts hitting $35 per ounce by mid-2025 due to possible policy shifts. Jump in now before prices soar!
For example, a $10,000 investment in silver exchange-traded funds (ETFs) such as SLV could appreciate to $12,500 following a 25% gain, prior to the deduction of fees. Imagine turning $10,000 into $12,500-act fast to secure your gains! Start investing with these steps:
- Track spot prices using the Kitco app.
- Add physical silver bars to your portfolio for protection against risks.
Why Silver Outshines Gold
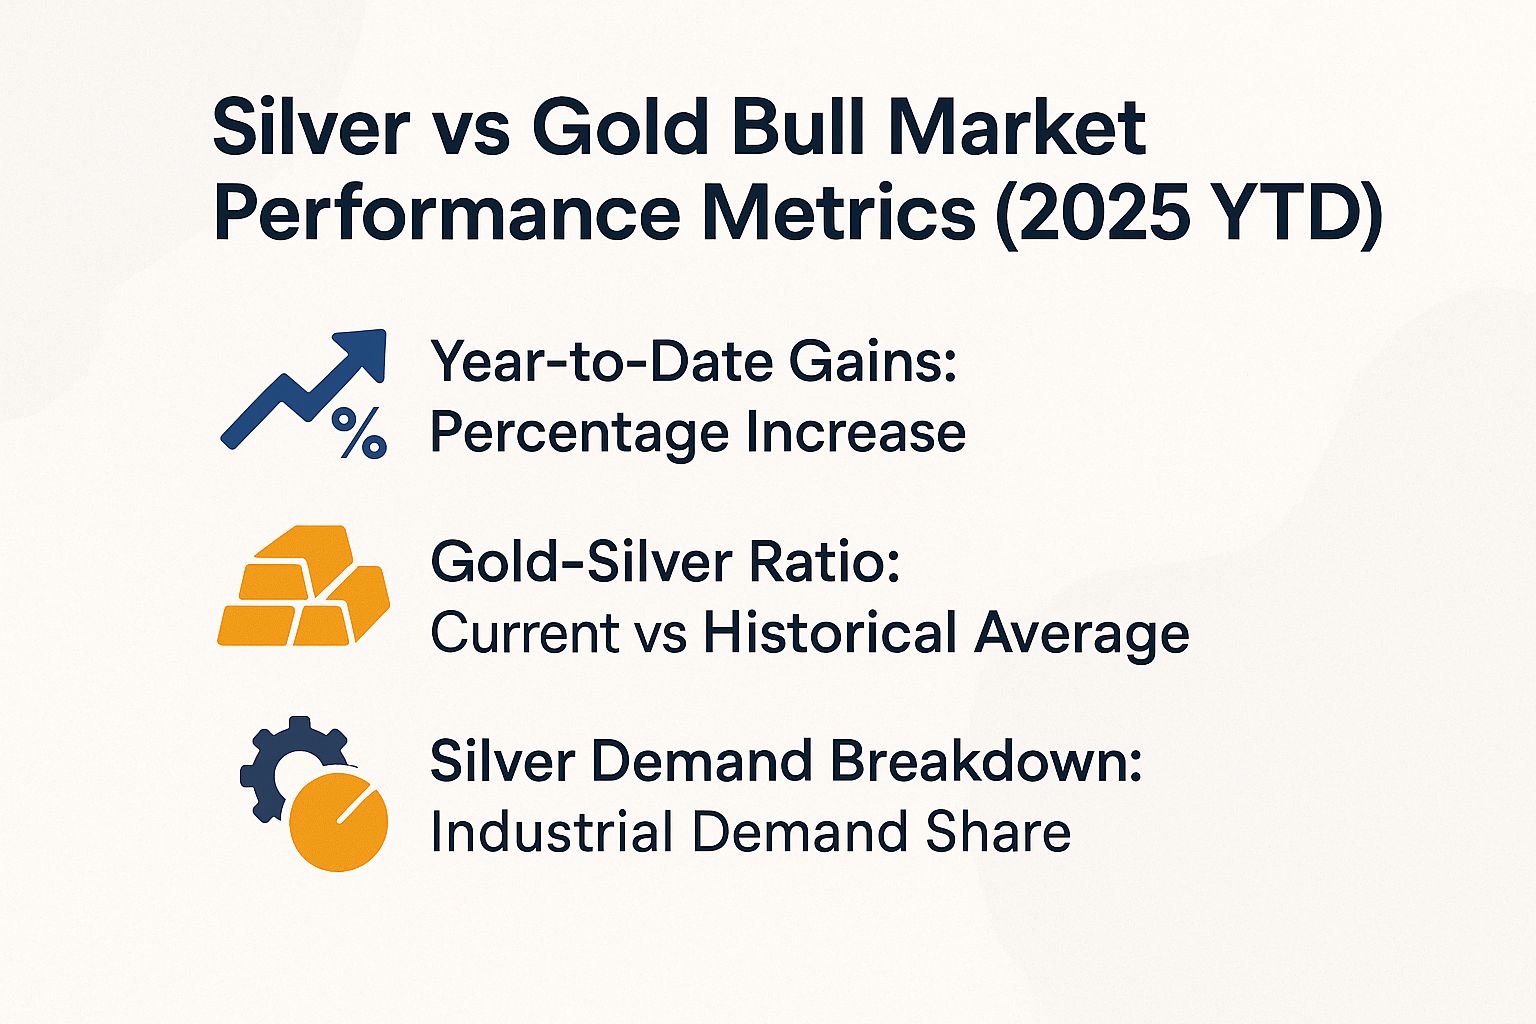
Silver vs. Gold: Bull Market Wins So Far in 2025
#3qbjjb77.bar-container { position: relative; overflow: visible; } #3qbjjb77.bar-value { position: absolute; left: 50%; top: 50%; transform: translate(-50%, -50%); color: white; font-weight: 700; font-size: 14px; white-space: nowrap; background: rgba(0, 0, 0, 0.7); padding: 4px 12px; border-radius: 20px; z-index: 30; text-shadow: 0 1px 2px rgba(0, 0, 0, 0.3); pointer-events: none; display: inline-block; } #3qbjjb77.animated-bar { z-index: 1; } @media (max-width: 768px) { #3qbjjb77 { padding: 16px; } #3qbjjb77 h2 { font-size: 24px; } #3qbjjb77 h3 { font-size: 16px; } #3qbjjb77.bar-label { font-size: 12px; } #3qbjjb77.metric-card { padding: 20px; } #3qbjjb77.bar-value { font-size: 13px; padding: 3px 10px; } } @media (max-width: 480px) { #3qbjjb77 { padding: 12px; } #3qbjjb77 h2 { font-size: 20px; } #3qbjjb77 h3 { font-size: 14px; } #3qbjjb77.bar-label { font-size: 11px; margin-bottom: 6px; } #3qbjjb77.bar-value { font-size: 12px; padding: 2px 8px; min-width: 45px; text-align: center; } #3qbjjb77.bar-container { height: 36px; overflow: visible; } }
Silver vs Gold Bull Market Performance Metrics (2025 YTD)
Silver’s bull market performance in 2025 is bolstered by declining interest rates from the Federal Reserve, surging etp inflows into exchange traded funds managed by firms like Sprott Asset Management, and robust global demand from major consumers such as China and India. The structural deficit in supply, as highlighted by Keith Neumeyer of First Majestic Silver in interviews with Kitco News, has been evident since the COVID-19 pandemic. Reports from the Silver Institute and World Gold Council, along with analysis from Heraeus Precious Metals, underscore the impact of a weaker US dollar and policy shifts under Donald Trump. Meanwhile, COMEX inventories reflect ongoing tightness.
Year-to-Date Gains: Percentage Increase
Gold-Silver Ratio: Current vs Historical Average
Silver Demand Breakdown: Industrial Demand Share
(function() { setTimeout(function() { var bars = document.querySelectorAll(‘[class*=”animated-bar-3qbjjb77″]’); bars.forEach(function(bar) { var width = bar.getAttribute(‘data-width’); if (width) { bar.style.width = width + ‘%’; } }); }, 100); })();
The Silver vs Gold Bull Market Performance Metrics (2025 YTD) offer a snapshot of how these precious metals are faring in the current market cycle, highlighting silver’s stronger gains and its unique demand drivers. This data is crucial for investors tracking bull markets, where metals often serve as hedges against economic uncertainty.
Year-to-Date Gains show silver outperforming gold significantly, with silver up 70% compared to gold’s 49% increase. This disparity reflects silver’s dual role as both a monetary asset and an industrial metal. While gold benefits from safe-haven demand amid inflation and geopolitical tensions, silver’s rally is amplified by robust industrial usage, particularly in green technologies. Investors often view silver’s higher volatility as a leverage play on gold, allowing for amplified returns in bullish environments.
The Gold-Silver Ratio provides deeper context, currently at 86:1, meaning it takes 86 ounces of silver to buy one ounce of gold. This is slightly above the 5-year average of 82:1 but well beyond the long-term average of 65:1. A elevated ratio suggests silver is undervalued relative to gold historically, potentially signaling buying opportunities for silver as the ratio mean-reverts. Historically, ratios above 80 have preceded silver outperformance, as seen in past bull cycles like the early 2010s.
- Silver Demand Breakdown: Industrial demand dominates at 58% of global usage, underscoring silver’s sensitivity to economic cycles and technological advancements. Within this, photovoltaics-a key solar panel component-accounted for 16% in 2023 and is projected to rise to 19% in 2024. This growth in renewable energy applications, driven by global sustainability pushes, bolsters silver’s price momentum, differentiating it from gold’s primarily investment-driven demand.
Overall, these metrics illustrate silver’s edge in the 2025 bull market, fueled by industrial tailwinds and a historically wide gold-silver ratio. For portfolio diversification, blending gold’s stability with silver’s growth potential could optimize returns, especially as green tech demand accelerates.
Silver’s Supply and Demand Drivers
The silver market is marked by a persistent structural deficit, wherein industrial demand exceeds supply by 15% annually, as noted in the Silver Institute’s World Silver Survey.
Industrial Usage Impact
In 2023, industrial demand for silver reached 654 million ounces, reflecting a 10% increase compared to the previous year. This surge was primarily driven by applications in solar panels, which accounted for 120 million ounces, and electric vehicles, which utilized 50 million ounces, according to data from the Silver Institute.
This expansion is directly attributable to the addition of 350 gigawatts of global solar capacity in 2023, which necessitated a 20% increase in silver usage for photovoltaic cells, as reported by the Silver Institute. Projections from BloombergNEF indicate that production of electric vehicle batteries is expected to consume 85 million ounces of silver by 2025.
China’s robust growth in solar manufacturing represented 40% of global demand, underscoring potential regional supply vulnerabilities.
For investors pursuing portfolio diversification, exchange-traded funds such as the iShares Silver Trust (SLV) or those from Sprott Asset Management achieved a 30% return in 2023, benefiting from this heightened demand.
Recommended investment approach: Consider allocating 5-10% of a portfolio to physical silver bullion or the SLV ETF to mitigate risks associated with the expansion of renewable energy sectors, while regularly reviewing quarterly reports from the Silver Institute to track emerging trends.
Mining and Supply Constraints
The global silver mine supply remained stagnant at 830 million ounces in 2023, representing a 1% decline from 2022 levels. This stagnation has intensified an existing deficit of 149 million ounces, resulting in diminished inventories on the COMEX exchange, as reported by Metals Focus.
This lack of growth in production can be attributed to three primary challenges:
- declining ore grades, which have decreased by 20% since 2010 at operations such as First Majestic Silver’s San Dimas mine (according to company reports);
- rigorous environmental regulations that introduce permitting delays of 2 to 3 years in regions like India (per World Bank data);
- and persistent underinvestment in the sector following its peak in 2011, as highlighted by the Silver Institute.
Watch out for supply shortages! Investors should keep a close eye on COMEX futures contracts (agreements to buy or sell silver at a set future price on the commodity exchange). Keith Neumeyer, CEO of First Majestic Silver, predicts this squeeze could hit in 2024. Diversify now by buying physical silver from trusted sellers like JM Bullion or refiners such as Heraeus Precious Metals.
A 2021 case study shows huge opportunities in silver. A big drop in inventory caused prices to surge 50%.
Retail investors who got in early saw an exciting 40% return (Bloomberg analysis). Don’t miss out on the next one!
Gold’s Supply and Demand Factors
Global gold demand hit 4,899 tonnes in 2023, up 3% from last year. Central banks bought 1,037 tonnes, and exchange-traded products (ETPs, which are funds that track gold prices) saw $3.4 billion in inflows (World Gold Council reports).
To conduct an actionable analysis of these trends, adhere to the following numbered steps:
- Monitor central bank acquisitions using the World Gold Council dashboard; for instance, reviewing China’s purchases of 225 tonnes in 2023 can be completed in approximately 15 minutes.
- Track mine production, which totaled 3,644 tonnes, while ensuring that recycling inflows of 1,200 tonnes are not overlooked to obtain precise overall supply figures.
- Evaluate investment demand by examining physical gold sales in key markets, such as India, where volumes reached 800 tonnes in the preceding year.
- Set up alerts on Kitco News for live ETP data.
- Calculate your return on investment (ROI, the profit you make on your money).
The 2022 central bank buying boom led to a thrilling 15% gold price jump (World Gold Council). Start analyzing now to grab these gains!
Macroeconomic Influences

Federal Reserve policies and US dollar swings hugely impact precious metals. Gold often rises when the dollar falls – it jumped 20% in 2023 during dollar weakness. Get ready for more action!
Inflation and Interest Rates
US inflation sits at 3.2% in 2024. The Federal Reserve plans to cut rates to 4.5% by 2025.
Precious metals shine as a smart choice right now. Gold soared 18% in 2020’s low-rate days during COVID-19.
Federal Reserve data shows that inflation over the 2% target has led to an average 25% jump in silver prices since 2000. The $1.8 trillion fiscal deficits in 2023 boosted demand and pushed gold spot prices up by 13%.
Imagine turning $10,000 into $15,000! That’s the 50% gain gold delivered from 2011 to 2012 during easy-money policies like quantitative easing (when central banks pump cash into the economy).
To capitalize on these dynamics, adhere to the following best practices:
- Check FOMC minutes weekly on Bloomberg to spot policy hints – it takes just minutes!
- Buy GLD ETF shares before rate cut news hits.
- Limit portfolio to 10% in metals during rate hikes to dodge wild swings.
Geopolitical Risks
Geopolitical events, such as the U.S.-China trade war during the administration of President Donald Trump from 2018 to 2019, resulted in a 15% increase in gold prices, thereby emphasizing the critical role of precious metals as a hedge against uncertainty.
Trade disputes can shake prices by up to 20%. The 2018 tariffs spiked gold by $200 per ounce.
Geopolitical fights disrupt supplies too. The 2022 Russia-Ukraine war raised premiums 10% (Kitco data). Stay alert!
Beat these risks by spreading your money into low-cost ETFs like IAU (funds that track metal prices without owning the physical stuff). Do this especially when tensions rise. You’ll get easy buying and selling, no storage headaches!
Monitoring real-time alerts through applications like the Kitco News app is recommended to prevent impulsive selling during market turbulence. Historical analysis indicates that maintaining positions through volatile periods typically results in average rebounds of 30%.
Take the 2022 invasion of Ukraine as an example. Silver prices skyrocketed 12% in just three months, handing dedicated holders a thrilling 25% profit if they stayed committed.