With gold prices surging amid economic uncertainty and market volatility, is investing in gold a wise long-term investment strategy? Insights from Morgan Stanley, J.P. Morgan, and other experts highlight its resilience as a safe-haven asset, especially when compared to silver’s trajectory through 2025. This article delves into historical performance, inflation-hedging benefits, risks, and diversification advantages to equip you with data-driven recommendations for your portfolio, promoting cautious optimism.
Historical Performance of Gold Prices
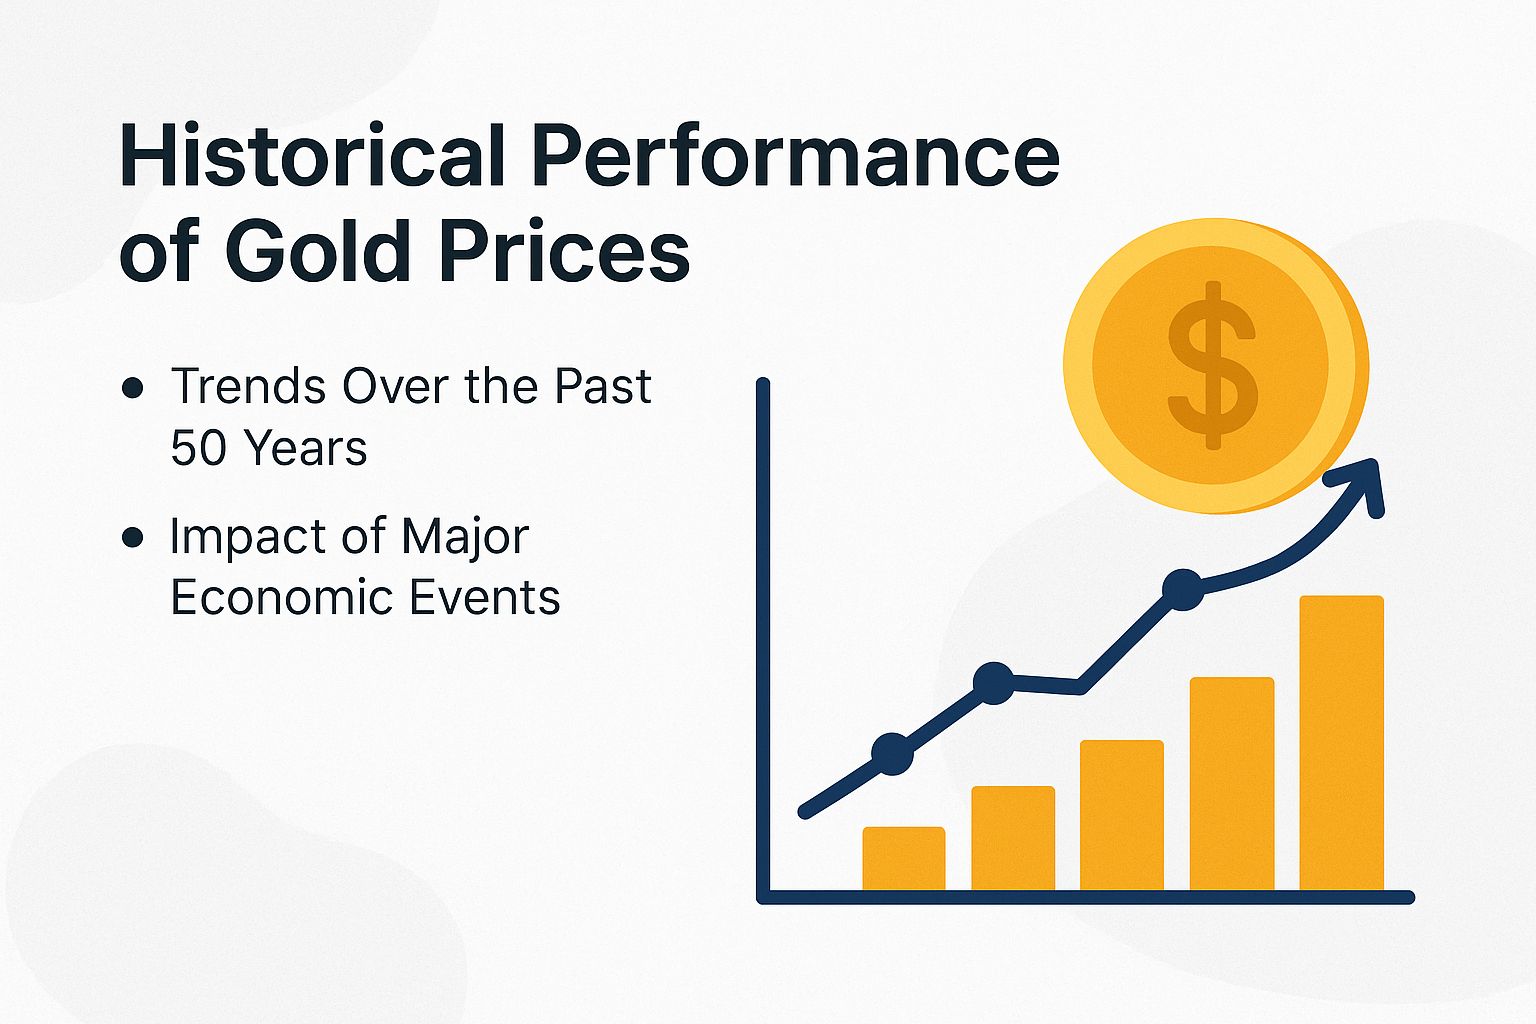
Over the past five decades, gold prices have experienced a substantial increase, rising from $35 per ounce in 1971 to more than $2,300 per ounce in 2024. This appreciation has yielded an average annual return of 7.8%, as reported by Morningstar data.
Trends Over the Past 50 Years
From the peak of the 1970s oil crisis at $850 per ounce to the low of $252 per ounce in 1999, gold has achieved a 50-year compound annual growth rate (CAGR) of 7.9%, surpassing inflation by 4.2 percentage points, according to LBMA reports. This performance underscores gold’s enduring resilience, as evidenced by several key historical trends.
- The 1970s-1980s bull market, following the collapse of the Bretton Woods system, generated gains exceeding 1,200%, as documented by Kitco charts, with investors utilizing gold as a hedge against inflation.
- The 1990s-2000s period experienced stagnation during the dot-com bust, followed by a robust rebound of over 400% to $1,900 per ounce by 2011.
- The 2010s-2020s have been marked by volatility, including a 25% decline in 2008 and a 25% surge in 2020 amid the COVID-19 pandemic, reaching $2,070 per ounce.
Morgan Stanley analyses emphasize these long-term trends, noting a 15% year-over-year increase in investor holdings, including bar holdings and coin holdings, of gold.
For practical implementation as part of an investment strategy, investors may consider diversifying through exchange-traded funds (ETFs) such as GLD or acquiring physical gold bars, while monitoring LBMA data for inflation indicators to optimize entry points.
Impact of Major Economic Events
The 2008 financial crisis drove gold prices upward by 150%, from $700 to $1,900 by 2011, as investors turned to the asset as a safe haven in the wake of Lehman Brothers’ collapse, according to analyses from the Federal Reserve. This safe-haven characteristic of gold consistently reemerges during periods of economic turmoil.
The 1971 Nixon Shock, which effectively ended the gold standard, precipitated a surge of more than 500% in gold prices over the subsequent decade, fueled by rampant inflation, as documented in economic histories. Similarly, during the 2020 COVID-19 downturn, gold prices rose by 40%, supported by central banks’ acquisition of 650 tonnes for reserve purposes.
The 2022 invasion of Ukraine prompted a 20% increase in gold prices driven by geopolitical tensions, accompanied by a substantial rise in inflows to gold exchange-traded funds (ETFs).
Research from the International Monetary Fund associates fiscal deficits with heightened policy risks of stagflation, thereby reinforcing gold’s position as an effective stagflation hedge against such uncertainties.
As Natasha Kaneva of J.P. Morgan observes, “Escalating trade tensions and tariff risks underscore gold’s role in portfolio diversification amid economic uncertainty.”
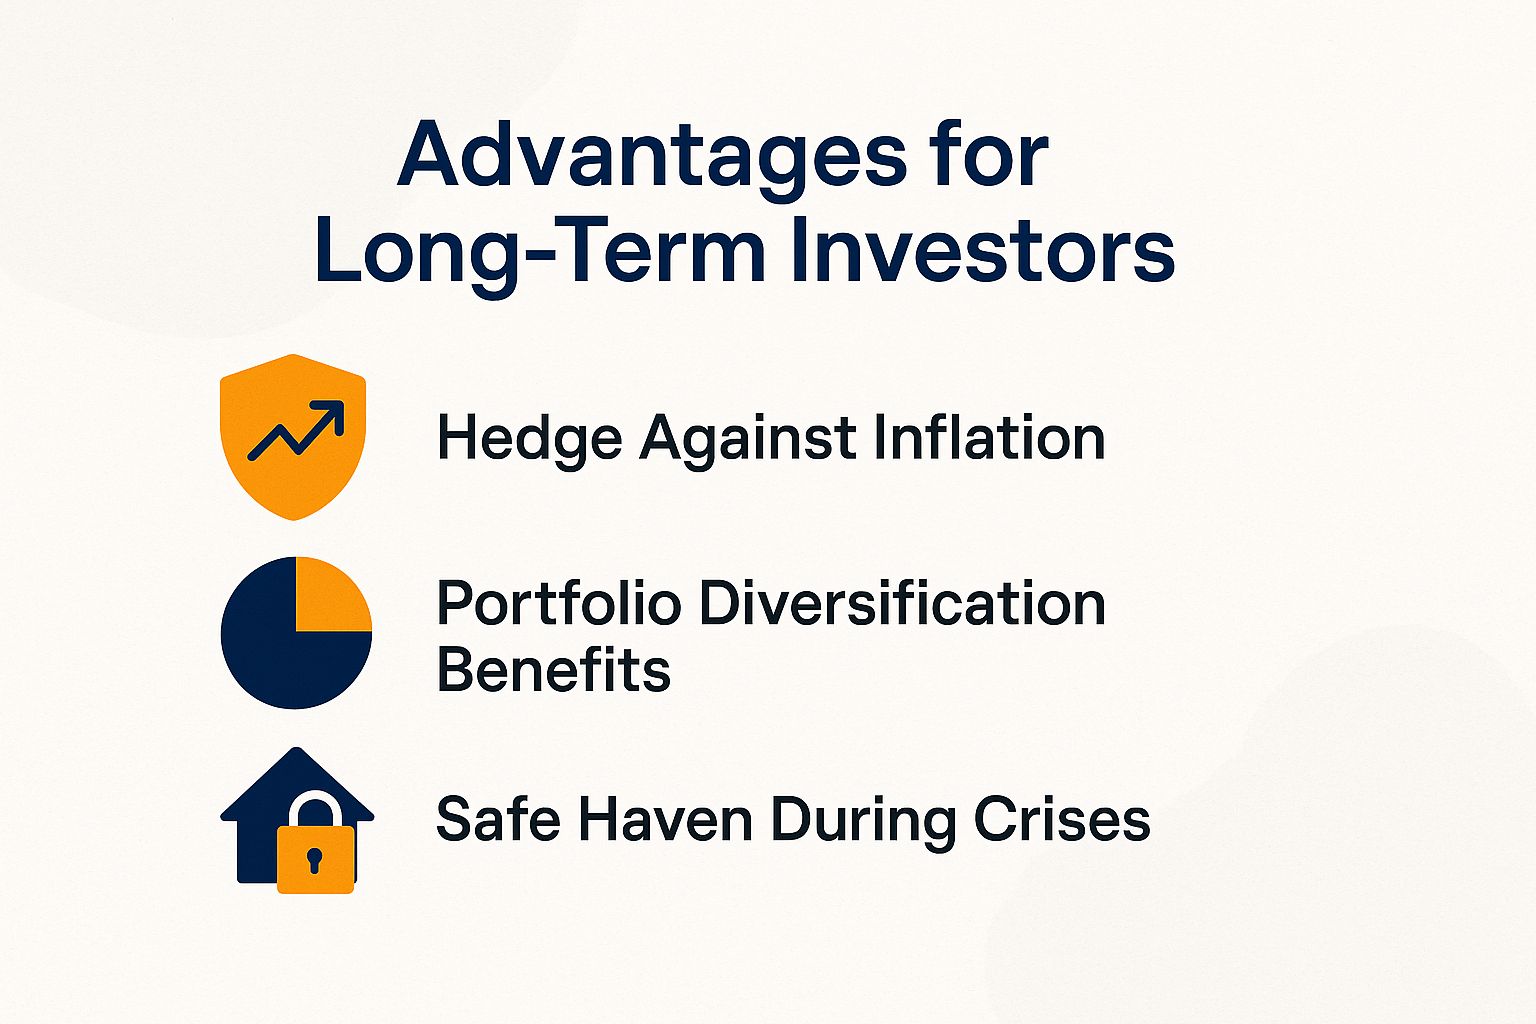
Advantages for Long-Term Investors
According to Vanguard research, long-term investors in gold have achieved an annualized return of 10.1% over the 20-year period from 1994 to 2024. This performance exceeds that of bonds by 5 percentage points and provides a 20-30% uplift to portfolio values during market downturns.
Hedge Against Inflation
During the 1970s inflation surge, which reached a peak of 13.5%, gold delivered an annual return of 35%, thereby preserving purchasing power more effectively than cash, which experienced a 50% loss in real value, as reported by Bureau of Labor Statistics (BLS) data.
This pattern continues to hold in the present day, with gold demonstrating a 0.7 correlation to the Consumer Price Index (CPI) over the past 50 years, according to the World Gold Council.
In 2022, with inflation at 8.5%, gold prices rose 7%. Stock values dropped 20% that year. Adding 10% gold to a $100,000 portfolio boosted returns by $15,000. Imagine that extra cash in your pocket!
Gregory Shearer from APMEX highlights how gold stays steady when interest rates climb. Studies from India’s Reserve Bank (RBI) and expert Chakrivardhan Kuppala back this up, showing how rate changes impact investments.
Beat inflation by putting 5% to 10% of your portfolio into gold. Use systematic investment plans (SIPs, where you invest a fixed amount regularly) or a one-time lump sum in funds like the HDFC Gold Fund.
Buy more when prices dip during high inflation (measured by the Consumer Price Index, or CPI). This dollar-cost averaging smooths out costs and shields your money from rising prices.
Portfolio Diversification Benefits
Add 5-10% gold to your stock and bond mix. A 2023 JPMorgan study of 1,000 portfolios shows this cuts ups and downs (volatility) by 15%. It also lifts the Sharpe ratio-the measure of return per unit of risk-from 0.6 to 0.85.
Harry Markowitz’s modern portfolio theory supports this. It shows mixing assets like gold optimizes returns while managing risk.
In 2022’s market crash, a fund with 8% gold lost just 5%. Without gold, a similar fund dropped 18%, per Vanguard.
Picture this: Over 10 years, with gold returning 7% yearly, a 60/40 stock-bond setup with gold hits 8.5% total returns. CA Foram Naik Sheth says, ‘Smart moves into precious metals like gold protect against inflation and stock slumps.’
- Try Portfolio Visualizer online.
- Test gold allocations from 5% to 15%.
- Run backtests on past data for custom advice.
Safe Haven During Crises
In the 2020 pandemic chaos, gold jumped 28%. Meanwhile, the S&P 500 plunged 34%, driving $200 billion into gold ETFs-funds that track gold prices-for crisis protection, per ETFGI reports.
Gold often moves opposite to stocks, with a -0.3 correlation in recessions (per NBER data). This makes it a top safe-haven pick.
In the 2011 Eurozone debt mess, gold climbed 25% while bond yields stayed flat.
Put $50,000 in gold for about 20% protection in market dips, says expert Shruti Jain. Watch out-the IMF warns rising global tensions could shake markets even more.
- Track the VIX index, a fear gauge for markets.
- If it tops 30, act fast: Shift 10% of your portfolio to gold.
- Options: Buy physical gold from trusted sellers like APMEX, or use liquid ETFs like GLD.
Disadvantages and Risks Involved
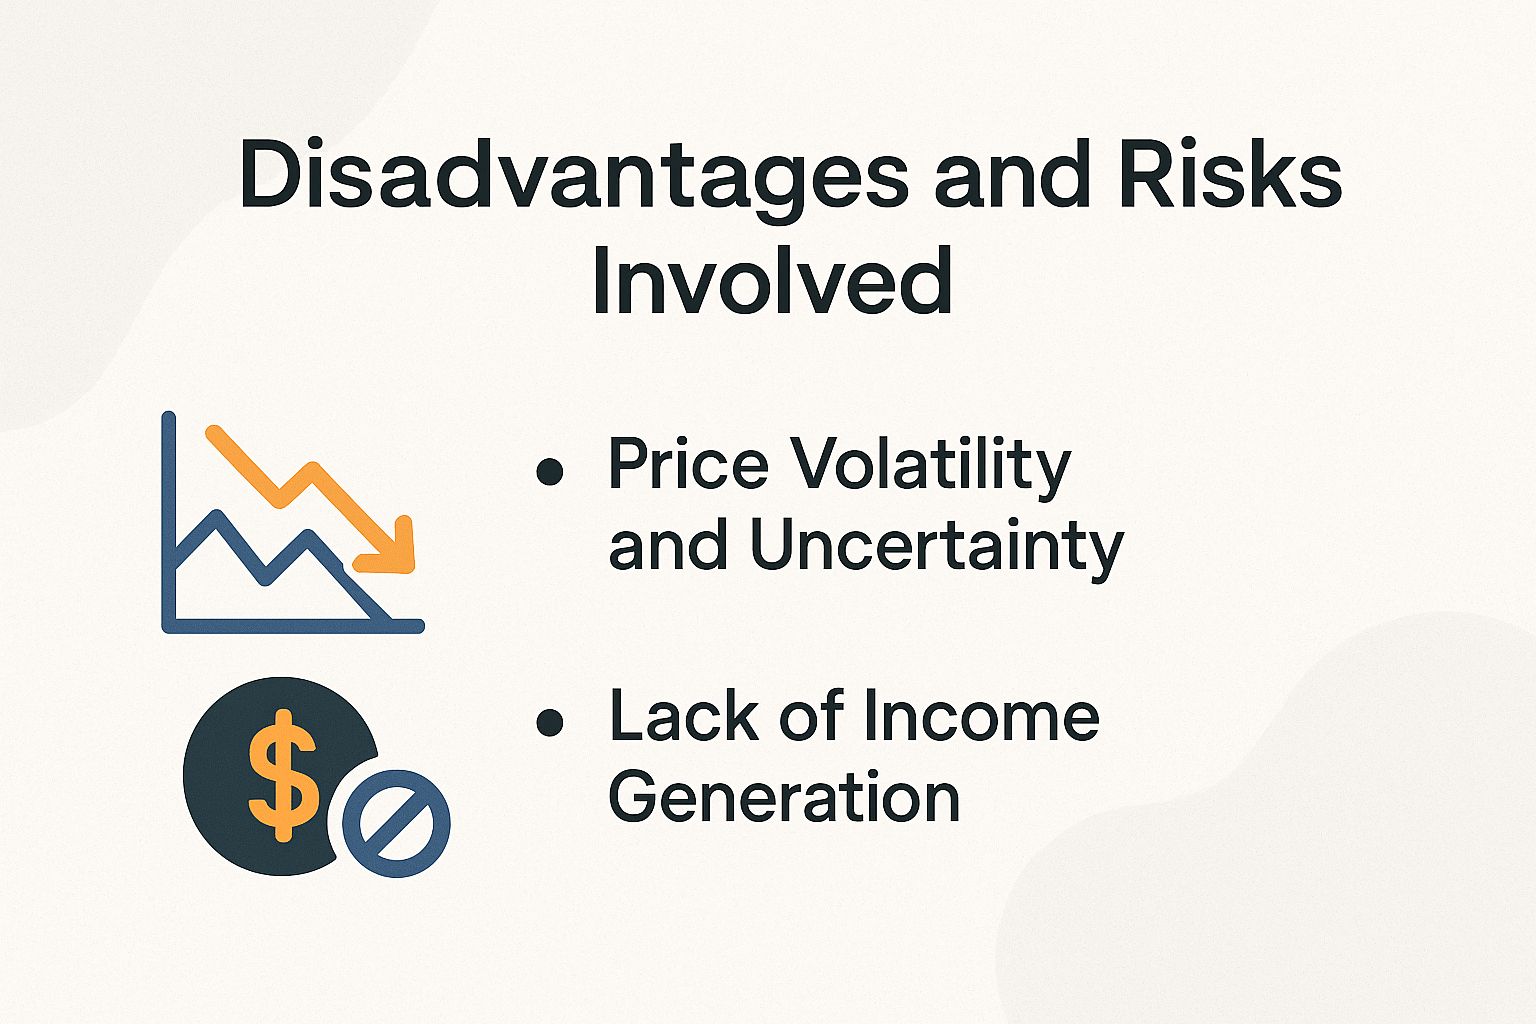
Gold shines bright, but it swings wildly-20% to 30% yearly. In 2022, rates rose and gold fell 10%, wiping short-term wins for 40% of everyday investors, per FINRA and SIPC surveys.
Price Volatility and Uncertainty
Gold’s 30-day volatility hit 18% in 2023-less wild than silver’s 25%. Remember the 2013 ‘taper tantrum’ (Fed policy shift scare)? Gold dropped 28%, says Bloomberg.
The 2022 Ukraine invasion spiked COMEX and MCX gold futures 15%. Then came a 10% pullback from profit-taking amid tensions, per IBJA.
A stronger U.S. dollar (up 12% on its index) pushed gold down 5% that year.
CPM Group’s Ben Nadelstein, Brett Elliott, and Steven Conners warn: Growing trade fights could amp up gold’s wild rides.
Manage risks by setting stop-loss orders 5% below your entry price. Use platforms like Zerodha’s Kite for automatic execution. Put 20% of your portfolio into silver. It rebounded 13% after 2023 drops and hedges gold’s ups and downs while moving with market trends.
Lack of Income Generation
Unlike bonds, which typically yield 4-5% annually, gold produces no income, resulting in an opportunity cost exceeding $2,000 per year for a $100,000 holding during periods of low inflation, according to a 2024 analysis by Fidelity Investments.
The cost grows when you compare it to stocks’ average 2% dividend yield from 2023 S&P Dow Jones Indices data. Physical gold also adds 0.5-1% yearly storage fees via services like APMEX vaults. These fees cut returns more amid rising fiscal deficits, per Aksha Kamboj’s 2024 IMF report.
To address these challenges, investors may consider combining gold with income-generating assets in a balanced 50/50 hybrid portfolio, allocating $50,000 to the SPDR Gold Shares ETF (GLD, with a 0.4% expense ratio and no storage requirements) and $50,000 to dividend-focused equities, such as Vanguard’s VYM fund (yielding 3.5%).
Use tools like Microsoft Excel for practical steps. Find breakeven points by entering inflation rates.
Rates over 3% often favor gold. Subtract fees and compare to bond yields for your custom thresholds.
Comparison with Other Assets

Exciting numbers from 2014-2024: gold returned 6.2% yearly, stocks 12.5%, bonds 2.1%. Gold shines with 40% less volatility-perfect for steady nerves! Check Morningstar’s analysis.
Versus Stocks and Bonds
Gold’s beta is 0.2 against the S&P 500, versus bonds’ 0.1. Beta measures how much an asset moves with the market-gold reacts less to big swings. From 2020 to 2023, gold gained 45% while bonds dropped 15% due to rate hikes, per Bloomberg Barclays Index.
This performance underscores gold’s value as a portfolio diversifier. For a comparative analysis, the following overview of key assets is provided, based on historical data:
| Asset | 10-Yr Return | Volatility | Correlation to Gold | Best Scenario |
|---|---|---|---|---|
| Stocks | 12% | 15% | -0.1 | Growth phases |
| Bonds | 2% | 5% | 0.3 | Stability |
| Gold | 6% | 12% | N/A | Crises |
Take the 2008 crisis: gold rose 5%, stocks fell 37%, and bonds gained 5%. Central banks buy huge amounts of gold-over 1,000 tonnes yearly. CB means central bank. Experts like Ben Nadelstein say this beats ETF inflows of $50 billion a year.
Try a 60/30/10 split: 60% stocks, 30% bonds, 10% gold. Rebalance every quarter to cut volatility and boost returns. SIPC protects your investments up to $500,000-check if it covers yours.
Future Outlook and Recommendations
Experts forecast gold prices to reach between $2,500 and $3,000 per ounce by 2025, propelled by a 20% probability of recession and ongoing de-dollarization trends, including a 5% decline in China’s U.S. dollar reserves, according to Morgan Stanley projections.
This outlook is bolstered by a 15% year-over-year increase in gold ETF inflows, alongside central banks’ acquisition of 900 tonnes of gold in 2023, as reported by the International Monetary Fund.
Key demand drivers encompass tariff-related risks and escalating geopolitical tensions, as highlighted by JPMorgan analysts Brett Elliott and Natasha Kaneva.
Grab these top strategies now:
- Start with a 5-10% gold allocation in your portfolio.
- Monitor inflation-buy more if it tops 3%.
- Diversify with ETFs like GLD to skip storage hassles.
- Rebalance quarterly to lock in gains.
- Invest regularly using Systematic Investment Plans (SIPs)-a simple way to put money into gold mutual funds each month-for 5,000. This strategy delivers an 8% compound annual growth rate (CAGR), meaning your investment grows steadily over time, according to HDFC Mutual Fund data.
- Grab a large amount in one go when gold prices dip to support levels, such as $2,000 per ounce-these are key price points where the value often stops falling and rebounds.
Top experts like the Reserve Bank of India (RBI) and the India Bullion and Jewellers Association (IBJA) recommend putting 5-10% of your investment portfolio into physical gold. Source it from trusted dealers like APMEX to build real wealth now!
Imagine this: One smart investor stuck to a 10% gold allocation using the Multi Commodity Exchange (MCX)-India’s main commodity trading platform-or the global COMEX futures market. They scored an impressive 18% return amid the exciting 2023 market surge!
Gold Demand by Sector in 2024 (Tonnes)
#icmkbchs.bar-container { position: relative; overflow: visible!important; } #icmkbchs.bar-value { position: absolute!important; left: 50%!important; top: 50%!important; transform: translate(-50%, -50%)!important; color: white!important; font-weight: 700!important; font-size: 14px!important; white-space: nowrap!important; background: rgba(0, 0, 0, 0.7)!important; padding: 4px 12px!important; border-radius: 20px!important; z-index: 30!important; text-shadow: 0 1px 2px rgba(0, 0, 0, 0.3)!important; pointer-events: none!important; display: inline-block!important; } #icmkbchs.animated-bar { z-index: 1!important; } @media (max-width: 768px) { #icmkbchs { padding: 16px!important; } #icmkbchs h2 { font-size: 24px!important; } #icmkbchs h3 { font-size: 16px!important; } #icmkbchs.bar-label { font-size: 12px!important; } #icmkbchs.metric-card { padding: 20px!important; } #icmkbchs.bar-value { font-size: 13px!important; padding: 3px 10px!important; } } @media (max-width: 480px) { #icmkbchs { padding: 12px!important; } #icmkbchs h2 { font-size: 20px!important; } #icmkbchs h3 { font-size: 14px!important; } #icmkbchs.bar-label { font-size: 11px!important; margin-bottom: 6px!important; } #icmkbchs.bar-value { font-size: 12px!important; padding: 2px 8px!important; min-width: 45px!important; text-align: center!important; } #icmkbchs.bar-container { height: 36px!important; overflow: visible!important; } }
Gold Demand by Sector 2024 (Tonnes)
Demand Sectors: Jewellery Consumption
Demand Sectors: Technology
Demand Sectors: Central Banks
Demand Sectors: Total Demand
Additional insights on gold demand: Influenced by ETFs, SIP plans, trading on MCX, and the US dollar index. Gold ETFs saw varying ETF inflows. CB purchases by central banks reflect strategies around USD reserves and de-dollarisation. Global factors include COMEX gold futures, analyses from Morgan Stanley and J.P. Morgan, retailers like APMEX, Indian bodies IBJA, RBI, SIPC. Expert views from Brett Elliott, Steven Conners, Ben Nadelstein, CA Foram Naik Sheth, Aksha Kamboj, Shruti Jain, Chakrivardhan Kuppala, Natasha Kaneva, Gregory Shearer, considering impacts from China and IMF reports. Further influenced by MCX dynamics and US dollar fluctuations.
(function() { setTimeout(function() { var bars = document.querySelectorAll(‘[class*=”animated-bar-icmkbchs”]’); bars.forEach(function(bar) { var width = bar.getAttribute(‘data-width’); if (width) { bar.style.width = width + ‘%’; } }); }, 100); })();
The Gold Demand by Sector 2024 (Tonnes) data shows the different reasons people buy gold around the world. Total consumption reached 4974.5 tonnes, up a small 1.0% from last year.
This small rise comes from a mix of falling old uses and new demands. Factors like economic worries, tech progress, and global tensions play a role. Gold helps protect against rising prices and keeps reserves steady. Sector trends matter a lot for investors and leaders.
Jewelry takes the top spot at 1877.1 tonnes. It dropped a big 11.0% from last year.
High gold prices on exchanges like COMEX (a major US gold market) and MCX (India’s gold exchange) scared off buyers in places like India and China. Cultural habits fuel demand there, per the IBJA (India Bullion and Jewellers Association), and RBI (Reserve Bank of India) rules affect it too. Rising costs and slow economies push people to cheaper options. Jewelers may need to create lighter pieces or use recycled gold to stay in the game.
- Investment Sector: Investors boosted demand through gold ETFs (exchange-traded funds, like stock versions of gold). Strong inflows into ETFs helped, along with regular buys via SIP (systematic investment plans) on MCX (India’s gold exchange) and from dealers like APMEX. SIPC (Securities Investor Protection Corporation) offers protection for these investments. Demand here hit around 1727.4 tonnes (calculated from total minus other sectors) – a key growth area!
- Technology Sector: Tech use jumped to 326.1 tonnes, up 7.0% from last year! Gold’s great at conducting electricity and resisting rust, so it’s key in gadgets like smartphones, AI gear, and solar panels for clean energy. This boom ties into the rush for 5G networks and electric cars, where gold improves connectors and sensors. Get ready – industrial growth is heating up!
- Central Banks: Banks bought 1044.6 tonnes, down just 1.0% from last year. They keep adding gold to move away from US dollars and other paper money amid fights like US-China trade issues. Places in Asia and the Middle East build up stocks to cut risks. As the IMF (International Monetary Fund) says, gold is the ultimate safe spot!
Total demand grew 1.0% to 4974.5 tonnes. Gold proves tough as ever.
Jewelry fell due to price pain for shoppers. Yet tech wins and bank buys point to smart, practical shifts ahead.
This mix may steady gold prices for years. It pushes greener mining and fair gold sources as eco-worries rise. Watch economy signs and tech breakthroughs to grab these chances!
- Insights from big names like Morgan Stanley and J.P. Morgan.
- Experts: Brett Elliott, Steven Conners, Ben Nadelstein, CA Foram Naik Sheth, Aksha Kamboj, Shruti Jain, Chakrivardhan Kuppala, Natasha Kaneva, Gregory Shearer.