As economic turbulence shakes up the investment world, gold still shines as a safe bet against inflation and market ups and downs. Stock markets hit all-time highs and cryptos like Bitcoin soar-could gold be the hidden gem that’s undervalued right now? Dive into this breakdown of gold’s historical price appreciation trends, current value, and how it stacks up against stocks, bonds, real estate, other metals, and digital coins to spot if it’s time to grab this opportunity before it vanishes.
Historical Valuation of Gold as a Tangible Asset Class
Gold’s true worth has swung wildly over the last 100 years. It jumped from $20.67 per ounce in 1934, when it was tied to the gold standard, to over $2,000 in 2023 due to falling dollar value and shaky paper money.
Supply and demand set gold’s price. Key drivers include mining output, jewelry buying, industrial needs, and central banks stocking up reserves.
Gold beats other commodities as a long-term value keeper. Smart investors check its fair price using basics like the gold-silver ratio (how gold prices compare to silver) and Dow-gold ratio (gold versus stock market index).
- Adding gold to your investment mix cuts overall risk.
- It doesn’t move in sync with wild stock swings.
Low interest rates make bonds less appealing. Gold steps up as a solid choice, even without interest payments-it grows through price rises over time.
Watch for taxes on gains and costs to store physical gold bars. Unlike real estate, gold is easy to buy and sell quickly.
Critics call it overpriced sometimes, but gold guards your buying power in crazy inflation or crashes. Bold thinkers, known as gold fans, stick with it long-term instead of chasing hot tips or quick trades that can backfire.
Key Periods of Appreciation
Get ready for a thrill-gold skyrocketed in the 1970s amid the oil shock and stock slumps. It surged 35 times over, from $35 to $850 per ounce by 1980, fueled by runaway inflation and world tensions.
Gold keeps bouncing back through recessions, crises, and global chaos-even when other investments boom. Check out these standout periods:
- 1971-1980: Nixon ended the gold standard tie, sparking a +2,300% jump as the Fed started printing more money (quantitative easing means boosting cash supply). Kitco shows a high of $850 per ounce.
- 2001-2011: Dot-com crash and 2008 meltdown drove +600% gains. The 2004 GLD ETF (a fund tracking gold prices) pulled in over $50 billion, opening doors to easy investing and bets.
- 2019-2020: COVID hit, pushing prices up 40%. Central banks bought 650 tonnes (World Gold Council data), hitting $2,067 amid fear (like the VIX index spiking).
- 2022-2023: Ukraine war tensions lifted it 25%, peaking at $2,075 per ounce (Kitco).
Look at the 1970s for proof. Experts like Jim Rogers and Peter Schiff, plus Warren Buffett’s rare bets, scored 20% yearly growth holding real gold bars during inflation storms.
They beat stocks and gold mines by 15 times (Forbes breakdown). This draws die-hard gold lovers, ignoring Wall Street doubts-don’t miss out on similar wins!
Gold’s Yearly Returns: Spotting Trends and Future Wins in Crises (1973-2024)
Imagine charting gold’s exciting path-technical analysis (studying price patterns) shows big potential ahead. Get fired up for forecasts that could change your portfolio!
Unlock gold’s hidden power as the ultimate safe haven! Dive into this chart now.
- Gold beats other investments in growth and safety during volatile markets.
- Technical analysis tracks price trends to spot opportunities.
- Fundamental analysis reviews economic factors for long-term value.
- Perfect for risky times when bonds yield little.
- Forget P/E ratios-gold is your go-to store of value!
#9y9dzatt.bar-container { position: relative; overflow: visible!important; } #9y9dzatt.bar-value { position: absolute!important; left: 50%!important; top: 50%!important; transform: translate(-50%, -50%)!important; color: white!important; font-weight: 700!important; font-size: 14px!important; white-space: nowrap!important; background: rgba(0, 0, 0, 0.7)!important; padding: 4px 12px!important; border-radius: 20px!important; z-index: 30!important; text-shadow: 0 1px 2px rgba(0, 0, 0, 0.3)!important; pointer-events: none!important; display: inline-block!important; } #9y9dzatt.animated-bar { z-index: 1!important; } @media (max-width: 768px) { #9y9dzatt { padding: 16px!important; } #9y9dzatt h2 { font-size: 24px!important; } #9y9dzatt h3 { font-size: 16px!important; } #9y9dzatt.bar-label { font-size: 12px!important; } #9y9dzatt.metric-card { padding: 20px!important; } #9y9dzatt.bar-value { font-size: 13px!important; padding: 3px 10px!important; } } @media (max-width: 480px) { #9y9dzatt { padding: 12px!important; } #9y9dzatt h2 { font-size: 20px!important; } #9y9dzatt h3 { font-size: 14px!important; } #9y9dzatt.bar-label { font-size: 11px!important; margin-bottom: 6px!important; } #9y9dzatt.bar-value { font-size: 12px!important; padding: 2px 8px!important; min-width: 45px!important; text-align: center!important; } #9y9dzatt.bar-container { height: 36px!important; overflow: visible!important; } }
Gold Annualized Returns in Selected Crisis Periods (1973-2024)
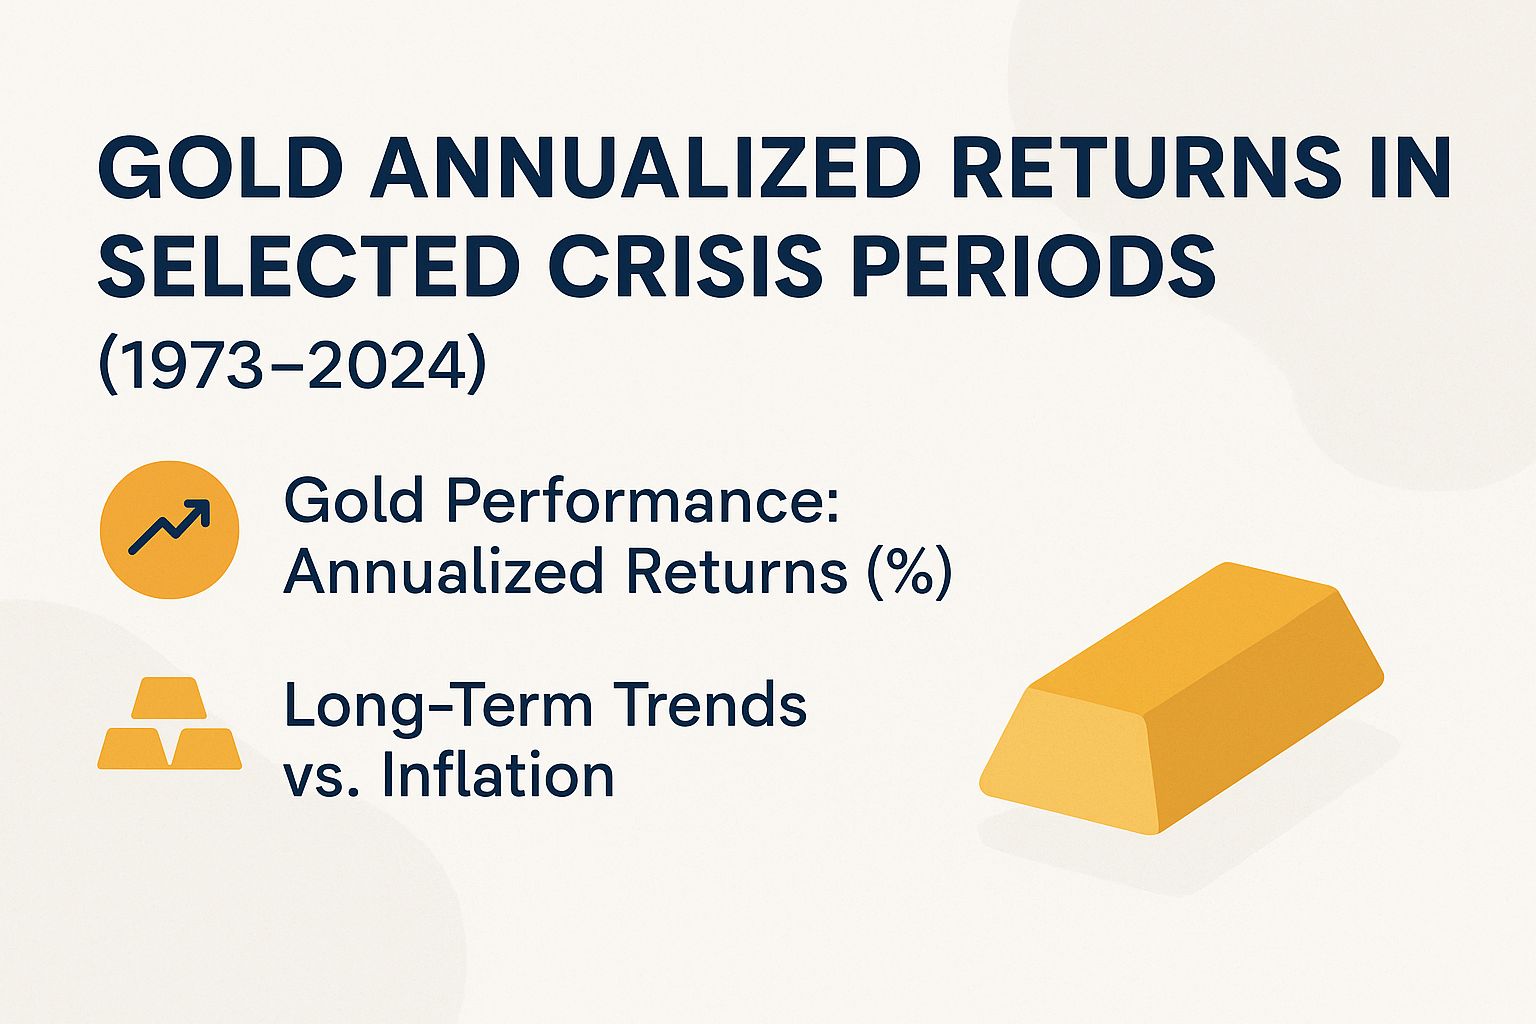
Gold Performance: Annualized Returns (%)
In times of economic turmoil, gold serves as a hedge against fiat currency devaluation, offering superior returns compared to traditional assets like the S&P 500, Dow Jones Industrial Average, and Treasury bonds influenced by Federal Reserve policies. While Warren Buffett has famously dismissed gold, Peter Schiff champions it as a contrarian investment, especially amid high P/E ratios and low dividend yields in equities. Even against modern alternatives like Bitcoin and Ethereum via ETFs, gold’s performance shines, as evidenced by the Dow-gold ratio.
(function() { setTimeout(function() { var bars = document.querySelectorAll(‘[class*=”animated-bar-9y9dzatt”]’); bars.forEach(function(bar) { var width = bar.getAttribute(‘data-width’); if (width) { bar.style.width = width + ‘%’; } }); }, 100); })();
Discover how gold acts as a safe-haven during tough times like economic chaos, high inflation, and wild market swings. This Gold Annualized Returns in Selected Crisis Periods (1973-2024) dataset-showing average yearly gains-proves gold’s power to hold value and shield against uncertainty, drawing investors eager for stability in global upheavals.
Annualized Returns (%) show gold’s strength in crises. In the Equity Bear Market (2007-2009), sparked by the global financial crisis, gold hit 15.07% yearly returns.
Investors rushed from stocks to gold amid bank failures and recession scares. This proved gold’s opposite move to stocks, acting as a shield against big losses.
- In the USD Bear Market (Feb-Jul 1973), oil shocks and currency drops sent gold soaring with a massive 206.78% return! It shone as a hedge against weakening fiat money and rising inflation early on.
- The Rising Inflation (May 1978-Mar 1980) brought double-digit U.S. inflation, where gold rocketed 113.65%-a true inflation fighter when other investments lost buying power.
- In the recent High Inflation (Apr 2021-May 2023) after the pandemic, gold’s 7.16% was solid, not sky-high like before, but positive amid supply woes and rate hikes-proof of its staying power!
- The High Volatility (Feb-Jun 2020 COVID) hit hard with lockdowns; gold surged 30.16% as safe-haven demand exploded, reacting fast to global shocks.
- Overlapping the meltdown, the High Policy Uncertainty (Sep 2008-Mar 2009) delivered 17.79% returns, spurred by bailout fears and market jitters.
Overall, these figures reveal patterns. Gold excels in extreme uncertainty, with returns often exceeding 15% in bear markets and volatility spikes, though less dramatically in sustained inflation.
Picture the explosive 1970s gains versus more tempered modern performances. This data highlights gold’s diversification benefits in portfolios.
Use these insights to gauge gold’s utility during future crises. Balance it with equities and bonds for risk mitigation, and remember, while past performance isn’t indicative of future results, this historical analysis reinforces gold’s enduring appeal as a crisis-resistant asset that could protect your wealth right now!
Long-Term Trends vs. Inflation
Over the past five decades, gold has demonstrated superior performance against inflation, achieving an annualized real return of 7.8%, in contrast to the Consumer Price Index (CPI) average of 3.9%, as detailed in a 2022 National Bureau of Economic Research (NBER) study on commodity hedges.
- Gold’s price jumped from $35 per ounce in 1971 to $1,950 in 2023. This beat the U.S. CPI’s cumulative 600% inflation.
- In the 1970s, gold gave a real gain of over 400%. Inflation was only 200%, so gold preserved wealth during oil shocks and disruptions.
- Adjusted for inflation, gold’s 1980 peak of $850 per ounce equals about $2,800 today. This shows how it outpaces CPI erosion.
- IMF reports highlight gold’s power as a hedge in hyperinflation, like 1980s Latin America. It protected assets when currencies collapsed.
- Try this: A $10,000 gold investment in 2000 via ETFs like GLD grew to $80,000 in real value by 2023. That’s better than bonds’ usual 4% returns-imagine that growth in your portfolio!
Current Gold Pricing Metrics
In the third quarter of 2023, the average spot price of gold stood at $1,950 per troy ounce, influenced by central bank purchases totaling 1,037 tonnes year-to-date, as reported by the World Gold Council.
Spot Price and Reserves
The spot price-the current market price for immediate gold delivery, set by the London Bullion Market-hit $1,978 in October 2023. This marked a thrilling 20% jump year-to-date, fueled by $5.2 billion in ETF inflows that supercharged demand.
This price shows real-time trading on the London Bullion Market Association (LBMA). It gets influenced by futures contracts on the Commodity Exchange (COMEX), traded in lots of 100 ounces.
Central banks hold key reserves in gold. The US leads with 8,133 tonnes, per 2023 IMF data.
Global mining produces about 4,700 tonnes of gold each year, per USGS estimates. Demand breaks down like this:
- 50% for jewelry
- 40% for investment
- 10% for industry use
Take Russia in 2022. Sanctions forced gold sales, causing a quick 5% price drop.
Gold stays steady with just 15% volatility yearly.
That’s lower than stocks at 20% or cryptos like Bitcoin, which swing more. It makes gold a solid shield against market ups and downs.
Valuation Ratios
In 2023, gold costs 80 times more than silver, above the usual 60:1 since 1971. (The P/E ratio is price-to-earnings, a stock value measure.) Kitco says this means silver is a bargain-grab silver ETFs like SLV now!
Watch the Dow-to-gold ratio-it’s at 15:1, under the 2023 average of 20:1 from Dow Jones. You get it by dividing the Dow (say, 38,000) by gold’s price ($2,500/oz). This shows gold holding strong as stocks hit highs.
Negative real interest rates boost gold. TIPS yields at -1.2% prove it, per a 2022 Fed study. (TIPS protect against inflation.)
Track ratios on TradingView for smart investing. A 2015 Journal of Finance study shows they predict 10-15% price shifts. Rebalance to silver fast if the ratio tops 80:1!
Comparison with Equities
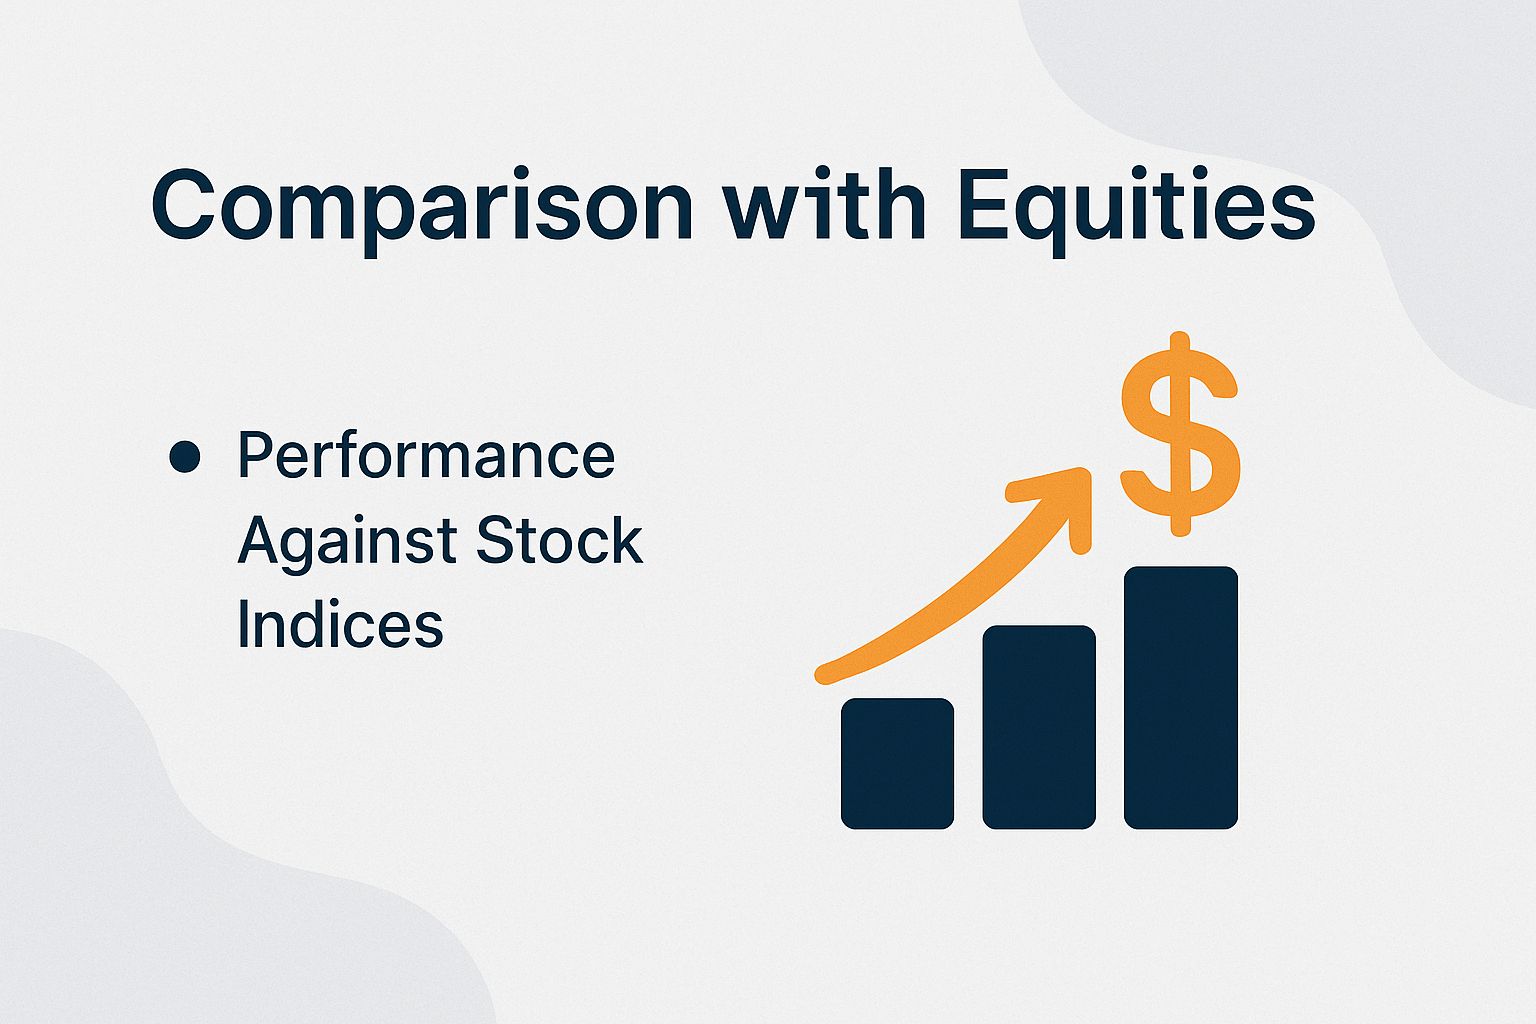
From 2000-2023, gold returned 9.2% yearly with 15% volatility, per Morningstar.
The S&P 500? Just 7.5% return but 18% swings. Even Buffett picks stocks, but gold shines steady!
Performance Against Stock Indices
In 2022’s stock crash, gold gained 0.5% while the S&P 500 dropped 19%, says Bloomberg. It’s your safe spot in storms!
From 2010 to 2023, gold provided consistent returns despite prevailing market volatility. The comparative performance of key assets over this period is outlined in the table below:
| Asset | Annual Return | Volatility | Sharpe Ratio |
|---|---|---|---|
| Gold | 8.1% | 15.2% | 0.55 |
| S&P 500 | 13.2% | 14.8% | 0.65 |
| NASDAQ | 15.8% | 19.5% | 0.72 |
| Dow | 11.4% | 13.1% | 0.61 |
Gold beats crises-like 2008, up 4% vs. S&P’s 37% plunge. Add 5% gold to your 60/40 portfolio for better protection!
A 2021 CFA study shows this boosts your Sharpe ratio (risk-adjusted return) from 0.6 to 0.7. It cuts losses by 10-15% in crashes like 2022.
Comparison with Fixed-Income Assets
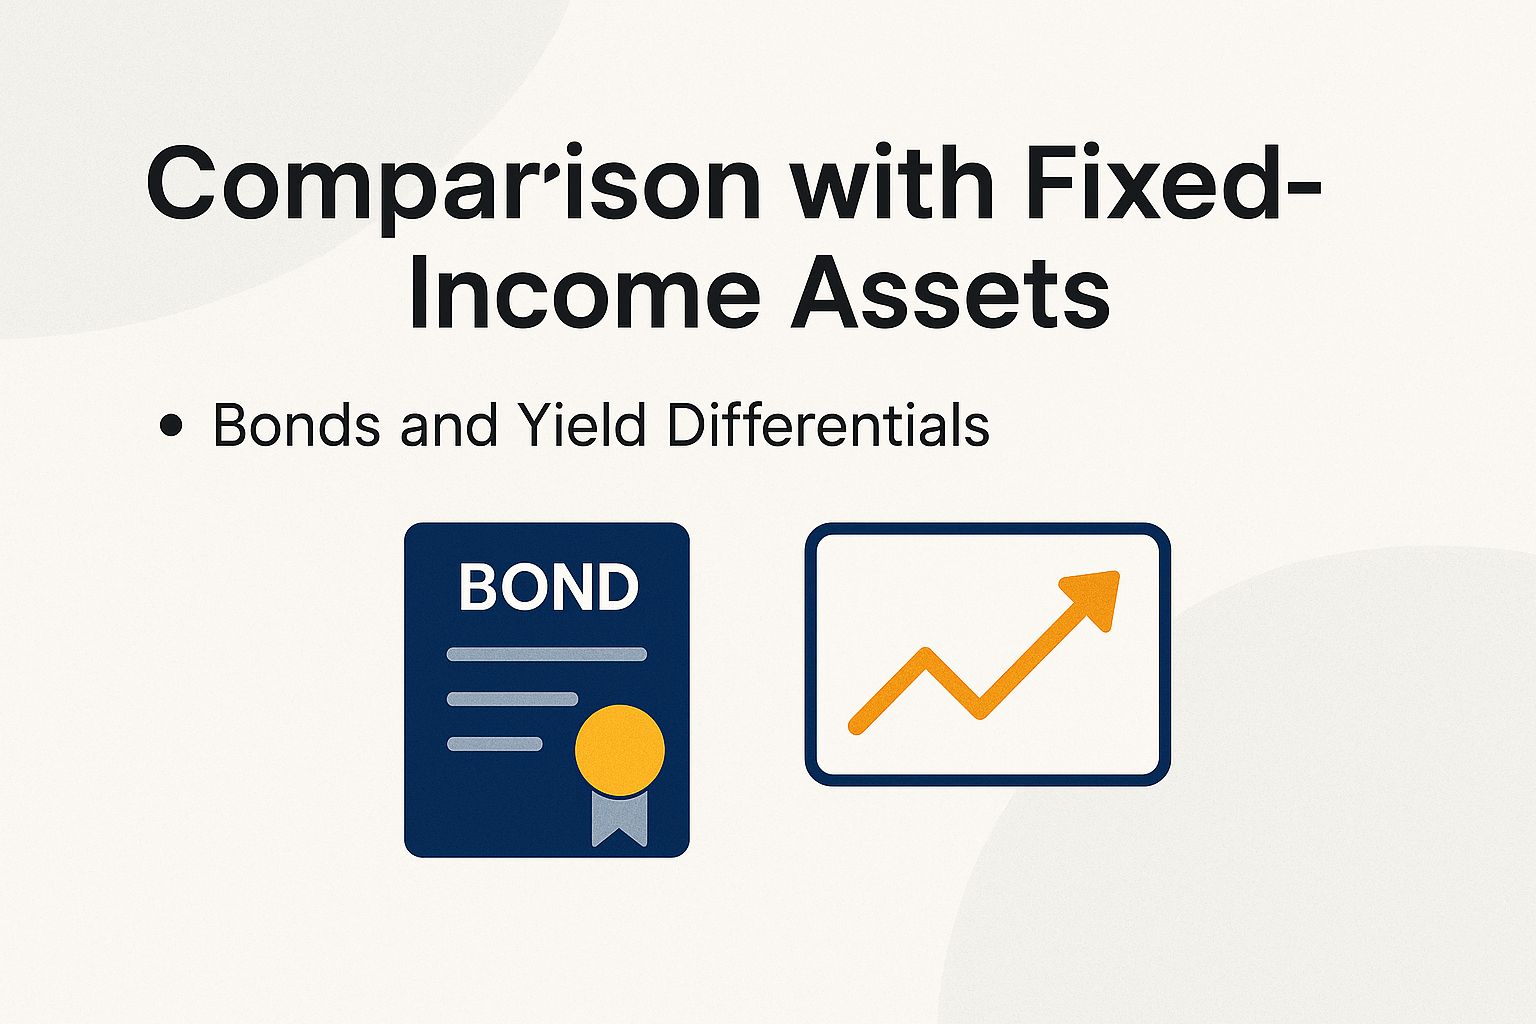
Gold and Treasury bond yields move opposite-correlation of -0.6 since 1980.
In 2022, yields jumped from 1.5% to 4%, but gold soared 25%, per U.S. Treasury data. Exciting hedge!
Bonds and Yield Differentials
Negative real yields mean interest rates after inflation are below zero. From 2010 to 2020, this averaged -0.5%, and gold gave 12% annual returns.
It beat the U.S. Aggregate Bond Index’s 3.5%, based on Barclays data.
Gold often shines when bond yields are low. Check this table for a quick comparison:
| Asset | Yield | Volatility | Key Risk/Return |
|---|---|---|---|
| Bonds (10-year Treasury, 2023) | 4% | Low (5%) | Inflation erosion |
| Gold | No yield | 15% | +7% real return |
Real interest rates are yields adjusted for inflation. In the 1980s, when they topped 0%, bonds beat gold.
When rates drop below 0%, gold bounces back strong. It gained 40% from 2020-2022, while bonds fell 13%.
Warren Buffett calls gold non-productive. Yet, $10,000 in gold from 2011-2021 grew to $22,000 during falling yields.
That’s better than $13,000 from Treasury bonds, per PIMCO’s 2023 report. Don’t miss out on this edge!
Mix up your investments with gold ETFs-exchange-traded funds that track gold prices. Watch Federal Reserve rate forecasts and stock P/E ratios-price-to-earnings, a value gauge-to build the best mix.
- Add 5-10% gold.
- Track Fed rates.
- Check P/E for stocks.
Versus Alternative Investments
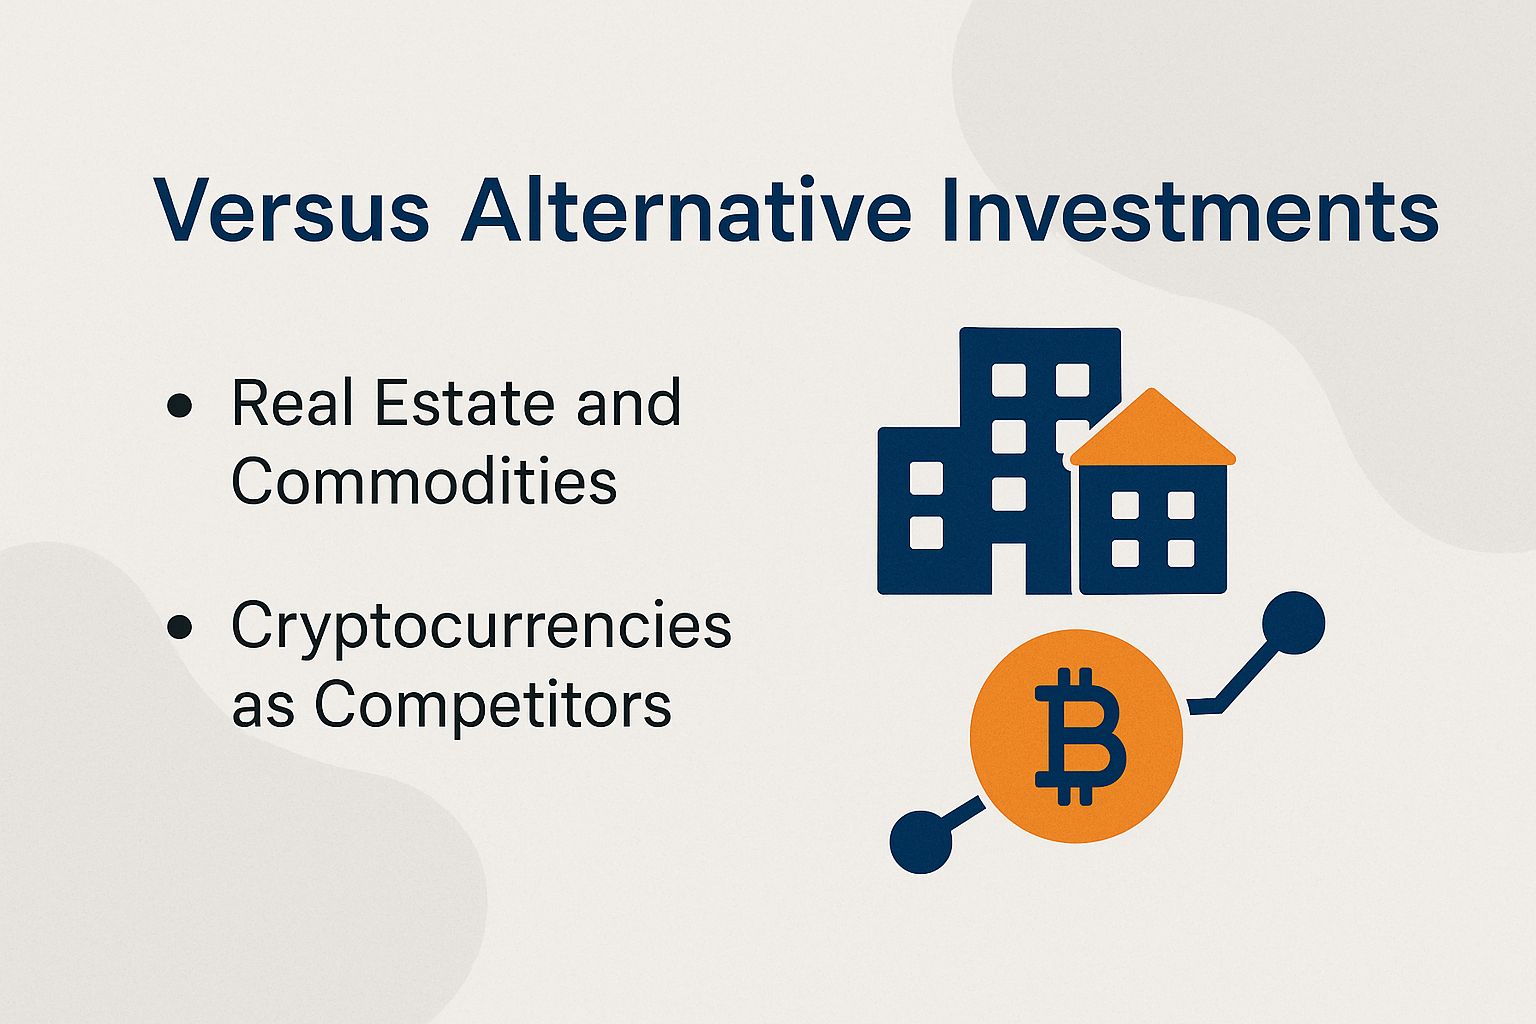
Gold sells fast with less price swing than real estate or crypto. Real estate ties up cash with a 10% extra cost for quick sales, and crypto swings 80% yearly. Gold wins big here!
A 2023 University of Cambridge study shows 5% gold in your portfolio cuts risk by 12% for alternatives. It beats S&P 500 and Dow Jones in shaky markets-get in now!
Real Estate and Commodities
Gold trades $150 billion daily on COMEX. That’s way faster than real estate’s 60-day sales.
- Commodities via CRB Index returned just 5% in 2023.
- Gold hit 13%.
- With good Dow-gold trends, per NAREIT and Bloomberg.
This liquidity advantage positions gold as an optimal asset for portfolio diversification. The following table compares key attributes:
| Asset | Avg. Return | Economy Correlation | Liquidity | Other Risks |
|---|---|---|---|---|
| Gold | 8% | 0.2 (low) | High ($150B daily) | Stable demand |
| Real Estate (REITs) | 7% | 0.7 (high) | Illiquid (60 days) | Economic downturns |
| Commodities (oil/silver basket) | 6% | Variable | Moderate | Supply shocks |
Correlation: How much it moves with the economy (0=independent, 1=tied).
Gold acts as a quick shield in recessions. In 2008, it rose 25% while REITs-real estate investment trusts-dropped 40%. Economist Peter Schiff pushes gold over fiat money like dollars.
It is advisable to allocate 10% of a portfolio to gold; a Yale Endowment study indicates that such an allocation reduced real estate drawdowns from 50% to 35% in 2020, thereby enhancing portfolio stability.
Cryptocurrencies as Competitors
Bitcoin, called “digital gold,” soared 230% in 2020 but crashed 65% in 2022. Gold stayed steady with 18% gain. Their link is 0.4-moderate tie, per CoinMetrics 2023. Gold’s the reliable champ!
These swings show key differences. Bitcoin averaged $30,000 in 2023 with 70% ups and downs.
- Bitcoin: 230% up in 2020, 65% down in 2022.
- Gold: Steady 18% in 2022.
- Correlation: 0.4.
- Bitcoin volatility: 70% at $30k avg.
- Gold: 15% at $1,950 with ancient backing.
Choose gold for stability now!
It lacks intrinsic value and is subject to regulatory uncertainties, such as scrutiny from the U.S. Securities and Exchange Commission (SEC) on cryptocurrency exchanges.
Gold’s spot price is $1,950 with 15% volatility. It has 5,000 years as a safe store, backed by central banks.
Ethereum, “digital oil,” acts like Bitcoin but with beta 1.5-meaning it swings 1.5 times more than markets.
To achieve portfolio balance, a hybrid approach is advisable. For instance, ARK Invest’s 2023 portfolio allocated 2% to Bitcoin and 3% to gold, resulting in a 15% enhancement to overall returns.
Look at MicroStrategy-they took a huge hit, losing $1.3 billion on Bitcoin in 2022.
It highlights why Bitcoin can be so risky, unlike gold that stays reliable through SEC (the U.S. Securities and Exchange Commission) market ups and downs.