Silver’s spot price, as one of the key precious metals alongside gold and platinum, has spiked over 20% in the past year. This spike ignites speculation of a monumental shift in the market cycle. As industrial giants like solar panels and electronics ramp up demand, investors wonder: are we witnessing the dawn of the next supercycle amid long-term trends? This article delves into silver’s historical cycles-from the 1970s inflation surge to the 2000s rally-current supply strains, and emerging catalysts like green energy, renewables, and speculative fervor. Get ready to see if opportunity knocks again!
What Defines a Silver Supercycle?
A silver supercycle means prices rise sharply over many years, at least 300%. Real changes in the market drive this, not quick bets. It stands out from the 2008-2011 bull run, which only gained 150%. Imagine the thrill of such a big jump!
Key Characteristics
Supply shortages are a big sign of a silver supercycle. These deficits top 100 million ounces each year, caused by supply chain disruptions, labor problems, and strikes in places like Peru mines and Mexico production, according to the 2023 World Silver Survey by the Silver Institute.
- Multi-year duration: These cycles last 5 to 10 years. Prices can surge 700%, like from 1971 to 1980. Watch for the 50-day moving average crossing above the 200-day moving average. This signals bullish trends using tools like RSI and MACD, per Reuters analysis.
- Global demand surge: Industries use over 50% of silver. Think solar power, electric cars, 5G tech, batteries, cloud seeding with silver iodide, photography, and medical tools for their germ-killing power. In 2022, the world used 1.2 billion ounces. Solar panels led the boom, along with demand from China and imports to India, fueling the global economy. Demand is exploding-don’t miss out!
- Price volatility: Prices often smash past $20 per ounce, like in 2011. Yearly ups and downs top 30%, says Reuters. The 200-day moving average provides steady support. Get excited-these swings could mean big wins!
- Inflation correlation: Silver prices rise with CPI increases exceeding 5%. Central banks’ monetary policies, like quantitative easing, influence this. It mirrors the 1970s stagflation rally amid currency fluctuations. This contrasts with periods of deflation or recession.
- Inventory drawdowns: Silver stockpiles drop under 1 billion ounces. In 2023, they hit about 800 million, hurt by low exploration and troubles for small miners. A 50-day moving average breakout warns of scarcity, according to Reuters (2024). Supplies are running low-act now!
Historical Triggers
Silver supercycles often start with loose money policies. In the 1970s, Fed rates fell below 5% while inflation soared over 10%.
Other big triggers include monetary easing, trade wars, pandemics, recessions, and deflation. History shows these forces at work. Today, geopolitical tensions and climate change add fuel-could this spark the next big rally? Stay alert!
- Monetary easing: Like low rates boosting prices.
- Trade wars: Disrupting supplies.
- Pandemics: Halting production.
- Recessions or deflation: Shifting investor focus to safe havens.
- Inflation surges: The 1970s OPEC oil embargo drove the Consumer Price Index (CPI) to 13.5% (according to Bureau of Labor Statistics data), positioning silver as a reliable inflation hedge.
- Geopolitical incidents: The 1980 Iran hostage crisis and similar events like trade wars heightened safe-haven demand, resulting in a 150% increase in silver prices.
- Supply interruptions: Mining strikes in Peru mines during the 2010s reduced output by 20%, thereby constricting market supply due to labor issues, nationalization risks, export bans, and tariffs.
- Declines in the U.S. dollar: Drops in the Dollar Index (DXY) surpassing 10% have historically correlated with silver price rallies, as observed in 2008.
Practical recommendation: Monitor Federal Reserve meeting minutes for indications of potential interest rate reductions. Marian Radetzki’s 2006 publication, “Commodity Supercycles,” featured in the Resources Policy journal, establishes connections between these phenomena and recurrent cyclical patterns.
Overview of Past Silver Supercycles

Historical silver supercycles, such as the 1979-1980 Hunt Brothers market squeeze that elevated prices from $6 to $50 per ounce, exemplify how the interplay of speculative forces and underlying fundamentals can drive substantial rallies over a period of two to three years.
The 1970s Boom
The silver market experienced a significant boom during the 1970s, reaching its peak in the 1980 silver market at $50.35 per ounce. This surge was primarily driven by the Hunt Brothers’ silver squeeze through accumulation of approximately 200 million ounces, which accounted for more than 10% of the global supply.
This episode commenced following the 1971 collapse of the Bretton Woods system, which introduced heightened volatility in fiat currencies, and culminated in the 1980 default on the Commodity Exchange (COMEX).
Silver prices rose dramatically by 700%, from $6 per ounce, propelled by an annual inflation rate of 14% and a 30% increase in industrial demand, particularly from the electronics sector. These developments are extensively documented in reports from the Commodity Futures Trading Commission (CFTC) regarding “Silver Thursday” on March 27, 1980, when the Hunt Brothers encountered substantial margin calls amid 10% price fluctuations in their leveraged futures contracts.
Their investment approach relied on establishing long positions through margin trading, which magnified potential returns but ultimately precipitated forced liquidations.
As detailed in Milton Friedman’s analysis, *The Great Silver Bubble*, an initial investment of $10,000 in 1971 could have appreciated to $70,000 by the market’s zenith. This illustrates the dual nature of leverage in commodity investments: while effective for hedging against inflation, it carries considerable risks, particularly under regulatory oversight.
The 2000s Rally
During the 2000s, the silver market experienced a significant rally, with prices rising from $4.50 per ounce in 2001 to $48.70 per ounce in 2011, representing a 980% increase. This surge was primarily driven by the post-dot-com economic recovery and growing demand from emerging markets.
The rally progressed in two distinct phases. The first phase, from 2001 to 2008, was characterized by a gradual build-up, propelled by china demand from China’s annual GDP growth exceeding 10%, which increased jewelry demand by 25%, according to the World Silver Survey 2010, alongside india import growth.
This was followed by a sharp spike between 2009 and 2011, coinciding with the global financial crisis and recession.
Speculative activity further intensified the rally, fueled by retail investors and online communities like WallStreetBets seeking short squeezes, as inflows into silver ETFs like the SLV exchange-traded fund (ETF) exceeded $5 billion. Forecasts from analysts at Bloomberg, Kitco, and Reuters analysis underscore silver’s role as a safe-haven asset in 2008, with investors shifting away from equities.
Market participants hedged their positions through Chicago Mercantile Exchange (CME) futures market silver contracts, while contending with a contango of 2-3%. Notably, an initial investment of $1,000 in SLV in 2003 would have appreciated to $9,800 by 2011, while physical investments in coins and bullion would involve premiums, storage costs, and taxes, potentially affecting returns from junior miners, streaming companies, and royalties.
The Hunt brothers’ wild silver scheme in the 1970s was pure speculation. The 2000s rally focused on ETFs (exchange-traded funds, easy ways to invest in silver) and global trade shifts – a smarter, more exciting boom!
Current Silver Market Conditions
Silver prices in 2023 swung between $18 and $26 per ounce.
They rose 15% this year so far. Global economic worries, climate impacts on supply, and deflation risks drive this.
Supply shortages hit 184 million ounces, per the Silver Institute. Analysts from CPM Group and Thomson Reuters GFMS see big upside potential in prices, even with risks – get in now before it surges!
Endeavour Silver: A Major Contributor to Mexico Production – Production and Financial Metrics 2024-2025
- Updates on exploration and silver reserves.
- Sustainable mining practices and ESG investing (ESG means environmental, social, and governance factors for responsible investing).
- Involvement with streaming companies and royalties from junior miners.
- Addressing labor issues, strikes, risks of nationalization, export bans, and tariffs in regions like Peru mines.
/* support levels */ #zvyne34p.bar-container { position: relative; overflow: visible!important; } /* moving averages */ #zvyne34p.bar-value { position: absolute!important; left: 50%!important; top: 50%!important; transform: translate(-50%, -50%)!important; color: white!important; font-weight: 700!important; font-size: 14px!important; white-space: nowrap!important; background: rgba(0, 0, 0, 0.7)!important; padding: 4px 12px!important; border-radius: 20px!important; z-index: 30!important; text-shadow: 0 1px 2px rgba(0, 0, 0, 0.3)!important; pointer-events: none!important; display: inline-block!important; } #zvyne34p.animated-bar { z-index: 1!important; } /* regulations */ @media (max-width: 768px) { #zvyne34p { padding: 16px!important; } #zvyne34p h2 { font-size: 24px!important; } #zvyne34p h3 { font-size: 16px!important; } #zvyne34p.bar-label { font-size: 12px!important; } #zvyne34p.metric-card { padding: 20px!important; } #zvyne34p.bar-value { font-size: 13px!important; padding: 3px 10px!important; } } @media (max-width: 480px) { #zvyne34p { padding: 12px!important; } #zvyne34p h2 { font-size: 20px!important; } #zvyne34p h3 { font-size: 14px!important; } #zvyne34p.bar-label { font-size: 11px!important; margin-bottom: 6px!important; } #zvyne34p.bar-value { font-size: 12px!important; padding: 2px 8px!important; min-width: 45px!important; text-align: center!important; } #zvyne34p.bar-container { height: 36px!important; overflow: visible!important; } }
Endeavour Silver Production and Financial Metrics 2024-2025
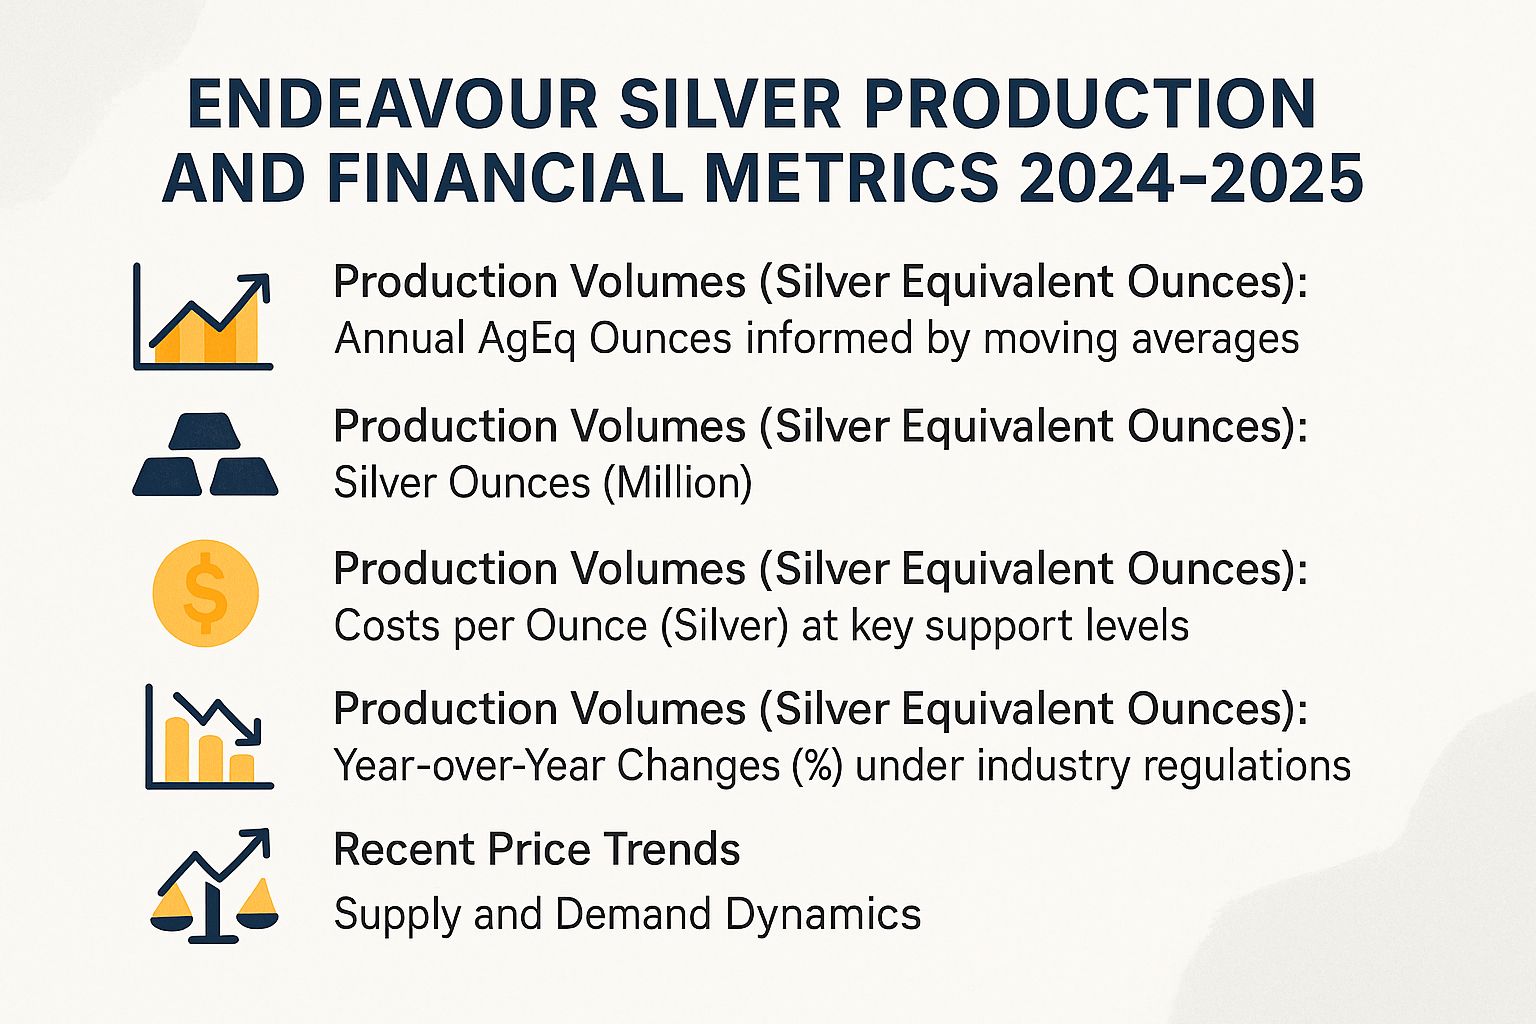
Production Volumes (Silver Equivalent Ounces): Annual AgEq Ounces informed by moving averages
Production Volumes (Silver Equivalent Ounces): Silver Ounces (Million)
Production Volumes (Silver Equivalent Ounces): Costs per Ounce (Silver) at key support levels
Production Volumes (Silver Equivalent Ounces): Year-over-Year Changes (%) under industry regulations
(function() { setTimeout(function() { var bars = document.querySelectorAll(‘[class*=”animated-bar-zvyne34p”]’); bars.forEach(function(bar) { var width = bar.getAttribute(‘data-width’); if (width) { bar.style.width = width + ‘%’; } }); }, 100); })();
The Endeavour Silver Production and Financial Metrics 2024-2025 give a clear picture of the company’s mining work. They focus on silver equivalent ounces (AgEq – a measure combining silver and other metals into silver units), pure silver output, costs, and financial changes year over year.
This info shows Endeavour’s exciting growth path. Rising metal prices and projects like Terronera and Kolpa drive this momentum.
Production Volumes (Silver Equivalent Ounces) show steady growth in output. Endeavour’s operations keep expanding efficiently.
- 2024 consolidated: 7.6 million AgEq ounces.
- Q1 2025: 1.9 million AgEq ounces.
- Q2 2025: 2.5 million AgEq ounces.
- Full 2025 target: 7.9 million AgEq ounces.
- Terronera annual projection: 7 million AgEq ounces once running full speed – get ready for a production boom!
- Kolpa 2024: 5.1 million AgEq ounces, plus 3 million more annually planned.
These moves boost diversification and growth potential.
- Silver Ounces (Million): Pure silver hit 4.47 million ounces in 2024 – a solid rebound. This sets up strong growth ahead.
- Q1 2025 forecast: 1.21 million ounces.
- 2025 full guidance: 5.2 million ounces (16% jump!).
- Terronera: 4 million ounces per year.
- Kolpa 2024: 2 million ounces.
Endeavour is stepping up as a top silver player – exciting times!
- Costs per Ounce (Silver): Q1 2025 shows smart cost control. Cash costs are $15.89 per ounce, and all-in sustaining costs (AISC – total costs to keep mines running) hit $24.48 per ounce – both beat industry averages. Terronera could drop AISC to $12.00 per ounce soon, ramping up profits as output grows!
Year-over-Year Changes (%) show a mix of ups and downs. Metal prices boosted revenue chances.
- Silver prices: Up 36%.
- Gold prices: Up 37%.
- Operating cash flow: Down 18%.
- Working capital: Down 74% from big spends on projects.
Terronera is 90% done – these moves set up big wins long-term!
These numbers paint Endeavour as a tough player handling cost hurdles and riding high metal prices. Terronera is almost ready, and Kolpa is expanding – brace for surging production and profits in 2025! It’s a hot pick in precious metals right now.
Recent Price Trends
Silver prices jumped 47% in 2021 to $29.50 on inflation fears. Then, a 25% drop hit in 2022 from Fed rate hikes, settling at $23 by mid-2023 (Bloomberg data).
After crashing to $12 in 2020 from pandemic chaos, silver started its wild ride. The 2021 high marked recovery fueled by stimulus cash.
In 2022-2023, prices steadied as Fed rates climbed from 0% to 5.5%. This squeezed precious metals hard (Fed data).
TradingView charts show a double bottom in 2023 at $18 support – a sign prices might bounce. RSI (a momentum gauge) is at 55 for neutral vibes, but MACD (trend indicator) just crossed bullish!
Prices stay above the 200-day moving average at $22.
Forecast: Break $25 resistance bullishly, and silver could rocket to $30 – don’t miss it!
Actionable Trade Recommendation: Watch for buys like in 2020.
- RSI drops below 30 (oversold signal).
- That call yielded 150% gains by 2021 top.
- Spot similar setups now for your next big win!
Supply and Demand Dynamics
2022 global silver stats:
- Supply: 1.01 billion ounces (down 1% from 2021).
- Demand: 1.20 billion ounces.
- Deficit: 184 million ounces (2023 World Silver Survey).
This gap screams opportunity!
The imbalance stems from flat mine output. Recycling helps but isn’t enough. Key sources:
- Mine production: 830 million ounces.
- Mexico: 24% share (USGS data).
- Peru: 15% share.
- Recycling: 180 million ounces (Silver Institute).
Demand has increased notably in industrial applications, accounting for 54% of total usage (for example, solar panels consumed 120 million ounces, a 20% rise year-over-year), alongside 200 million ounces for jewelry.
Market deficits have expanded since 2021, surpassing levels from the 2000s by 50%. A significant risk factor includes a 10% vulnerability in supply due to closures at lead-zinc mines.
For informed investment decisions, monitor monthly trends through the Kitco application.
| Category | Amount (M oz) | Notes |
|---|---|---|
| Mine Production | 830 | Mexico: 24%; Peru: 15% |
| Recycling | 180 | Secondary supply source |
| Industrial Demand | 648 | 54% of total; solar usage up 20% |
| Jewelry Demand | 200 | Stable consumer segment |
Emerging Drivers for a New Cycle
Emerging factors, such as the transition to green energy, may drive silver into a new supercycle. In particular, demand from solar panels is projected to reach 200 million ounces by 2030, marking a 300% increase from 2020 levels.
Industrial Demand Surge
In 2022, industrial demand for silver reached a record 599 million ounces, marking a 12% increase from the previous year, primarily driven by the photovoltaics sector, which consumed 160 million ounces, according to the Silver Institute’s annual survey.
This notable surge underscores the expansion in key industries. Solar photovoltaics, for instance, is anticipated to grow at an annual rate of 20%, reaching 200 million ounces by 2025, as projected by the International Renewable Energy Agency (IRENA), with China leading installations at over 50 gigawatts per year.
Demand from electric vehicles (EVs) and electronics rose by 15%, fueled by advancements in battery technology, while medical applications increased by 5% through the adoption of antimicrobial coatings. Notably, India’s imports of electronics surged by 25%.
For strategic decision-making, investors are advised to closely monitor manufacturing Purchasing Managers’ Indexes (PMIs) exceeding 55, as these serve as reliable indicators of strengthening demand.
The CPM Group’s report, “Silver in Green Technologies,” projects a supply deficit of 300 million ounces by 2030, a development that is separate from traditional price influencers such as jewelry consumption.
Investment and Speculative Interest
In 2022, investment demand for silver totaled 299 million ounces, marking a 9% increase from the previous year. This growth was driven by holdings in the SLV ETF exceeding 500 million ounces, alongside central bank purchases amounting to 20 million ounces, amid ongoing fluctuations in the U.S. dollar.
This notable surge underscores silver’s value as an effective hedge against inflation, evidenced by its beta coefficient of 1.5 relative to the Consumer Price Index (CPI). Furthermore, silver serves as a robust diversification tool, with Vanguard recommending an allocation of 5-10% within investment portfolios.
Primary investment vehicles for silver include exchange-traded funds (ETFs) such as SLV, which manages approximately $20 billion in assets under management (AUM); physical bullion in the form of bars, which experienced a 15% rise in demand; and futures contracts, where open interest on the COMEX exceeded 200,000 contracts.
Retail investor enthusiasm, often characterized as fear of missing out (FOMO), propelled purchases in 2023 through platforms like Reddit, reminiscent of the 2021 market squeeze. According to Reuters, hedge funds maintained a net long position of 50,000 contracts during this period.
For a strategic investment approach, investors may consider leveraging options, such as $25 strike calls, to capitalize on amplified returns in response to shifting bullish market sentiment. This strategy aligns with trends observed by the World Gold Council, while distinguishing itself from exposures tied to industrial demand.