Global debt has surged past $300 trillion, says the Institute of International Finance. Gold prices are climbing too, showing a hidden link.
This isn’t just chance. It protects against money troubles in the economy.
Let’s explore government debt, why gold is a safe bet, past patterns since World War II, and tips for investors facing risks ahead.
Understanding Sovereign Debt
Governments borrow money to cover spending gaps. This is called sovereign debt.
The U.S. debt is now 123% of its economy size, per World Bank 2023 data. This raises big worries about keeping it under control long-term.
Types of National Debt
National debt falls into two big types: public debt owned by outsiders like foreign governments, and internal holdings like U.S. Social Security funds. Total U.S. debt hit $34.5 trillion in 2024, per Treasury data.
- Domestic bonds: About $27 trillion in U.S. Treasuries held at home. Inflation can eat away at their value.
- Foreign-held debt: China owns $800 billion of it. Geopolitical fights add risks when renewing these loans.
- Short-term vs. long-term debt: Short ones like Treasury bills mature in under a year and need quick refinancing, risking rate changes. Long ones like 30-year bonds last longer. Check these 2024 Federal Reserve yields (yield is the interest rate paid):
Instrument Maturity Yield (%) 3-Month T-Bill 0.25 years 5.3 2-Year Note 2 years 4.7 10-Year Note 10 years 4.2 30-Year Bond 30 years 4.5 - Contingent liabilities: Things like $1.2 trillion in loan guarantees from 2023 CBO data. These are hidden risks that could turn into debt without direct loans.
Global Debt Trends
Global debt hit $305 trillion in 2023. That’s a huge 40% jump from 10 years ago, per Institute of International Finance.
This boom ties into gold and metal prices as money policies change. Get ready – it’s exciting how this affects your investments!
COVID recovery plans drove it, like the EU’s EUR750 billion fund. These big spends changed everything fast.
- Debt is up in growing and rich countries. Their debt-to-GDP ratio is now 66%, says the IMF. (Explain: This measures debt against economic size.)
- Central banks stepped in big. The Fed grew its assets to $9 trillion during tough times.
- After COVID, debt jumped $28 trillion from 2020-2021. Commodity prices swung wildly too.
- Rich countries have 130% debt-to-GDP, while poorer ones struggle with slow growth and recession fears.
- Worries grow: Argentina defaulted in 2023. Watch for U.S. debt ceiling fights and bailout needs – act now to protect your money!
Picture a line chart: Global debt went from $200 trillion in 2010 to $305 trillion in 2023. It keeps speeding up thanks to easy money policies like quantitative easing (central banks printing more money to boost economy) and government spending.
Without big changes, McKinsey says it could hit $400 trillion by 2030. Time to pay attention – this could shake markets!
Gold’s Role in the Economy
Gold represents a foundational element of the global economy, functioning as a reliable store of value. According to data from the World Gold Council, annual demand for gold reached 4,741 tonnes in 2022, driven by a combination of industrial applications and investment demand.
Historical Safe-Haven Status
Gold has been a safe-haven asset since ancient times. Its modern role kicked off with the 1971 Nixon Shock, ending the Bretton Woods gold standard-think of it as the U.S. ditching the gold-backed dollar for flexible money.
Gold’s price skyrocketed from $35 to $850 per ounce by 1980 as the world shifted to fiat currencies, which aren’t backed by physical assets.
Gold proved its worth in big crises before 2000, unlike the ups and downs we’ve seen lately.
In the 1930s Great Depression, people hoarded gold, boosting U.S. prices by 69% per Federal Reserve data, while unemployment hit 25%-gold brought real stability.
Picture this: Create a timeline infographic showing gold’s price jumps next to big recessions. Use easy tools like Canva to spotlight trends and how gold’s value soars or dips-it’s a game-changer for understanding the market!
After 2000, gold shone in crises like the dot-com bust and subprime mess that sparked the Eurozone crisis.
In 2008’s financial meltdown, gold climbed 25% while the S&P 500 plunged 37%-patterns like before, but not as wild as the shift from gold-backed money.
Properties Driving Demand
Gold’s key traits-it’s rare, tough, and great at conducting electricity-drive its demand, just like with silver and platinum. In 2023, industries used 10% of the 4,899 tonnes gobbled up, per the World Gold Council.
Key properties include the following:
- Rarity: Mines produce about 3,000 tonnes yearly (USGS 2023), but total above-ground stocks are around 200,000 tonnes. This keeps supply tight, limiting how much demand can grow without prices jumping.
- Doesn’t rust: Gold lasts forever in gadgets, like the 0.034 grams in each iPhone connector for reliable connections.
- Aesthetic appeal: This characteristic propels demand in the jewelry sector, with India accounting for 2,100 tonnes of consumption in 2023 (World Gold Council).
- Liquidity: The spot market facilitates daily trading volumes of $200 billion, thereby supporting efficient and straightforward transactions.
- Hedge against risks: It moves opposite to the U.S. dollar (correlation of -0.7, per JPMorgan), protecting your investments. Mix it into your portfolio to spread risk and stay safe.
Sector breakdown (based on pie chart data):
- Jewelry: 49% (2,400 tonnes)-sparkling demand!
- Investment: 25% (1,225 tonnes), from bets via futures and options to safe ETFs like GLD or physical bars
- Central banks and sovereign wealth funds: 23% (1,127 tonnes)
- Technology for industrial use: 7% (343 tonnes)
- Other, including commodities like silver and platinum: 1% (49 tonnes)
What’s Driving Precious Metals Prices in 2024? (BullionVault Survey-Don’t Miss These Trends!)
#metrics-dashboard.bar-container { position: relative; overflow: visible!important; } #metrics-dashboard.bar-value { position: absolute!important; left: 50%!important; top: 50%!important; transform: translate(-50%, -50%)!important; color: white!important; font-weight: 700!important; font-size: 14px!important; white-space: nowrap!important; background: rgba(0, 0, 0, 0.7)!important; padding: 4px 12px!important; border-radius: 20px!important; z-index: 30!important; text-shadow: 0 1px 2px rgba(0, 0, 0, 0.3)!important; pointer-events: none!important; display: inline-block!important; } #metrics-dashboard.animated-bar { z-index: 1!important; } /* Styles for tablet screens */ @media (max-width: 768px) { #metrics-dashboard { padding: 16px!important; } #metrics-dashboard h2 { font-size: 24px!important; } #metrics-dashboard h3 { font-size: 16px!important; } #metrics-dashboard.bar-label { font-size: 12px!important; } #metrics-dashboard.metric-card { padding: 20px!important; } #metrics-dashboard.bar-value { font-size: 13px!important; padding: 3px 10px!important; } } /* Styles for mobile screens */ @media (max-width: 480px) { #metrics-dashboard { padding: 12px!important; } #metrics-dashboard h2 { font-size: 20px!important; } #metrics-dashboard h3 { font-size: 14px!important; } #metrics-dashboard.bar-label { font-size: 11px!important; margin-bottom: 6px!important; } #metrics-dashboard.bar-value { font-size: 12px!important; padding: 2px 8px!important; min-width: 45px!important; text-align: center!important; } #metrics-dashboard.bar-container { height: 36px!important; overflow: visible!important; } }
Drivers of Precious Metals Prices in 2024 (BullionVault Survey)
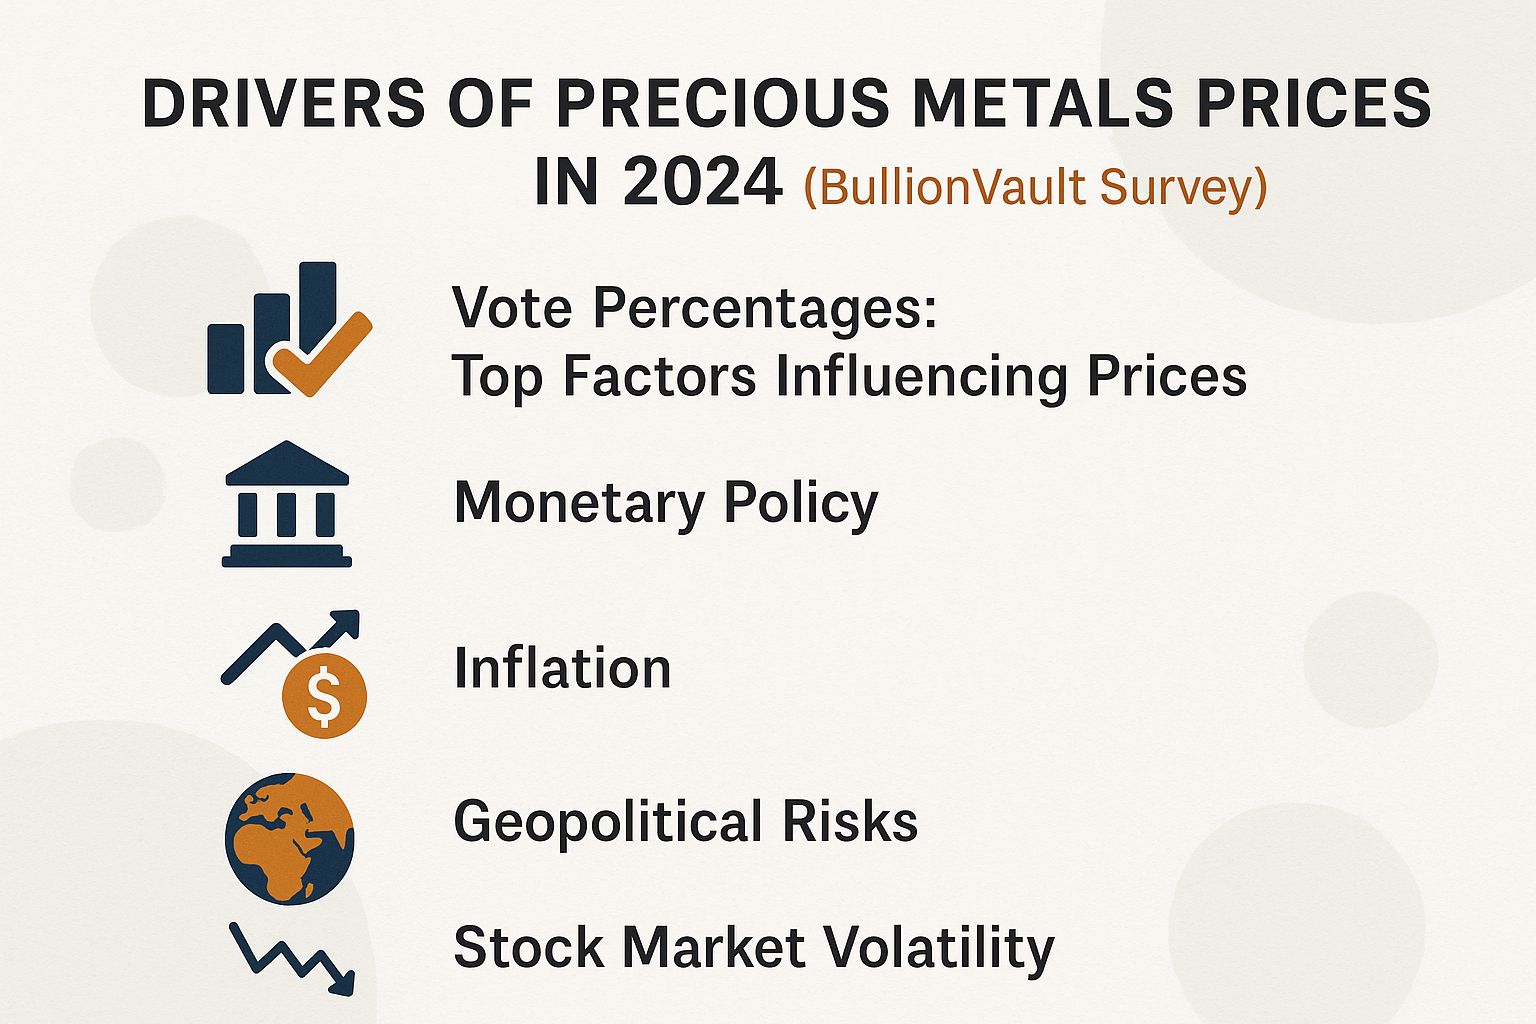
BullionVault asked investors what will drive precious metals prices in 2024. Their votes reveal exciting insights-check out the top factors now!
Top Vote-Getters: What Drives Precious Metals Prices in 2024?
- Monetary Policy: 25.0% of votes-interest rates and inflation are key!
- Geopolitics: 22.0%-global tensions could spike prices fast.
- Government Spending and Deficits: 20.8%-rising debts mean more demand for safe havens.
(function() { setTimeout(function() { var bars = document.querySelectorAll(‘[class*=”animated-bar-7bbdmhkr”]’); bars.forEach(function(bar) { var width = bar.getAttribute(‘data-width’); if (width) { bar.style.width = width + ‘%’; } }); }, 100); })();
BullionVault’s survey dives into what drives gold and silver prices in 2024. It pulls votes from real investors to spotlight top factors amid economic ups and downs.
Vote Percentages highlight three top forces in the Top Factors Influencing Prices. Monetary Policy tops at 25% of votes.
Central bank moves, like interest rate changes from the Federal Reserve, hit precious metals and the dollar hard. Lower rates make gold shine brighter than bonds.
In 2024, inflation fears and easing policies excite investors. They expand money supply, hinting at dollar weakness and pushing gold prices up fast.
- Monetary Policy leads with 25% of votes. Central banks’ choices, like the Federal Reserve’s interest rate cuts, boost gold by making it a better option than low-yield bonds, especially in 2024 amid inflation worries and money supply growth that could weaken currencies.
- Geopolitics, with 22% of votes, highlights the role of global tensions in elevating precious metals as safe-haven investments. Events like conflicts in Ukraine or the Middle East, or U.S.-China trade wars and sanctions, drive investors toward gold during instability, prompting capital flight. This factor’s prominence in 2024 stems from heightened geopolitical risks, including elections and regional disputes, which amplify volatility and reinforce metals’ role as a hedge against uncertainty.
- Government Spending and Deficits garner 20.8% of votes, pointing to fiscal policies that fuel inflation and debt concerns, as highlighted by the IMF and World Bank. Massive stimulus packages and rising national debts relative to GDP, particularly in the U.S. and Europe, erode fiat currency value and purchasing power, increasing the cost of living while wage growth remains stagnant, prompting a flight to precious metals. In a year marked by post-pandemic recovery and potential new spending initiatives, this driver signals worries over long-term economic stability and its inflationary effects.
These three drivers grab almost 68% of votes. They show how big policies and world events team up to shake gold and silver prices.
Smart investors, from pension funds to you, should mix in gold ETFs like GLD. In 2024’s wild ride, grab these chances now-gold’s already climbing amid the chaos!
The Inverse Relationship Explained

Picture this: as national debt skyrockets, investors rush to gold for safety. Data from Bloomberg shows a strong link- a -0.65 correlation in the 2010s-where rising debt shakes faith in paper money and sends gold soaring.
Economic Mechanisms
Watch gold futures on COMEX for clues. Markets can be in contango-where future prices top current ones-or backwardation-the reverse-per CFTC trader reports. The LBMA runs the big over-the-counter trades, and the World Gold Council shares yearly demand stats to help you decide.
Central banks pumped about $25 trillion into the world economy after 2008 via quantitative easing, says the BIS. This flood weakened currencies and rocketed gold prices by 400% from 2001 to 2011-talk about a golden opportunity!
- First, the Federal Reserve pumped $3.5 trillion into the economy through QE1 to QE3 programs (Federal Reserve paper, 2011). Quantitative Easing means central banks create money to buy assets and boost the economy. This action weakened paper money, or fiat currencies, and drove gold prices up 150% by 2014.
- Second, low interest rates hurt savers. The Federal Reserve kept real rates below zero with its zero lower bound policy, meaning rates after inflation were negative. This led to 20% gold price gains because holding gold became cheaper than low-yield savings (Bernanke, 2010 speech).
- Third, depreciation of the U.S. dollar: A 30% decline in the USD index during 2020 corresponded with a 25% rise in gold prices, as evidenced by analyses of the Federal Reserve’s balance sheet.
- Fourth, heightened risk aversion: Amid the 2010 Greek sovereign debt crisis, gold prices surged by 29%, driven by increased demand for safe-haven assets.
Picture this exciting path to gold gains:
- Start with a big economic shake-up, like Quantitative Easing (central banks printing money to stimulate growth).
- This debases currency, making money worth less.
- Smart investors shift to gold.
- Gold prices skyrocket!
- End with protected wealth.
Inflation and Currency Devaluation
Too much national debt often sparks inflation. This eats away at the value of paper money. In 2022, U.S. inflation hit 9.1% per CPI data. Gold jumped to $2,000 an ounce, acting as a shield for your buying power.
Gold has proven to be an effective hedge against risks in high-debt economic environments. The following scenarios illustrate its value:
- Inflation Hedging: Gold fought back in the 1970s when inflation averaged 13% yearly. It delivered about 10% annual returns, beating cash by holding real value (St. Louis Federal Reserve data).
- Devaluation Effects: Venezuela’s 2018 hyperinflation topped 1 million percent. People rushed to buy gold bars to save their wealth as the bolvar crashed.
- Debt Monetization: Japan carries 250% debt to GDP but keeps inflation low with yen carry trades (borrowing cheap yen to invest elsewhere). Smart investors still put 5-10% into gold against currency risks.
Don’t delay-grab your share of gold now! Put 5-15% of your investments into physical gold or ETFs like GLD. Think about it: $1,000 in gold from 1980 buys three times more today than the same in cash (St. Louis Federal Reserve data).
Historical Correlations

History shows gold thrives as global debt climbs. After the Bretton Woods system ended in 1971, gold prices soared 500% by 1980. Global debt doubled in that time (World Bank archives).
Post-WWII Era
In the post-World War II period, the United States’ abandonment of the gold standard in 1971, coinciding with national debt reaching $400 billion, corresponded with a dramatic surge in gold prices from $35 per ounce to over $800 per ounce by 1980.
The shift happened in three key phases. Get ready to see how gold reacted!
- Phase 1 (1944-1971): Steady times under Bretton Woods kept debt-to-GDP dropping from 120% to 35% (Federal Reserve data). This fueled growth. But on August 15, 1971, Nixon suspended dollar-to-gold swaps, saying: “I have directed the Secretary of the Treasury to suspend temporarily the convertibility of the dollar into gold.” Speculators were pushing too hard.
- Phase 2 (1970s): Oil shocks spiked debt and inflation to 13%. Gold exploded 2,300% from $35 to $850 an ounce.
- Phase 3 (1980s): Fed Chair Volcker raised rates. Inflation fell to 3-5%, and gold dropped 65% to $300 by 1982.
| Phase | Debt/GDP Ratio | Gold Price Change | Inflation Impact |
|---|---|---|---|
| 1944-1971 | 120% to 35% | Stable at $35/oz | Avg. 2-3% |
| 1971-1980 | 35% to 32% | +2,300% ($35 to $850) | Peaked 13.5% |
| 1980-1990 | 32% to 55% | -65% ($850 to $300) | Fell to 3-5% |
Modern Case Studies
The 2008 financial crisis shows how rising national debt links to higher gold prices.
U.S. public debt jumped from $9.8 trillion to $14.5 trillion by 2012. Gold prices soared 150%, from $800 to $1,900 per ounce.
Subprime mortgages collapsed and sparked the crisis.
The government launched the $700 billion Troubled Asset Relief Program (TARP), a rescue plan for banks. Gold prices jumped 25% in a year. Investors poured $50 billion into gold ETFs, seeing gold as a safe haven, per IMF reports.
The 2011 Eurozone debt crisis highlighted this link big time. Greece’s debt hit 180% of its GDP, sparking bailout fears. Gold prices rocketed 30%, according to Reuters.
Russia’s 2022 invasion of Ukraine ramped up global tensions.
Central banks bought 1,136 tonnes of gold. Prices rose 8%. This shows gold’s key role in spreading out investment risks, per World Gold Council studies.
Implications for Investors
Hey investors, add 5-10% gold to your portfolio like Ray Dalio suggests in his All-Weather strategy. It can cut price swings (volatility) by 20% when debt is high, based on Bridgewater Associates’ tests. Don’t miss out on this stability boost!
Gold diversification (spreading investments) cut big drops in value (drawdowns) by 15% in 2022, says Morningstar.
Follow these steps to add gold smartly.
- **Allocation Guidelines**: In conservative portfolios, aim for a 5% allocation to gold. Consider the GLD ETF, which offers straightforward exposure with a modest expense ratio of 0.40%.
- **Investment Options**: Pick physical gold bars with secure storage meeting LBMA (London Bullion Market Association) rules. Or use ETFs like GDX for gold mining companies, traded on COMEX (a major metals exchange) and overseen by the CFTC (U.S. commodity regulator). Miners delivered +40% gains in strong markets and 5.2% yearly returns from 2016-2020, according to Vanguard.
- **Timing Considerations**: Acquire gold during debt ceiling negotiations, as historical patterns indicate short-term price surges of 10-15%.
- **Risk Management**: Be mindful of gold’s 20% volatility and associated storage costs, approximately $100 per year. Mitigate these risks through diversification.
Future Outlook and Risks
The Congressional Budget Office (CBO) predicts U.S. debt will hit 180% of GDP by 2050.
Gold could soar to $3,000 per ounce by 2030 – act now! Watch out for hurdles like digital currencies and rising interest rates.
The forecasting of gold’s future performance depends on four principal factors:
- Global debt will jump 50% by 2030, per the Institute of International Finance (IIF). Expect more demand for gold as a safe haven.
- Inflation at 2-4% could lift gold prices 15%, says Goldman Sachs. It protects your money from losing value.
- Risks ahead: Cryptos like Bitcoin stole 10% of investments in 2021. 2022 rate hikes dropped gold 10%.
- Geopolitical heat, like BRICS pushing away from the dollar (reducing reliance on the U.S. dollar), will boost demand. Central banks added 37 tonnes in 2023!
Oxford Economics suggests 5-10% in gold ETFs like GLD for balance – we’ve covered this, so jump in! Keep an eye on Federal Reserve moves and spread your investments to handle ups and downs.