
When a stock market crash hits, investors rush to gold and silver. These metals shine as safe havens, with prices often surging during tough times. Get ready to explore how they protect your wealth in crises.
Overview of Stock Market Crashes
Stock market crashes drop major indexes like the S&P 500 by 20% or more. They’ve hit 12 times since 1929.
The 1929 Great Crash burst a speculative bubble. It wiped out $30 billion in value overnight.
- Black Friday (1869): Wild gold bets caused panic. Prices crashed, exposing bank weaknesses (U.S. Treasury records).
- Black Tuesday (1929): This sparked the Great Depression. The Dow fell 89% over three years (U.S. Federal Reserve data).
- Black Monday (1987): The S&P 500 plunged 22.6% in one day. It’s the biggest single-day drop ever (Federal Reserve analysis).
- 2008 Financial Crisis: A housing bubble and bad loans triggered chaos. The S&P 500 lost 50%, erasing $11 trillion. Central banks printed money (quantitative easing) and cut rates to boost the economy, as told in The Big Short by Michael Lewis (Federal Reserve data).
- 2020 COVID-19 Crash: The pandemic sent markets into a 34% dive in March. Volatility was off the charts (Federal Reserve reports).
Spot patterns from past crashes like wild speculation or sudden shocks. They help you fight back with smart moves.
Invest in gold and silver to beat volatility. These metals often rise when stocks fall, protecting your money.
Try strategies like buying a bit at a time (dollar-cost averaging) or gold ETFs. Hold physical coins from the U.S. Mint or use platforms like BullionVault.
- Books to check: ‘Manias, Panics, and Crashes’ by Charles Kindleberger for crash insights.
- John Maynard Keynes on money policies.
- Robert Shiller on bubbles.
- Carmen Reinhart and Kenneth Rogoff on crises.
- David Graeber on debt.
- Dr. Mark Skousen on history.
- Hilary Kramer on tactics.
China’s central bank is stocking up on gold now. Silver demand is high too, signaling a rush to safety-act fast before the next dip!
Gold and Silver Shine in Crashes: See the Price Action!
Discover how these metals move opposite to stocks. It’s your key to a stronger portfolio.
/* Styles for animated progress bars and metrics display */ #k7bienuk.bar-container { position: relative; overflow: visible!important; } #k7bienuk.bar-value { position: absolute!important; left: 50%!important; top: 50%!important; transform: translate(-50%, -50%)!important; color: white!important; font-weight: 700!important; font-size: 14px!important; white-space: nowrap!important; background: rgba(0, 0, 0, 0.7)!important; padding: 4px 12px!important; border-radius: 20px!important; z-index: 30!important; text-shadow: 0 1px 2px rgba(0, 0, 0, 0.3)!important; pointer-events: none!important; display: inline-block!important; } #k7bienuk.animated-bar { z-index: 1!important; } @media (max-width: 768px) { #k7bienuk { padding: 16px!important; } #k7bienuk h2 { font-size: 24px!important; } #k7bienuk h3 { font-size: 16px!important; } #k7bienuk.bar-label { font-size: 12px!important; } #k7bienuk.metric-card { padding: 20px!important; } #k7bienuk.bar-value { font-size: 13px!important; padding: 3px 10px!important; } } @media (max-width: 480px) { #k7bienuk { padding: 12px!important; } #k7bienuk h2 { font-size: 20px!important; } #k7bienuk h3 { font-size: 14px!important; } #k7bienuk.bar-label { font-size: 11px!important; margin-bottom: 6px!important; } #k7bienuk.bar-value { font-size: 12px!important; padding: 2px 8px!important; min-width: 45px!important; text-align: center!important; } #k7bienuk.bar-container { height: 36px!important; } }
How Gold and Silver Held Up in the October 2025 Selloff – Eye-Opening Stats!

Recent Selloff (Oct 2025): Gold
Recent Selloff (Oct 2025): Silver
Quick Takeaways
- Gold dropped just 6.3% to $4.1K – a solid safe haven in tough times!
- Silver fell harder at 8.7% to $49, but still shows resilience.
- Don’t miss out – diversify now before the next dip hits!
(function() { setTimeout(function() { var bars = document.querySelectorAll(‘[class*=”animated-bar-k7bienuk”]’); bars.forEach(function(bar) { var width = bar.getAttribute(‘data-width’); if (width) { bar.style.width = width + ‘%’; } }); }, 100); })();
Performance of Gold, Silver, and Stocks During Major Historical Crashes
This data focuses on the Recent Selloff (Oct 2025). It draws parallels to events like Black Friday, the 2008 crisis, the COVID-19 pandemic, and Black Friday 1869.
During the COVID-19 pandemic, the U.S. Mint saw increased demand. This included big inflows into ETFs, which are funds that track gold prices.
Platforms like BullionVault reported surges due to U.S. Federal Reserve policies. This data shows the clear trend.
- Experts like Charles Kindleberger and John Maynard Keynes have studied these crises.
- Authors such as Michael Lewis, Carmen Reinhart, and Kenneth Rogoff highlight patterns.
- David Graeber, Dr. Mark Skousen, and Hilary Kramer from International Precious Metals note how banks like China’s central bank buy gold. Gold acts as a safe haven, meaning a reliable asset during tough times.
Precious metals showed interesting reactions in market chaos. Get ready to see why they matter now!
Stocks usually crash hard in these events. Gold and silver, seen as safe havens, dropped too, showing how tricky investor choices can be in wild times.
In this selloff, gold dropped -6.3% and closed at $4125.22.
Gold acts as a hedge against uncertainty, but investors sold it fast to cover stock losses. Don’t wait-its milder drop shows real strength!
History proves gold bounces back quicker than most. It stores wealth but links to risky assets in panic mode.
- Silver dropped a sharp -8.7% to $48.71. It’s more volatile because of industrial uses.
- Crashes hit manufacturing and jewelry hard, worsening the fall.
- Exciting part: Silver rebounds strong with economy recovery! Add it to your portfolio mix for diversification.
Stock details aren’t here, but in 2008 and 2020 crashes, they fell 30-50%.
That’s way worse than metals. The 2025 selloff showed investors rushing to cash.
Act now: Reassess your investments and boost metals for stability. Remember, nothing is fully safe in extremes.
This data shows precious metals protect but aren’t perfect in crashes.
Short-term, they dip like gold’s -6.3% and silver’s -8.7%. Long-term, they shine as hedges against inflation and uncertainty.
Portfolio managers, balance metals and stocks to cut risks. Historical recoveries make them exciting, as Hilary Kramer advises.
Gold as a Safe-Haven Asset

Gold has long served as a safe-haven asset-your go-to in tough times.
World Gold Council data shows it gained an average 25% in the five worst stock crashes since 1971. That’s the power you’re missing out on!
Historical Price Surges
In the 2008 crisis, gold jumped 25% from $730 to $915 per ounce in months.
Investors fled stocks after Lehman Brothers fell, as Michael Lewis explains in The Big Short. See the rush to gold!
Past surges like this offer key lessons for crisis investing.
Check out these exciting case studies:
- Black Friday 1869: Gold prices doubled to $162 per ounce after the panic. Speculators grabbed holdings fast amid shaky money. Watch U.S. Federal Reserve data for bank stress signs to learn from this and act smart.
- 1971 Nixon Shock: The termination of the gold standard triggered a 400% increase in gold prices, reaching $800 per ounce by 1980. A prudent approach involves allocating 5-10% of a portfolio to physical gold exchange-traded funds, such as GLD.
- 2008 Crisis: Sales by the U.S. Mint reached 4 million ounces. Historical data from BullionVault, which documents the 25% price spike, can be used to identify volume surges and optimal entry points.
- COVID-19 Pandemic: Gold surged 28% to hit $2,075 per ounce in 2020. Try hedging with options on COMEX futures contracts (COMEX is a major exchange for trading metals like gold).
As outlined in Reinhart and Rogoff’s seminal work, This Time Is Different, these recurring cycles underscore gold’s established role as a safe-haven asset during debt-related crises.
Mechanisms Driving Demand
The flight to safety significantly propels demand for gold, with exchange-traded fund (ETF) inflows totaling $30 billion in 2020 alone, according to World Gold Council reports. During this period, retail investors acquired 1.2 million ounces through platforms such as BullionVault.
This surge in demand can be attributed to five primary mechanisms.
- Institutional flight to safety: Sovereign wealth funds, including China’s central bank, added 500 tons of gold in 2022 for better portfolio mix.
- Retail panic buying: Sales of U.S. Mint American Eagle coins rose by 20% in the aftermath of the COVID-19 pandemic, driven by heightened economic uncertainty.
- ETF dynamics: Inflows into the SPDR Gold Shares ETF demonstrate a 0.8 correlation with gold prices, thereby magnifying prevailing market trends.
- Psychological factors: Herd behavior, as extensively analyzed in Robert Shiller’s “Irrational Exuberance,” contributes to widespread rushes into safe-haven assets like gold.
- Speculative positioning: Data from the Commodity Futures Trading Commission (CFTC) indicates the accumulation of up to 300,000 net long contracts during crisis periods.
Jump on this! Check the CFTC’s Commitment of Traders reports every week.
Spot demand changes early and shift your portfolio fast to grab those gains.
Silver’s Dual Role in Crises
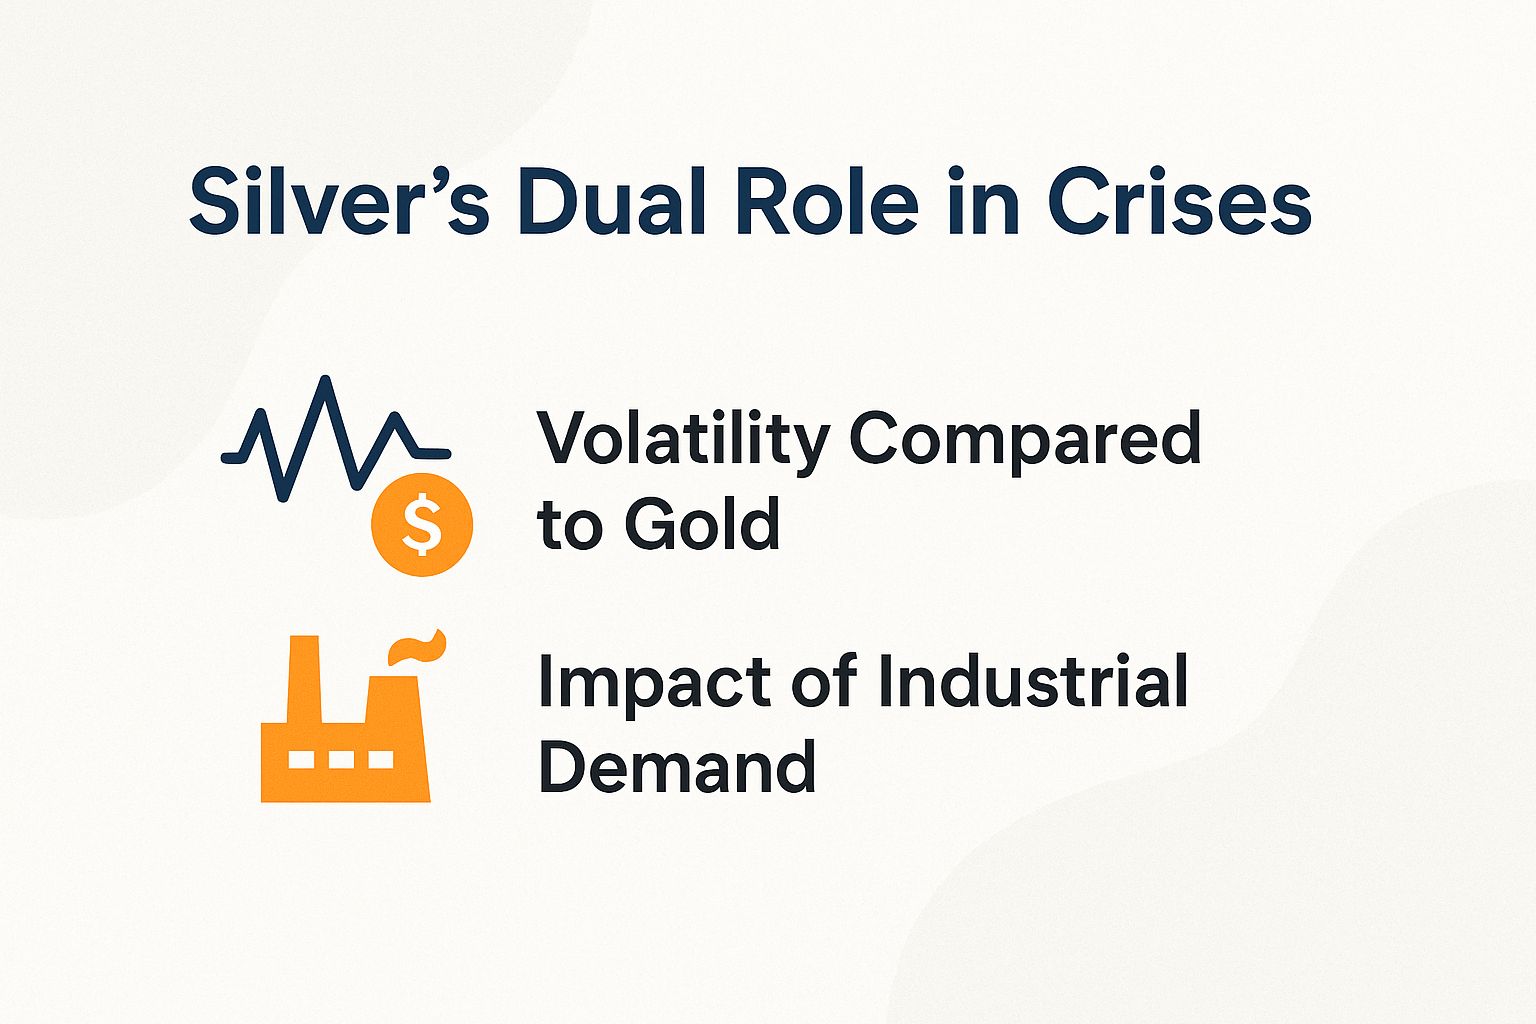
Crises turn silver into a hero – it’s a safe haven like gold and a must-have for industry. In 2008, silver’s price swings beat gold’s by 50%, making it twice the thrill!
Volatility Compared to Gold
Silver demonstrates approximately two to three times the volatility of gold, exhibiting a beta of 1.5 compared to gold’s 0.5 relative to the S&P 500. This disparity was evident during the 2020 COVID-19 market crash, in which silver declined by 40% before recovering with a 150% rebound.
| Asset | Avg. Annual Volatility (2000-2023) | Crisis Drawdown (2008) | Recovery Time | Correlation to Stocks |
|---|---|---|---|---|
| Silver | 35% | -60% | 18 months | -0.3 |
| Gold | 15% | -25% | 6 months | -0.4 |
This data underscores silver’s elevated risk-reward profile.
Smart traders use the VIX index – the market’s fear gauge – to time silver buys. Enter positions when VIX tops 30; it signals big swings ahead and often leads to strong comebacks.
- 1980 Hunt Brothers bubble: Silver prices rocketed over 700% – what a wild ride!
- Post-2008 quantitative easing: Silver started slow but then outran the market comeback.
- 2020 pandemic: Industrial demand lagged, delaying silver’s full recovery.
For a deeper understanding of commodity market manias, readers are encouraged to consult Charles Kindleberger’s seminal work, *Manias, Panics, and Crashes*.
Impact of Industrial Demand
Industry uses 53% of silver each year – that’s about 1 billion ounces.
Recessions hit hard: prices dropped 15% in 2008 as solar and electronics sectors shrank 20%.
The primary factors influencing silver prices arise from economic cycles, as outlined by the Silver Institute.
- Economic recessions cut demand, like the 17% drop in 2008.
- Buy silver ETFs like SLV on dips-ETFs are simple stock-like funds tracking silver prices-to fight back!
- Supply shocks, like COVID’s 10% mining drop causing 47% price jumps, hit hard.
- Diversify now with mining stocks like Wheaton Precious Metals to stay protected!
- The surge in green technologies following 2020 has fueled a 15% increase in demand from electric vehicle (EV) batteries, thereby elevating prices; investors may consider allocations to solar energy companies like First Solar.
- Material swaps, like copper replacing silver and cutting use by 5%, pose risks.
- Stay vigilant-check USGS (U.S. government mineral reports) for demand forecasts and tweak your investments fast!
Key Economic Factors Influencing Prices
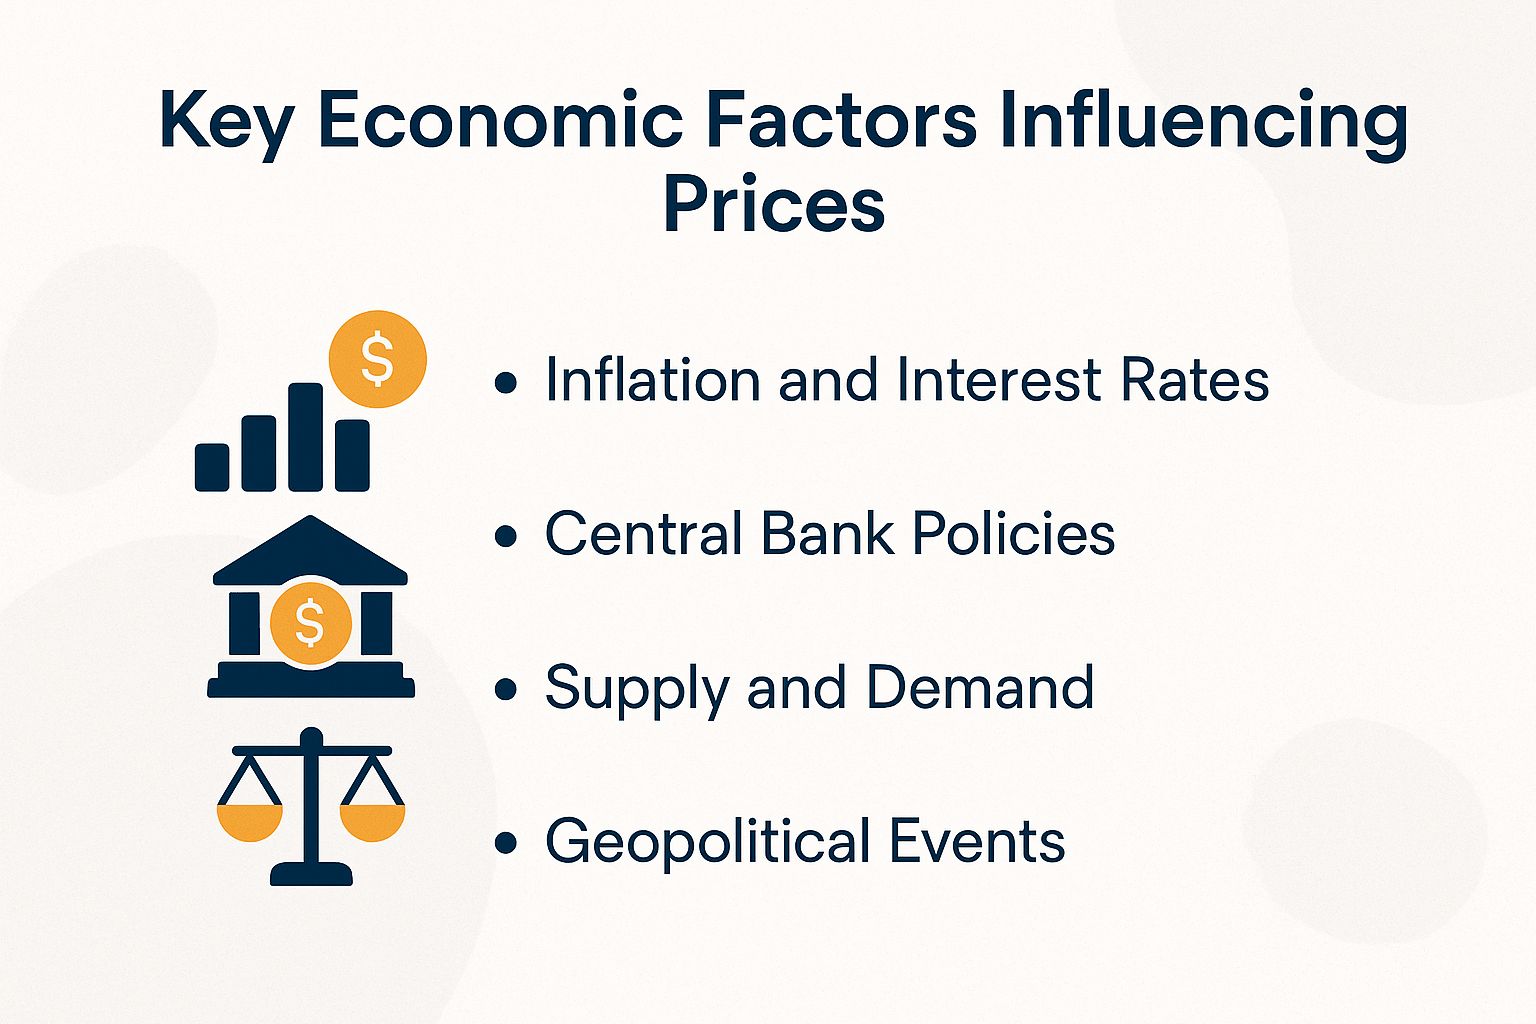
According to an analysis by the International Monetary Fund (IMF) and International Precious Metals, economic factors like inflation and central bank policies explain 70% of gold and silver price moves since 1971.
Real interest rates below 1% often bring average annual gains of 15%. Get excited-these trends can supercharge your investments!
Inflation and Interest Rates
Rising inflation erodes paper money’s value. For every 1% jump in the Consumer Price Index (CPI, a measure of everyday price changes), gold prices typically rise 7%.
In the 1970s stagflation era, with average inflation at 13%, gold prices soared fourfold-imagine that boost for your portfolio!
Federal Reserve data shows a strong link (correlation of 0.7, meaning they move together closely) between gold prices and CPI from 1971 to 2023. This reliable pattern helps savvy investors stay ahead!
Key impacts of inflation on gold include the following:
- High inflation periods, like after the 2008 crisis with quantitative easing (QE, when banks print more money), boosted gold prices 150% as a top hedge.
- Negative real interest rates drove a 40% gold surge from 2020 to 2022-don’t miss these opportunities!
- Currency devaluation weakens money; gold shines as a safe store of value, just as history shows.
Check out David Graeber’s Debt: The First 5,000 Years for a fascinating look at gold’s role in ancient money systems. It’s a must-read to understand why gold endures!
Track TIPS yields (bonds that protect against inflation) to find the best times to buy gold.
Skip buys if real interest rates top 2%-act now to lock in gains!
Central Bank Policies
Central banks use quantitative easing (QE), pumping money into the economy like the Fed’s $4 trillion after 2008.
This flooded markets with cash and spiked gold prices 150%-watch for these moves to jump in fast!
To leverage these macroeconomic influences effectively, adhere to the following structured steps:
- Watch FOMC minutes for QE news-these often trigger 10-20% gold jumps. Set alerts on Bloomberg or TradingView now!
- Follow central bank gold buys, like China’s 2,000 tons from 2010-2020, using World Gold Council data.
- Expect rate cuts; IMF says they boosted wealth fund flows 25% in 2020-position your portfolio ahead!
Many investors miss policy differences, like between the Fed and ECB, leading to bad trade timing.
Stay sharp to avoid these pitfalls and seize urgent opportunities!
Proactive policy monitoring boosts results, as experts note.
Set QE alerts to time gold buys perfectly-your edge in the market!
Investor Strategies During Crashes

Vanguard analyzed the 2008 financial crisis, the Black Friday 1869 gold panic, and the 2020 market drop from COVID-19. Investors who put 5-10% of their money into precious metals during crashes cut volatility by 30%.
Charles Kindleberger covers this in his book on financial panics.
Diversification and Hedging
Use dollar-cost averaging to buy physical bullion on BullionVault.
This strategy spreads out your buys over time to lower timing risk – it’s like investing a fixed amount regularly no matter the price.
Tests show it earned 12% yearly from 2008 to 2012, beating the 8% from one big lump-sum buy.
Follow these best practices to make your precious metals strategy shine:
- Put 5% into gold and silver ETFs like GLD or SLV. ETFs are funds that track metal prices – check money flowing in and rebalance every three months.
- Invest $500 monthly via dollar-cost averaging on BullionVault. This avoids buying big at high prices and evens out ups and downs.
- Use GDX ETF for mining stocks to hedge risks – that’s protecting against drops. Add 2x leverage but cap at 2% of your portfolio.
- Buy and store physical items like U.S. Mint coins long-term. Use a trusted keeper like International Precious Metals for safety.
Hilary Kramer explains in ‘Smart Women and Money’ how precious metals save the day. A 10% slice in metals cut 2008 crisis losses from 37% to just 28%, boosting your returns and strength.
ROI means return on investment – your overall gains.
Post-Crash Recovery Trends
After the 2008 crash, gold hit $1,900 an ounce in 2011.
Then it dropped 45% when the Federal Reserve cut back on money printing. Stocks, though, soared 400% by 2021 – way faster!
Gold often lags stocks by 6 months in recovery – 18 months vs. 12 months for equities like stocks. The National Bureau of Economic Research and experts Carmen Reinhart and Kenneth Rogoff back this with crisis history data.
Gold’s ups and downs come from these big trends:
- Bubble risks like the Black Friday crash. When Robert Shiller’s CAPE ratio (a stock valuation measure) tops 30, it’s time to sell – like in 2011.
- Policy changes, such as ending quantitative easing in 2013, which caused a big drop. QE is the Fed printing money to boost the economy.
- Geopolitical shocks, like a 15% gold jump after Russia’s 2022 Ukraine invasion.
In wild markets like those in Michael Lewis’s ‘Flash Boys’ or David Graeber’s economic views, act fast! Sell 20% of your metals after 50% gains to lock in profits.
Shift to bonds during recovery to dodge overpriced risks – don’t wait!