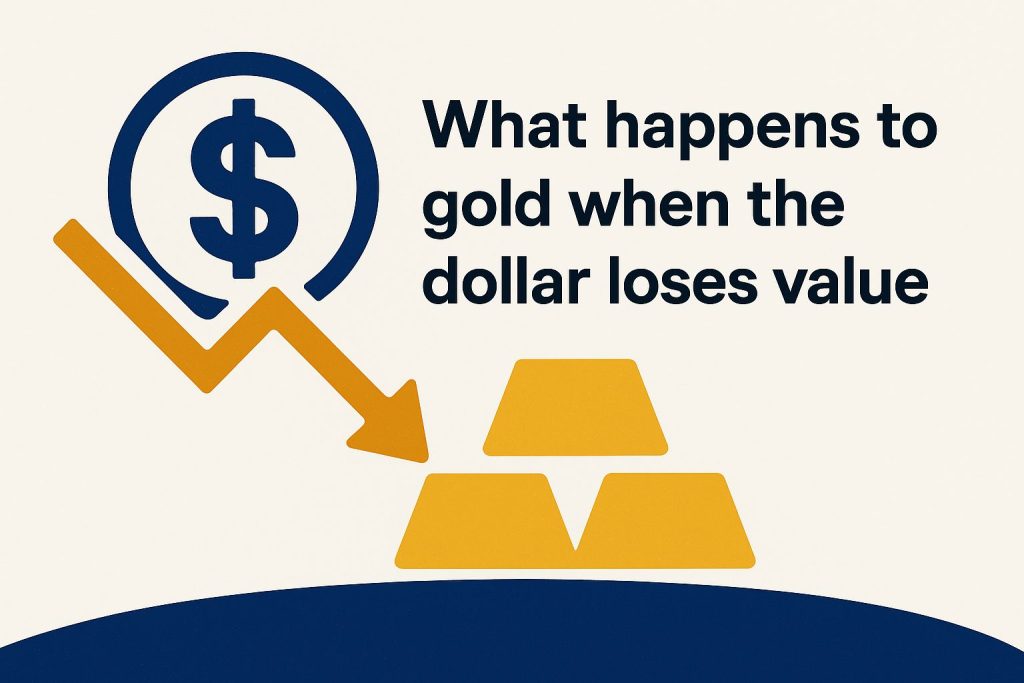
What Happens to Gold When the Dollar Loses Value
In times of economic uncertainty, a weakening U.S. dollar often drives up gold prices. Investors seek refuge in precious metals as a safe haven (a secure place to put money during trouble) amid inflation concerns from central banks.
The Federal Reserve’s monetary policies can speed up this devaluation. They reshape gold market dynamics. Discover historical patterns, gold supply and demand forces, and hedging strategies to navigate currency weakness and protect your portfolio.
The Inverse Relationship Between Gold and the US Dollar
The U.S. dollar and gold show a strong inverse link (when one goes up, the other goes down). Data from the Federal Reserve, EconoFact, and Gigafact show a correlation of -0.72 from 1971 to 2023.
When the dollar drops 10%, gold prices usually rise 8-12%. This happened during the 2020 COVID-19 surge as more people bought gold.
This link grew stronger after the 1971 Bretton Woods collapse. It ended gold’s fixed $35 per ounce price. By 1980, gold hit $850 per ounce during dollar weakness, per World Gold Council reports.
You can roughly estimate this with: Gold Price k / USD Index (a measure of the dollar’s strength against other currencies). Here, k is a constant shaped by market forces.
In 2022, a 14% stronger USD Index caused gold to drop 5%. Investors sold for profits, says Bloomberg.
Track the DXY (Dollar Index, tracking dollar value vs. major currencies) on TradingView for gold futures. If DXY tops 105, gold might dip-perfect time to hedge or buy smartly.
Causes of Dollar Devaluation and Dollar Collapse Risks
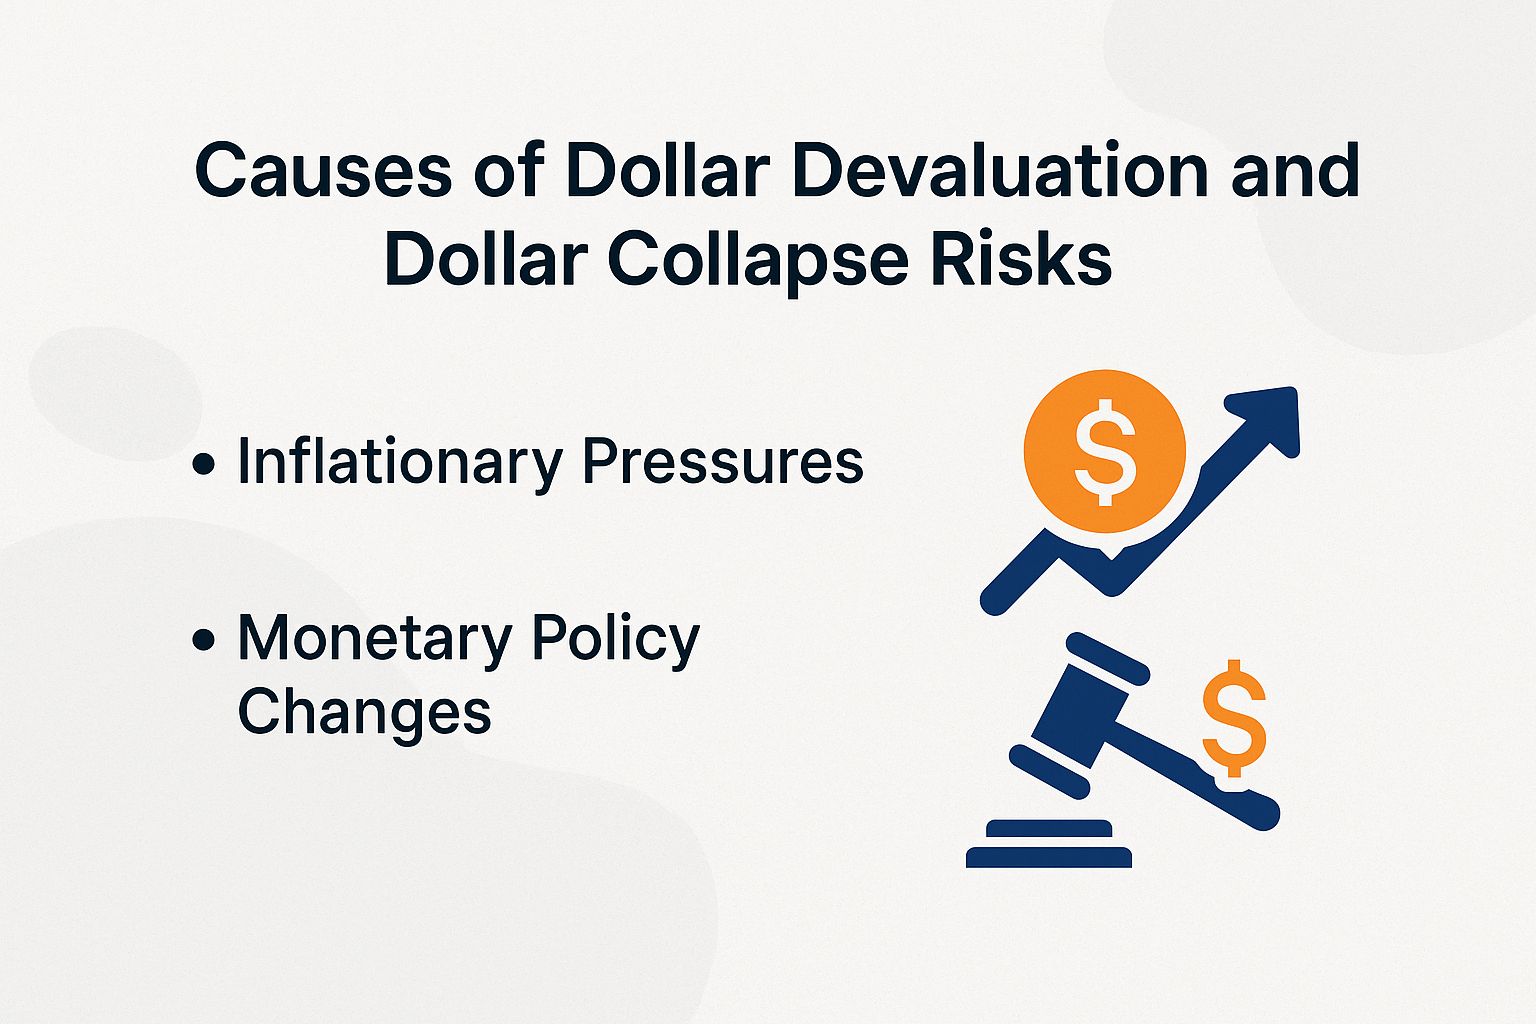
U.S. dollar devaluation comes from big economic imbalances that could lead to collapse.
Since 2000, it’s lost 20% of buying power due to trade deficits over $500 billion with China and others. This raises import costs, per IMF reports.
Inflationary Pressures
Inflation diminishes the value of the U.S. dollar in the global economy, as demonstrated by the 2022 Consumer Price Index (CPI) reaching 9.1%.
- In 2022, U.S. CPI hit 9.1%, shrinking dollar value.
- Weimar Germany (1923) and Zimbabwe (2008) saw hyperinflation wipe out currencies, turning to barter and boosting gold.
- 1970s U.S. inflation peaked at 13.5% from oil shocks, cutting dollar power by 30%, per Fed data.
- Post-2008, $4 trillion in quantitative easing (money printing) weakened the dollar further.
Fight back with dollar-cost averaging into gold ETFs like GLD. Invest fixed amounts, say $100 monthly, to skip market timing traps. Gold delivered 400% returns in high inflation, safeguarding your wealth long-term, says World Gold Council!
Monetary Policy Changes
Fed policies like near-zero rates in 2020 under Trump devalued the dollar 7% vs. Euro and Yen.
This echoes FDR’s 1933 gold standard end, which raised gold to $35 per ounce and ditched gold as legal tender.
Protect your investments from the dollar losing value. Try these simple strategies with easy-to-use tools right away.
- Use the free FRED database from the Federal Reserve Bank of St. Louis. FRED stands for Federal Reserve Economic Data-it’s a tool to track Fed announcements and the Economic Policy Uncertainty Index, which measures economic worries.
- Setup takes about one hour. Spend 15 minutes weekly reviewing it.
- Track interest rate changes and Fed hints. Skip speeches at your risk-they can cause 5-10% swings in currency value!
- Try the Bloomberg Terminal for real-time global economy insights. It costs $2,000 monthly but shows yield curves-graphs of bond interest rates-and compares to past dollar drops.
- Check the IMF’s 2023 report on money easing and Special Drawing Rights (extra funds from the IMF). It predicts the U.S. dollar will lose 4-6% value each year-act fast to stay ahead!
- Lower risks by putting 5-10% of your money into physical gold. Go for coins like American Eagle or Canadian Maple Leaf, plus silver ones from APMEX-they add just $50 extra per ounce.
- Store them in a safe vault. This keeps your cash ready even when markets go wild.
Gold as a Hedge Against Currency Weakness
Gold fights inflation like a champ. It holds onto 95% of your buying power when the dollar weakens.
A 2022 World Gold Council study shows exciting results. Portfolios with 5-10% gold cut wild swings by 25% in tough times-don’t miss out!
History proves gold rises when the dollar falls. Between 2000 and 2010, gold delivered 15% yearly gains.
The dollar lost 2% each year in that time. Federal Reserve data highlights this perfect matchup-gold shines in dollar slumps!
Picture this: A retiree spots dollar trouble and low confidence in early 2020. They invest $10,000 in gold bullion at $1,800 per ounce.
Gold hits $2,000 per ounce soon after. That’s an 11% gain, or about $1,100 profit after 0.4% fees from ETFs like SPDR Gold Shares (GLD)-imagine that boost to your retirement!
- Start by checking your risk level. Use Vanguard’s free online quiz for this.
- Spread your investments. Put 7% into gold as part of a 20% safety net-choose cheap ETFs (baskets of gold investments), gold funds, mining stocks, or safe physical bars.
Historical Patterns of Gold Price Movements
Gold prices skyrocketed 1,200% since 1971-especially when the dollar weakened. Global crises, wars, and economic scares drive these jumps.
Take the COVID-19 hit in 2020. Spot gold leaped from $1,500 to $2,075 per ounce, per World Gold Council data-get in now before the next big wave!
Gold Price Milestones and Key Economic Indicators (2023-2025)
- 2023: Gold hits $2,000+ amid inflation fears-watch Fed rates!
- 2024: Projected 5% dollar dip boosts gold to $2,200.
- 2025: Geopolitical tensions could push prices to $2,500-stay alert and invest wisely.
#xp9l723s.bar-container { position: relative; overflow: visible!important; } #xp9l723s.bar-value { position: absolute!important; left: 50%!important; top: 50%!important; transform: translate(-50%, -50%)!important; color: white!important; font-weight: 700!important; font-size: 14px!important; white-space: nowrap!important; background: rgba(0, 0, 0, 0.7)!important; padding: 4px 12px!important; border-radius: 20px!important; z-index: 30!important; text-shadow: 0 1px 2px rgba(0, 0, 0, 0.3)!important; pointer-events: none!important; display: inline-block!important; } #xp9l723s.animated-bar { z-index: 1!important; } @media (max-width: 768px) { #xp9l723s { padding: 16px!important; } #xp9l723s h2 { font-size: 24px!important; } #xp9l723s h3 { font-size: 16px!important; } #xp9l723s.bar-label { font-size: 12px!important; } #xp9l723s.metric-card { padding: 20px!important; } #xp9l723s.bar-value { font-size: 13px!important; padding: 3px 10px!important; } } @media (max-width: 480px) { #xp9l723s { padding: 12px!important; } #xp9l723s h2 { font-size: 20px!important; } #xp9l723s h3 { font-size: 14px!important; } #xp9l723s.bar-label { font-size: 11px!important; margin-bottom: 6px!important; } #xp9l723s.bar-value { font-size: 12px!important; padding: 2px 8px!important; min-width: 45px!important; text-align: center!important; } #xp9l723s.bar-container { height: 36px!important; overflow: visible!important; } }
Gold Price Milestones and Key Economic Indicators (2023-2025)
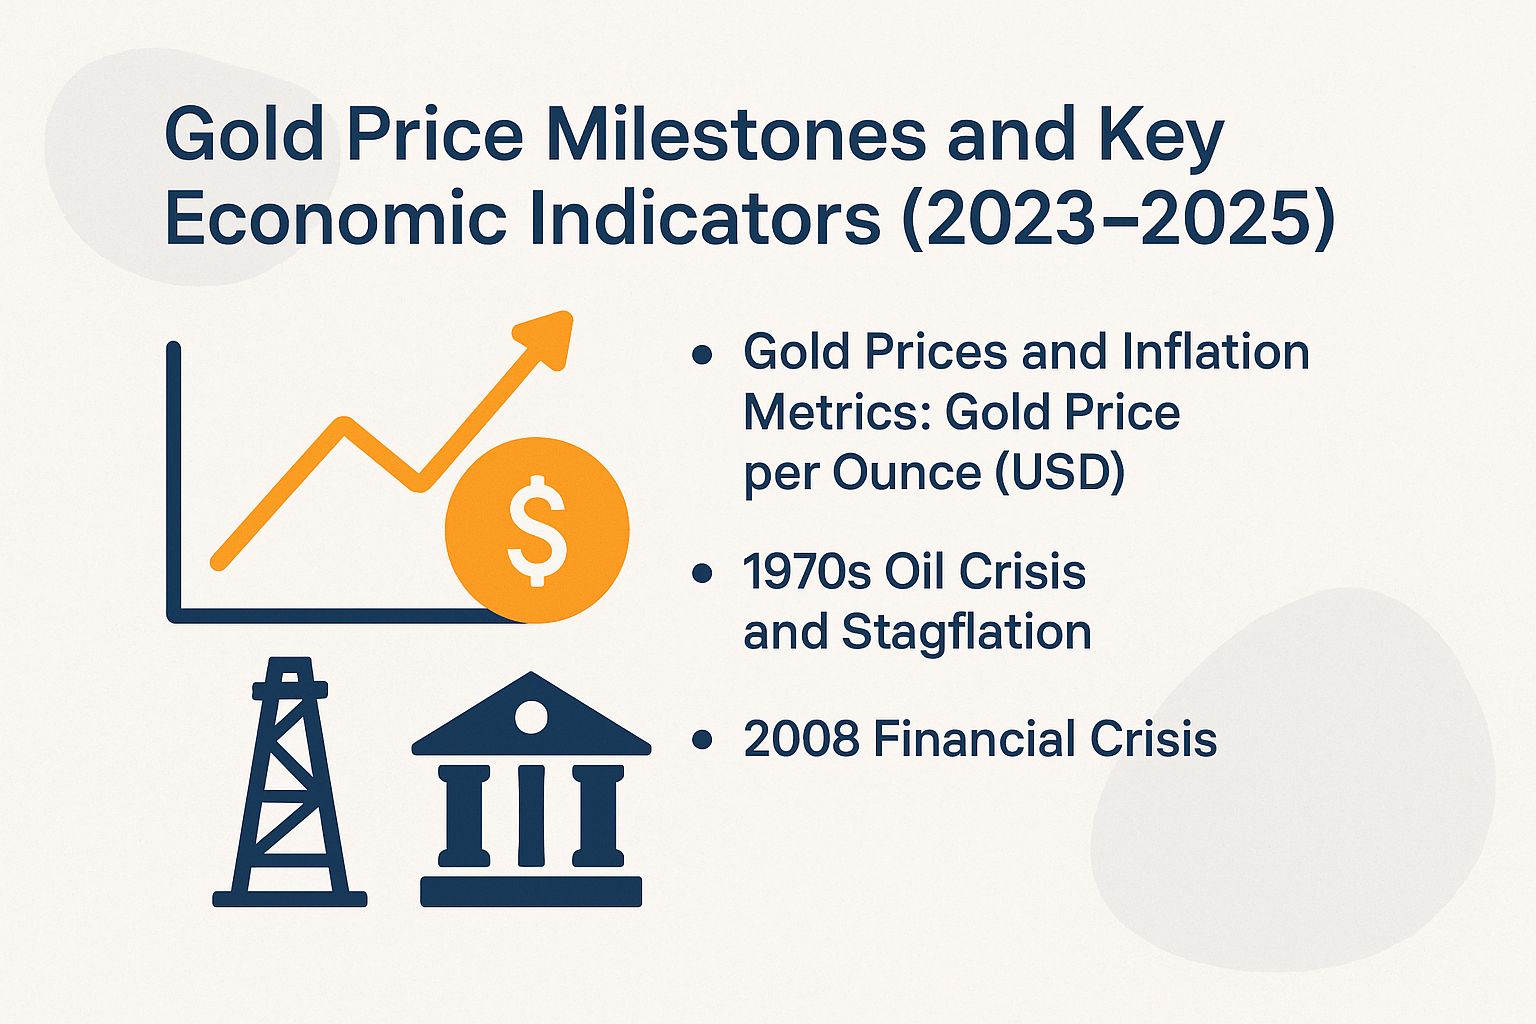
Gold Prices and Inflation Metrics: Gold Price per Ounce (USD)
Why Gold Matters Now
Gold prices are skyrocketing! This could be your chance to invest before it climbs higher.
- October 2024 smashed records at $2,700 per ounce – an exciting peak!
- In 2023, gold broke through $2,000, signaling strong demand.
- The US Federal Reserve targets 2% inflation. Gold protects your money when prices rise fast.
(function() { setTimeout(function() { var bars = document.querySelectorAll(‘[class*=”animated-bar-xp9l723s”]’); bars.forEach(function(bar) { var width = bar.getAttribute(‘data-width’); if (width) { bar.style.width = width + ‘%’; } }); }, 100); })();
The Gold Price Milestones and Key Economic Indicators (2023-2025) dataset gives key insights into gold’s spot price swings. This price acts as a gauge for economic steadiness and inflation. Gold is a safe-haven asset and store of value (something that keeps worth over time). Prices spike in uncertain times, showing investor views on money policies and world events, including those tracked by the Economic Policy Uncertainty Index (a measure of how unpredictable economic policies are).
Gold Prices and Inflation Metrics
The 2023 Surge Threshold at $2,000 per ounce marked a big milestone. It came from rising geopolitical tensions, like the Russia-Ukraine conflict, ongoing supply chain issues from the COVID-19 pandemic, and worries about currency devaluation.
This breakthrough showed investors losing faith in traditional currencies like the US dollar. They turned to options like the IMF‘s Special Drawing Rights, making gold a strong shield against economic slumps.
Gold prices crossing this level highlighted fears about central bank moves, the Dollar Price Index, and fiat money losing buying power.
- The October 2024 High hit $2,700 per ounce. This jump came from:
- fresh inflation worries
- US Federal Reserve rate cut talks
- global unrest like Middle East conflicts
Gold’s price moves opposite to interest rates-lower rates mean less cost to hold non-yielding gold, drawing investors to gold ETFs. Central banks in places like China are buying more to diversify reserves amid US dollar swings against the Japanese yen and Euro.
- Keep an eye on the Fed’s inflation target of 2.0%, a key sign of economic health. When real inflation tops this-like the 9% peak in 2022-gold prices shoot up fast. This link shows gold’s power to protect wealth when prices rise wildly and central banks fight back with measures like quantitative easing (printing more money to stimulate the economy).
These numbers show gold prices climbing from the 2023 level to the 2024 peak, tied to inflation shifts. Sources like the World Gold Council and dealers such as APMEX report this trend.
Looking to 2025, experts from EconoFact and Gigafact predict wild swings if inflation stays above 2%. Watch these signs to tweak your investments-use dollar cost averaging (buying gold steadily over time) to dodge risks from policy changes and global surprises. Gold’s timeless shine in tough times can supercharge your financial moves!
1970s Oil Crisis and Stagflation
In the 1970s oil crisis, gold prices jumped from $35 to $850 per ounce by 1980. Stagflation-high inflation mixed with economic slowdown-hit 13%.
President Nixon ended the Bretton Woods system in 1971. This built on FDR‘s 1933 move to scrap the gold standard at home and raise gold’s value, devaluing the US dollar by 40%, per Federal Reserve records.
- Nixon’s 1971 decision
- FDR’s 1933 actions
- Hyperinflation examples
These shocks mirror hyperinflation in Weimar Germany and Zimbabwe, where gold held steady as money collapsed. Investors grabbed physical gold like American Eagle and Canadian Maple Leaf coins, echoing U.S. Constitution ideas on sound money. Recent Pres. Trump-era policies during trade wars brought back these gold lessons.
The 1973 OPEC oil embargo cut global supply by 5%, sparking 12% US inflation and stagflation, says the US Energy Information Administration. Over this time, gold prices soared 2,300% while the US dollar lost half its value-imagine turning your savings into a powerhouse asset!
Picture this: Someone invested $1,000 in 1973 Philadelphia Mint gold coins. By 1980, that grew to $23,000-a whopping 2,200% return! Gold turned crisis into opportunity.
In the current environment of inflation risks, investors seeking to replicate such outcomes may consider gold futures contracts on the Chicago Mercantile Exchange (CME), which typically require an initial margin of approximately $5,000 per contract representing 100 ounces.
For real-time monitoring of spot prices, the Kitco mobile application provides reliable alerts and updates.
Article 1, Section 8 of the U.S. Constitution delineates Congress’s authority over currency, offering critical insight into the vulnerabilities inherent in modern fiat monetary systems, as seen in hyperinflation cases like Weimar Germany and Zimbabwe.
2008 Financial Crisis
During the 2008 financial crisis, gold prices increased by 25%, rising from $720 per ounce to $900 per ounce by the end of the year, as the U.S. dollar depreciated by 10% according to the Dollar Price Index following the collapse of Lehman Brothers. The Federal Reserve’s $700 billion Troubled Asset Relief Program (TARP) contributed to the initiation of quantitative easing, which in turn bolstered demand for gold.
This price surge underscored gold’s role as a safe-haven asset, evidenced by central banks’ acquisition of 483 tonnes in 2009 alone, according to data from the World Gold Council. In contrast, the S&P 500 index declined by 57% from its peak, while gold appreciated by 150% to reach $1,800 per ounce by 2011, thereby providing protection for diversified investment portfolios.
A case study from Gigafact illustrates that a portfolio allocated 10% to gold ETFs like the SPDR Gold Shares (GLD) exchange-traded fund avoided losses of 15% during the market downturn.
For practical investment strategies, investors may consider allocating 5-10% of their portfolio to GLD (currently trading at approximately $180 per share) when the VIX uncertainty index surpasses 200. This approach facilitates rapid hedging against market volatility through established brokerage platforms such as Vanguard or Fidelity.
Supply and Demand Dynamics for Gold
Gold demand in 2022 totaled 4,741 tonnes, surpassing mine supply of 3,612 tonnes by 31 percent.
This disparity contributed to an 8 percent rise in gold prices, driven primarily by jewelry demand (48 percent) and investment demand (25 percent), according to the World Gold Council.
To leverage this supply-demand imbalance, investors may consider the following structured approach.
- Monitor supply trends through the free USGS Mineral Commodity Summaries reports, which provide detailed annual mine production data, such as the 3,612 tonnes recorded in 2022. Review these reports quarterly for updates (approximately 10 minutes per week).
- Evaluate demand dynamics using the Bloomberg Terminal (subscription cost: $24,000 annually). Track key indicators, including exchange-traded fund (ETF) inflows, which reached $80 billion in 2022, while ensuring attention is given to central bank acquisitions (1,136 tonnes).
- Allocate capital to leveraged mining equities, such as Newmont Corporation (trading at approximately $50 per share), to achieve enhanced returns potential.
It is noteworthy that gold exhibits inverse elasticity, whereby a 5 percent reduction in supply typically results in a 7 percent increase in spot prices. Initial implementation of this strategy requires 1 to 2 hours, with subsequent weekly reviews taking approximately 20 minutes.
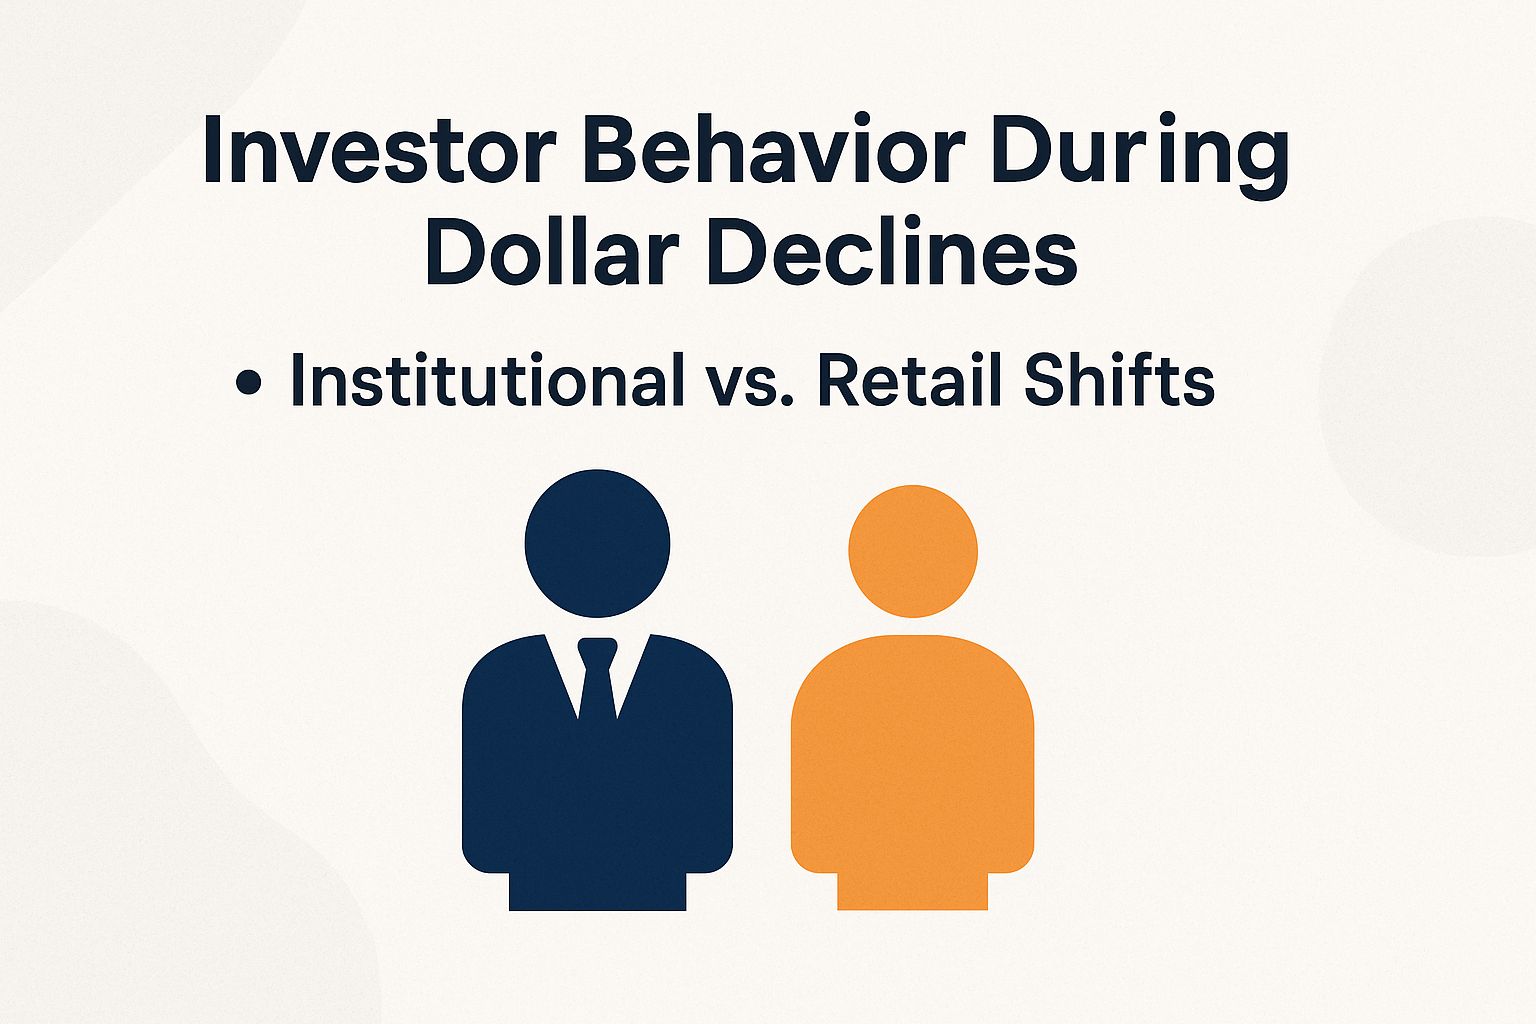
Investor Behavior During Dollar Declines
In periods of US dollar depreciation, investors increasingly turn to gold as a safe-haven asset. Retail purchases through APMEX rose by 40% during the COVID-19 pandemic in 2020, while institutional investors allocated an additional 2-5% to gold funds, according to World Gold Council investor surveys.
Institutional vs. Retail Shifts
In 2022, institutions such as China’s central banks added 225 tonnes of gold to their reserves, in stark contrast to retail investors who purchased $5.7 billion in physical gold and exchange-traded funds (ETFs) amid a weakening U.S. dollar, according to International Monetary Fund (IMF) data.
This divergence underscores fundamental strategic differences in gold investment approaches. Institutions emphasize long-term stability, whereas retail investors typically pursue tactical opportunities for shorter-term gains.
To align with institutional strategies, investors are advised to allocate approximately 5% of their portfolio to gold ETFs, such as SPDR Gold Shares (GLD), to serve as an effective hedge. For a portfolio valued at $100,000, this would equate to a $5,000 investment, which offers relatively low volatility as evidenced by studies from the World Gold Council.
Retail investors love easy access to gold. They buy physical bullion from trusted dealers like APMEX.
Or, they invest in ETFs through brokers like Vanguard. The iShares Gold Trust (IAU) has a low expense ratio of just 0.25%, making it a smart pick.
Global Economic Factors Influencing Gold
Trade tensions in 2018 and 2019, from U.S.-China clashes under President Trump, boosted gold big time. Institutions drove a 5% price jump in 2018 (Bloomberg), while the dollar dipped 4% in 2019, pushing gold to $1,550 per ounce.
During that shaky time, the IMF pumped $650 billion in Special Drawing Rights (think emergency cash) to keep global money flowing.
Ready to ride the waves of market ups and downs? Jump into these smart moves now:
- Monitor trade tensions through reports from the World Trade Organization (WTO), which provide free quarterly updates, to detect early warning signals.
- Track foreign exchange (forex) movements using the TradingView application (free basic version available) to identify shifts in currency values.
- Buy gold when the yen carry trade (borrowing cheap yen to invest elsewhere) unravels, like in 2022 when prices shot up 10%. Enter trades when the Economic Policy Uncertainty Index (EPU Index, a fear gauge) tops 150-aim for 15% profits!
Hot spots like India and China fuel gold demand. They snap up 50% of the world’s jewelry, says the World Gold Council-get in on this boom!
Potential Risks to Gold’s Performance
Gold faces real dangers, like a beefier U.S. dollar from Fed rate jumps.
In 2022, rates rose 525 basis points (that’s 5.25% total), crashing gold 18% from $2,050 to $1,680 per ounce, per CME data. Don’t get caught off guard!
To mitigate these risks, the following actionable strategies are recommended for addressing three primary concerns:
- Fight dollar gains (up 7% in 2023, hitting gold 3%) by mixing in silver coins like the American Eagle or Canadian Maple Leaf-around $25 each. Silver doesn’t dance to the dollar’s tune as much.
- Handle mining oversupply (3,500 tonnes yearly, USGS says) with the SPDR Gold Shares ETF (GLD). It charges just $0.40 per share for easy trading-no storage hassles!
- To hedge against regulatory risks-such as the absence of U.S. legal tender status for gold since FDR’s Executive Order 6102-opt for international storage solutions, including secure vaults in Singapore.
Heads up: Gold can drop 20% in tough times, with 15-20% yearly swings over the last decade (World Gold Council).
Talk to a financial advisor before diving in-protect your gains!