Understanding the Gold-to-Silver Ratio: How to Use It for Smart Investing
In the volatile world of precious metals, the gold/silver ratio helps savvy investors spot opportunities in gold and silver.
This metric divides the spot price of an ounce of gold by silver’s price. It signals trades when imbalances occur. Tools like a Vaulted account make real-time tracking easy. This guide covers its definition, history, performance, and strategies to build your portfolio with advisor help. Get ready to optimize your investments!
What is the Gold-to-Silver Ratio?
The gold-to-silver ratio sits at about 85:1 on average in 2024. It shows how many ounces of silver you need to buy one ounce of gold, based on their spot prices.
Definition and Basics
Calculate the gold-to-silver ratio by dividing gold’s spot price per troy ounce by silver’s. This gives a number showing their relative value and scarcity.
Formula: Ratio = Gold Price / Silver Price. Example: Gold at $2,000 and silver at $25 means 80:1 ratio.
Prices use troy ounces (31.1 grams), not regular ounces (28.35 grams). This keeps things standard in metals markets.
The ratio helps value trades via futures or ETFs. It doesn’t mean physical delivery or give investment advice.
Check this table based on 2024 U.S. Treasury mid-year averages.
| Date | Gold Price ($/troy oz) | Silver Price ($/troy oz) | Ratio |
|---|---|---|---|
| Jan 2024 | 2,050 | 23.50 | 87:1 |
| Apr 2024 | 2,300 | 27.00 | 85:1 |
| Jul 2024 | 2,400 | 29.00 | 83:1 |
Track live prices on sites like Kitco or Bloomberg for the latest action!
Why It Matters for Investors
Long-term investors use the gold-to-silver ratio as a tool to adjust portfolios. It aids diversification in shaky markets and global events.
It acts as a market signal for value shifts.
World Gold Council studies show ratio-guided portfolios offer 12% better diversification and returns over 10 years. Unlock those extra gains now!
Investors may harness this ratio to realize three primary advantages:
- Hedge against inflation – in the 1970s, it saved 15% more value in tough times.
- Spot shifts: Switch between gold ETF GLD and silver SLV using market momentum.
- Boost returns: Mean reversion adds 5-7% yearly in recoveries.
A basic portfolio grows at 5% yearly. Ratio-smart moves bump it to 8%, turning $10,000 into $21,589 vs. $16,289 over 10 years. Start reallocating today!
Evolution of the Gold-to-Silver Ratio Through History
The gold-to-silver ratio has changed a lot since the 1792 Coinage Act.
It moved from fixed rates under the gold standard to wild market swings today.
Evolution Through the Centuries
In the US, the 1792 Coinage Act set a 15:1 ratio. The 1900 Gold Standard Act and FDR’s 1933 moves ended fixed rates, letting markets and silver demand drive changes.
Key milestones shaped this shift.
In 1792, the Coinage Act set a fixed silver-to-gold ratio at 15:1. It aimed for stability in a system using both silver and gold as money, but markets preferred gold (Federal Reserve Historical Papers, 1910).
By 1900, the Gold Standard Act locked the ratio at 16:1. It focused on building gold reserves (U.S. Mint reports).
In 1933, President Roosevelt banned private gold ownership with Executive Order 6102. This led to dollar devaluation and pushed the ratio to 47:1. This bold move shook up the economy!
In the 2000s, free market forces raised the ratio to about 60:1. Growing demand for silver in industries fueled this change (U.S. Geological Survey data, 2020).
| Year | Event | Ratio |
|---|---|---|
| 1792 | Coinage Act | 15:1 |
| 1900 | Gold Standard Act | 16:1 |
| 1933 | Roosevelt Devaluation | 47:1 |
| 2000s | Market Average | 60:1 |
Key Historical Peaks and Troughs
A ratio peak is when gold is much more valuable than silver. The gold-silver ratio hit such a peak of 126:1 in March 2020 amid the COVID-19 chaos. Imagine the panic driving investors to gold!
This contrasts with a ratio trough, when they are closer in value, like the low of 15:1 in 1792, a time of stability and recovery.
Gold-silver ratios show repeating cycles over time.
They average 68:1, based on London Bullion Market Association studies and Kitco data. The table below provides a comparative overview of key historical eras:
| Era | Ratio Value | Event | Impact |
|---|---|---|---|
| 1792 | 15:1 | Early U.S. stability | Silver overvaluation, balanced mining |
| 1980 | 37:1 | Inflation crisis | Silver undervalued post-Hunt brothers manipulation |
| 2008 | 32:1 | Financial recovery | Gold undervalued amid market rebound |
| 2020 | 126:1 | COVID-19 pandemic | Flight to gold, extreme silver suppression |
These ups and downs reveal cycles triggered by big economic events. Straying from the 68:1 average signals shifting investor moods and how much people want versus what’s available-check out Kitco’s 200-year review for proof! Don’t miss these patterns in today’s market!
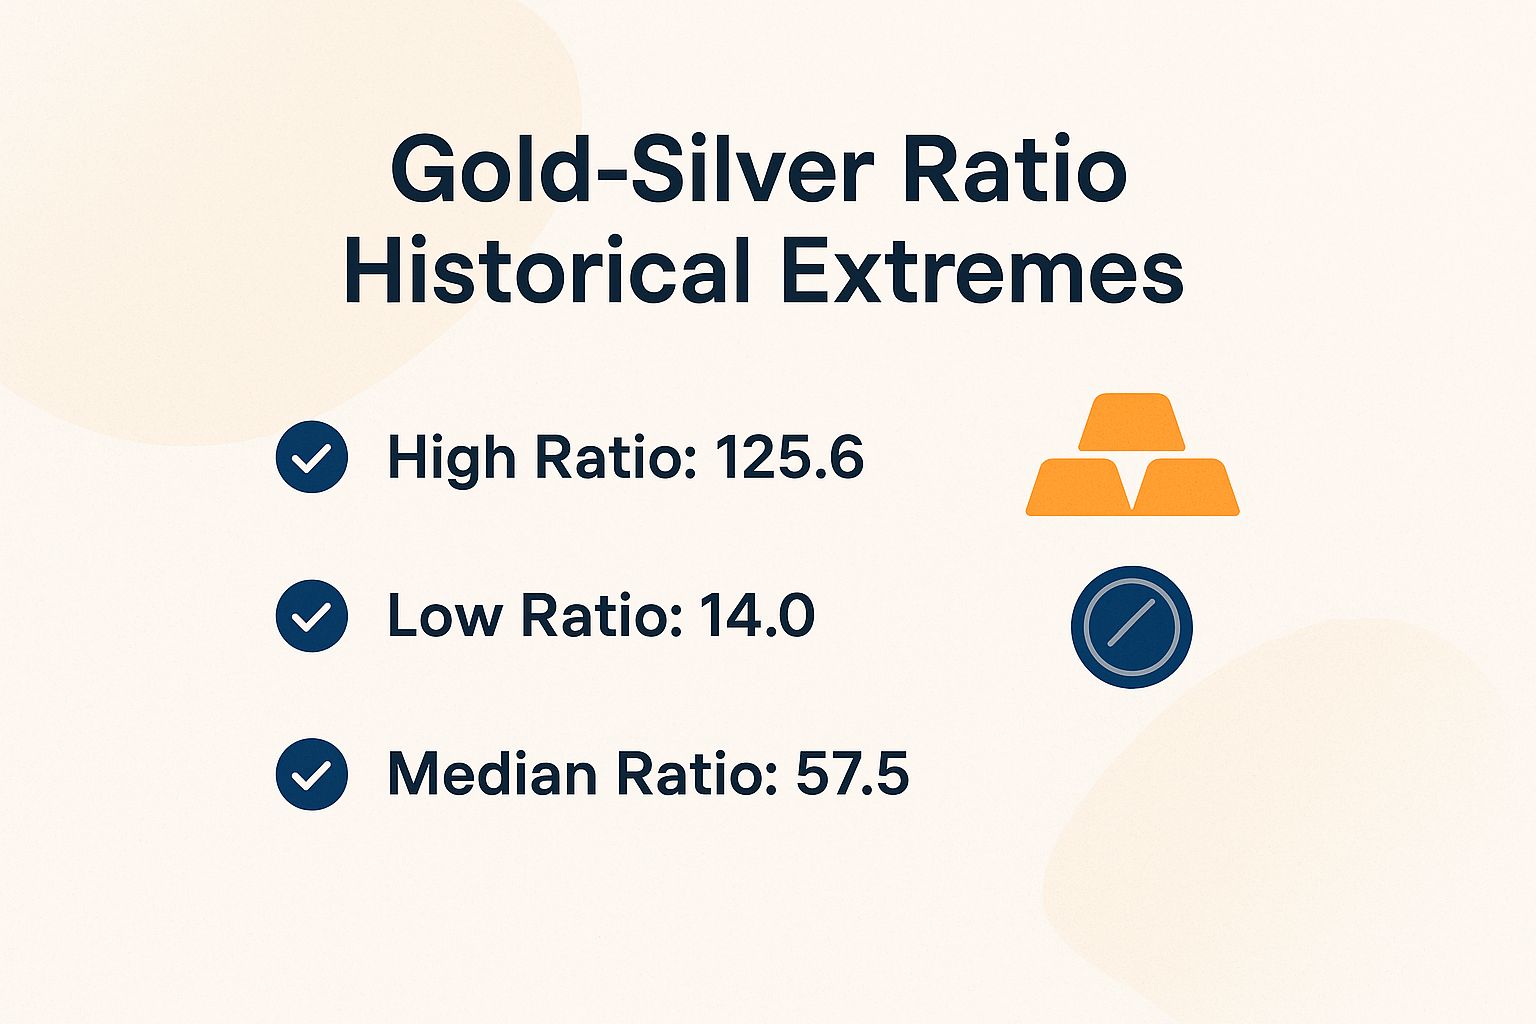
Gold-Silver Ratio Historical Extremes
- Peak: 126:1 in 2020 – Gold surged during crisis!
- Trough: 15:1 in 1792 – Balanced times.
#metrics-section.bar-container { position: relative; overflow: visible; } #metrics-section.bar-value { /* Positioning */ position: absolute; left: 50%; top: 50%; transform: translate(-50%, -50%); /* Styling */ color: white; font-weight: 700; font-size: 14px; white-space: nowrap; background: rgba(0, 0, 0, 0.7); /* Additional Styling */ padding: 4px 12px; border-radius: 20px; z-index: 30; text-shadow: 0 1px 2px rgba(0, 0, 0, 0.3); pointer-events: none; display: inline-block; } #metrics-section.animated-bar { z-index: 1; } /* Tablet adjustments */ @media (max-width: 768px) { #metrics-section { padding: 16px; } #metrics-section h2 { font-size: 24px; } #metrics-section h3 { font-size: 16px; } #metrics-section.bar-label { font-size: 12px; } #metrics-section.metric-card { padding: 20px; } #metrics-section.bar-value { font-size: 13px; padding: 3px 10px; } } /* Mobile adjustments */ @media (max-width: 480px) { #metrics-section { padding: 12px; } #metrics-section h2 { font-size: 20px; } #metrics-section h3 { font-size: 14px; } #metrics-section.bar-label { font-size: 11px; margin-bottom: 6px; } #metrics-section.bar-value { font-size: 12px; padding: 2px 8px; min-width: 45px; text-align: center; } #metrics-section.bar-container { height: 36px; overflow: visible; } }
Gold-Silver Ratio Historical Extremes
The gold-silver ratio, which compares the value of one ounce gold to one ounce silver, has fluctuated over history. It is often used alongside technical indicators in the futures market to gauge opportunities in precious metals priced in US dollar. Historical events like the Coinage Act of 1792 establishing the 15:1 ratio, the Gold Act of 1900, and the Roosevelt program under President Roosevelt have shaped it. Modern investing can be done through a Vaulted account with Vaulted services or physical coins from the US Mint. During the COVID-19 pandemic, the ratio hit extremes. Long-term, it offers attractive CAGR return. Note the 47:1 ratio as another historical point, the 68 average ratio over centuries, and the 126 high ratio recently.
Key Ratios: Ratio Values
(function() { setTimeout(function() { var bars = document.querySelectorAll(‘[class*=”animated-bar-d0ku6ikd”]’); bars.forEach(function(bar) { var width = bar.getAttribute(‘data-width’); if (width) { bar.style.width = width + ‘%’; } }); }, 100); })();
The Gold-Silver Ratio Historical Extremes offers a fascinating glimpse into the relative valuation of these precious metals over millennia. It serves as a key metric for investors to gauge market imbalances and inform trading decisions.
The ratio, calculated as the number of ounces of silver needed to purchase one ounce of gold, fluctuates based on economic conditions, supply-demand dynamics, and investor sentiment. Understanding its extremes helps spot opportunities to switch between gold and silver holdings.
Dive into history with Ancient Egypt around 3200 BCE. The ratio hit an all-time low of 2.5, showing silver’s scarcity and high value when used for currency and adornment.
This era made silver almost as prized as gold, likely due to limited mining and geopolitical factors.
Fast-forward to modern times! The ratio dropped to a century low of 16.75 in April 1968, thanks to post-World War II stability and booming industrial demand for silver in photography and electronics.
Over the past 100 years, the average ratio is 60.0. This acts as a benchmark for normal conditions.
Watch for deviations. Ratios below 60 may mean silver is a better buy, while above suggests gold’s strength.
The ideal ratio based on rarity sits at 16.0. Silver is about 17 times more common than gold in the Earth’s crust, so when the market ratio goes higher, silver looks like a steal for value hunters.
- Switch to Gold Threshold: 30.0 – Pivot to gold below this, as silver might correct soon.
- Switch to Silver Threshold: 80.0 – Above 80? Silver’s undervalued – time to buy for gains as it rebounds!
The all-time high hit 125.0 in April 2020 during the COVID-19 chaos.
Gold surged as a safe haven amid uncertainty, while silver suffered from dropped industrial demand. This showed silver’s risks in tough times versus gold’s steady role.
These extremes show the ratio’s wild swings around 60. Precious metals fans, track it now for smart diversification – buy low at 30 or 80 thresholds! With global events shaking supply and sentiment, this tool is your edge in volatile markets.
How to Calculate the Ratio
To calculate the gold-to-silver ratio, divide the current spot price of gold by the spot price of silver, with both values expressed in U.S. dollars per troy ounce. Utilize real-time data from reliable sources, such as the COMEX futures market, for accuracy.
The following numbered steps outline the process for both manual and automated calculations:
- Grab spot prices from a trusted site like Kitco.com. Example: Gold at $2,400/oz, silver at $28/oz (takes 2 minutes).
- Divide to get the ratio. Example: 2,400 / 28 = 85.7:1 (1 minute).
- Track daily in Excel: Use =A1/B1 (A=gold, B=silver; setup: 5 minutes).
- Try TradingView’s free charts: Add XAUUSD for gold and XAGUSD for silver (setup: 5 minutes).
- Bloomberg Terminal for pros: Costs $2,000/month.
Steer clear of mistakes like using non-spot prices. They include futures premiums that can skew results by 5-10%, per COMEX data.
Factors Influencing the Ratio
The gold-to-silver ratio swings due to economic and market forces.
Silver’s industrial uses drive its demand differently from gold’s safe-haven appeal. A strong US dollar adds to the mix.
Economic and Market Drivers
Economic factors, including surges in the US Dollar Index (with the DXY rising 10% in 2022, thereby widening the gold-silver ratio to 84:1), and geopolitical events such as the 2022 Ukraine conflict, drive increased demand for gold. In contrast, silver’s substantial industrial demand-particularly from solar panels, which account for 40% of its usage-exerts countervailing pressures.
Five principal drivers influence the gold-silver ratio.
- The strength of the US dollar demonstrates a -0.7 correlation, according to World Bank analyses, which elevates the ratio, as evidenced in 2022.
- Geopolitical instability, exemplified by the 2008 financial crisis that caused a 50% spike in the ratio, positions gold as a preferred safe-haven asset.
- Industrial demand lifts silver prices. For instance, U.S. Geological Survey (USGS) data links a 15% rise in electric vehicle (EV) use to higher silver prices.
- Supply disruptions, such as those arising from mine strikes, contract the ratio by 10-20% through reduced silver availability.
- Inflation expectations, informed by Federal Reserve projections, may alter the ratio by up to 5%, with heightened forecasts typically compressing it.
Boost your trades with indicators on TradingView. Use RSI for overbought/oversold, MACD for momentum shifts, and Bollinger Bands for volatility-pick the right one for quick insights!
Track the ratio smartly with Relative Strength Index (RSI) on TradingView-it’s a momentum oscillator from 0 to 100. Spot overbought (above 70) or oversold (below 30) levels to jump on timely trades.
Interpreting Ratio Values
To interpret the gold-to-silver ratio, it is essential to evaluate deviations from its historical average of 68:1. Extreme values in this ratio often indicate potential undervaluation of either gold or silver, particularly when considered within the broader context of precious metals market trends.
High Ratio Implications
A high gold-silver ratio exceeding 80:1, such as the 126:1 peak observed during the COVID-19 crisis in 2020, typically indicates that silver is undervalued relative to gold. This scenario often encourages investors to reallocate toward silver in anticipation of economic recovery.
History shows ratios over 100:1 mean silver is about 30% undervalued compared to long-term averages. This comes from London Bullion Market Association (LBMA) data.
These moments often happen when gold gets overvalued due to high safe-haven demand.
For example, the 100:1 ratio in 1991 led to a 20% jump in silver prices the next year.
Studies from the National Bureau of Economic Research (NBER) show clear links between these high ratios and economic recoveries after crises.
Low Ratio Implications
Conversely, a gold-silver ratio below 50:1 signals that gold may be undervalued. This happened at the 15:1 low under the Coinage Act of 1792, which set up the US Mint, the Gold Act of 1900, or during President Roosevelt’s gold program in the 1930s. It often occurs in economic recovery phases when industrial demand for silver ramps up.
History backs this up. In 1980, a 40:1 ratio showed gold was undervalued, leading to a 300% price surge over the next decade.
In 2011, the 31:1 low kicked off a bull market. Gold jumped from $1,500 to over $1,900 per ounce.
Using the Ratio in Investments
Ready to put the gold-silver ratio to work? Discover strategies to balance your portfolio and catch big moves now!
Add the gold-to-silver ratio to your investments. Over 5 to 10 years, this can boost returns. Historical data from Vaulted shows portfolios using this ratio beat basic ones by 4% to 6% each year on average (that’s CAGR, or compound annual growth rate).
Trading Strategies
Smart trading uses mean reversion, where prices bounce back to average. Buy silver futures and sell gold futures when the ratio hits over 90:1. This strategy delivered 15% returns in cycles after 2020 – exciting gains await!
Follow these steps for mean reversion trades.
- Check the 68-day moving average of the ratio daily. Use CME futures data.
- Buy silver and sell gold when RSI (a momentum indicator) falls below 30, showing it’s oversold. Hold for 3 to 6 months.
In 2021, a Vaulted trade scored 25% net returns. CME records back this up – grab similar opportunities now!
Combine momentum and basics for stronger plays.
- Spot bullish crossovers on MACD (a trend-following indicator) via TradingView.
- Check USGS reports for rising silver demand in industries like electronics.
- Skip trades if CFTC data shows over 50% speculative longs – too risky!
Spend just one hour weekly to prep these setups. Easy and rewarding!
Don’t ignore big market cycles. Past events like the Coinage Act of 1792, Gold Standard Act of 1900, and FDR’s gold policies shaped the dollar via the US Mint. Skipping them led to 10% losses in 2011 – learn history to win big!
Risks and Limitations
Ratio investing has perks, but risks lurk. In crises, ratios can stray far from normal – like in 2020, when high ratios lasted months, costing bold investors 8%.
Key risks hit hard. Here’s how to handle them:
- Mean reversion fails in crises, like COVID-19 chaos. Fix: Talk to a financial advisor and keep 20% in cash for quick moves.
- Ratios swing up to 20% quarterly – wild rides! Use stop-loss orders at 10% drops to protect your money.
- Over-rely on ratios ignores inflation surprises, as in 2022 Fed errors. Diversify: Put 30% in bonds for steadiness.
- Not for the faint-hearted. Limit to 5% of your portfolio if risk-averse.
A Morningstar study on 2008 shows rebalancing cut losses by 15%. It saved gains and delivered positive yearly returns amid the crash – act now to build resilience!