In an era of quiet financial rebellion, central banks, including the People’s Bank of China in Beijing, to Braslia are making gold purchases at record paces, sidelining the US dollar that long reigned supreme. This shift underscores vulnerabilities in dollar dominance-fueled by soaring inflation, ballooning U.S. debt, and weaponized sanctions-while highlighting gold’s timeless inflation hedge against uncertainty. Discover the historical roots, geopolitical drivers, and profound implications reshaping global finance.
Historical Context of Dollar Dominance
The dominance of the U.S. dollar originated with the 1944 Bretton Woods Agreement, which established a gold standard system pegging international currencies to the dollar, itself convertible to gold. This framework positioned the USD as the world’s foremost reserve currency, accounting for more than 70% of global reserves by the 1970s.
This monetary system underwent significant evolution through pivotal historical developments. In 1971, the Nixon Shock terminated the dollar’s gold convertibility, enabling money printing to float freely as a fiat currency. This shift enhanced U.S. adaptability in international trade but introduced heightened risks of inflation.
During the 1970s, the petrodollar system further solidified the dollar’s status in exchange rates, as oil-exporting countries under the Organization of the Petroleum Exporting Countries (OPEC) began pricing oil exclusively in USD. According to International Monetary Fund (IMF) data, the dollar’s share of global reserves reached a peak of 71% in 2000.
Economist Barry Eichengreen has observed that “the dollar’s hegemony rests on its network effects in trade and finance.”
Following 1971, the transition to fiat currency facilitated the United States’ ability to finance deficits more efficiently through deficit spending, thereby supporting global financial stability while also revealing potential weaknesses, such as the risks associated with currency wars and trade wars. For illustrative purposes regarding reserve compositions, one might envision a line chart depicting the USD’s consistent range of 60-70% from 1980 to 2020, even as the euro and Chinese yuan gained prominence.
Economic Pressures on the Dollar
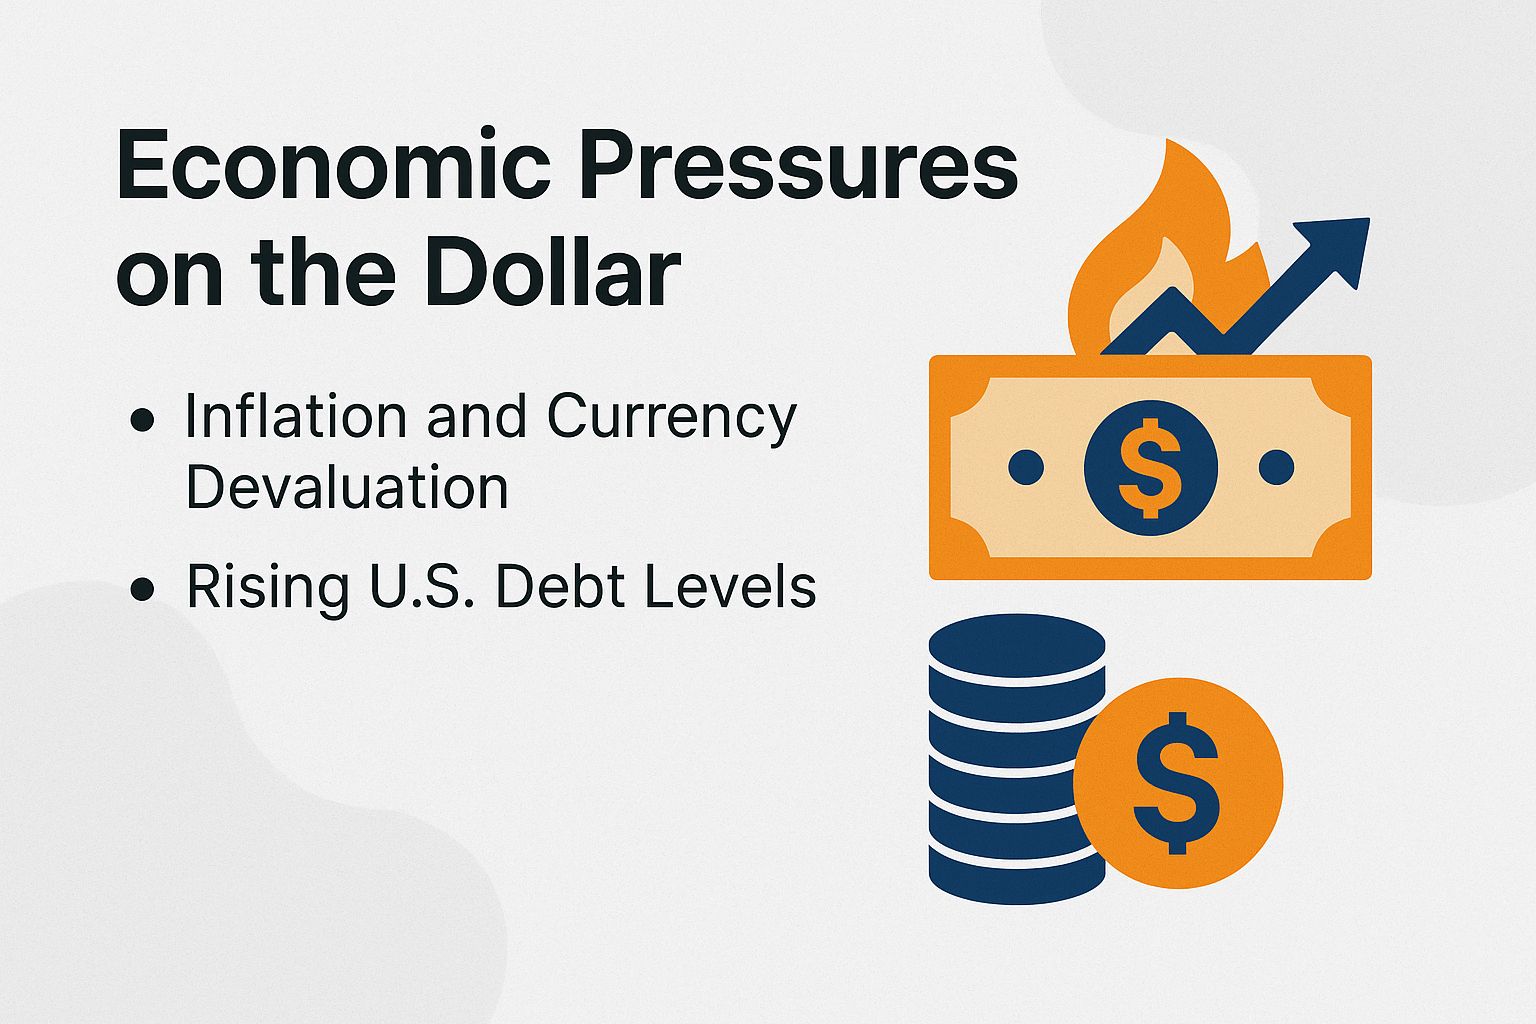
The U.S. dollar is confronting escalating economic challenges, as evidenced by inflation peaking at 9.1% in June 2022 according to Federal Reserve data as economic indicators. This development is diminishing the currency’s value and encouraging central banks worldwide to pursue currency diversification in their reserves by reducing reliance on USD-denominated assets.
Inflation and Currency Devaluation
In 2022, U.S. inflation reached 9.1%, the highest level in four decades according to the Bureau of Labor Statistics, resulting in a 20% devaluation of the U.S. dollar against major currencies. This development prompted central banks, such as the Reserve Bank of India, to increase their gold holdings by 25% as a safeguard against inflation.
This pattern is consistent with broader Consumer Price Index (CPI) trends, as Bureau of Labor Statistics reports indicate CPI inflation as an average inflation rate of 4.1% in 2023-lower than the previous peak but still diminishing purchasing power. The Federal Reserve’s monetary policy, including quantitative easing programs (QE1 through QE3) from 2008 to 2014, expanded its balance sheet by $4 trillion, contributing to comparable currency devaluations and PPI metrics.
Historically, the stagflation of the 1970s led to a 50% erosion amid unemployment rates of the U.S. dollar’s value, as documented in economic analyses. For central banks, the World Gold Council advises allocating 5% to 10% of reserves to gold for liquidity management as a protective measure against inflation.
A 2022 International Monetary Fund paper on the risks of currency devaluation underscores average reserve losses of 15% in high-inflation environments. To mitigate such risks, it is advisable to monitor inverted yield curve inversions, including those observed in 2022 and 2023, in order to anticipate potential devaluation amid forward guidance and proactively adjust investment portfolios.
Rising U.S. Debt Levels
The United States’ national debt hit over $34 trillion in 2023. That amount tops 120% of the gross domestic product (GDP), a key measure of the country’s economic output, per U.S. Treasury data.
This huge debt raises worries about long-term financial health for governments and funds. Countries like Turkey are diversifying by bringing home assets like gold-Turkey grabbed back 90% of its reserves in 2017 to cut risks.
The debt-to-GDP ratio jumped from 100% in 2019 to 123% in 2023. Projections from the Congressional Budget Office show this trend continuing.
This spike brings big dangers. Key risks include:
- Debt ceiling fights, like the 2023 near-miss that could shrink GDP by 1-2% (Moody’s estimate).
- Higher bond yields and trade gaps, pushing the 10-year Treasury yield to 5% as rates climb.
A 2023 Peterson Institute study warns: the U.S. debt path is unsustainable! Without big changes like reforms and budget cuts, trouble looms ahead.
Central banks can fight back by cutting U.S. dollar bond holdings 10-15% each year. They shift to gold and other metals for safety.
Poland grabbed 130 tonnes of gold in 2022. This move handled extra cash flows and boosted their backup plan.
In the last 10 years, gold beat ups and downs in mining to give 8% average yearly returns. That’s way better than the 2% from U.S. Treasuries-gold ETFs are an easy way in, and it’s a smart shield against wild market swings!
Geopolitical Motivations for Diversification

Geopolitical fights are heating up. The U.S. sanctions on Russia in 2022 over Ukraine froze $300 billion in reserves (SWIFT data), speeding up BRICS nations’ push away from the dollar for more control.
Sanctions and Financial Weaponization
The 2022 U.S.-led sanctions on Russia froze about $300 billion in dollar assets (European Central Bank data). This showed how finance can be a weapon.
Russia fought back by boosting gold reserves to 2,300 tonnes by 2023. The Central Bank of Russia confirmed this in surveys.
Past cases show the same pattern. Sanctions on Iran in 2018 led to 20% more trade in Chinese yuan, as discussed at G20 meetings (Bank for International Settlements data).
Venezuela lost $7 billion in assets to seizures in 2019 (IMF records). This hit hard, worsening hyperinflation-a runaway price spike.
Russia sold off $80 billion in U.S. Treasury bonds in 2022 as a defense move.
A 2021 Harvard study found sanctions fail 70% of the time. They often push countries to ditch the dollar faster and use IMF’s Special Drawing Rights for global aid.
Countries are striking back with smart moves.
Standout options include:
- Gold-backed deals, like the $10 billion China-Russia pact in 2023.
- New payment networks, such as China’s CIPS to skip SWIFT for steady finances.
Turkey brought $40 billion in gold home to Istanbul in 2020 after sanctions. This strengthened their independent reserves.
Shift Toward Multipolarity
BRICS grew big in 2023 by adding Saudi Arabia amid Middle East drama. It now covers 42% of the world’s people, with recession worries rising (World Bank).
This move signals a world with more power players. Since 2018, BRICS countries cut U.S. dollar use in trade by 28% due to shaky stocks (IMF data).
Several forces fuel this change. They include:
- Growing distrust in one dominant currency.
- Push for fairer global trade.
- Need to dodge sanctions risks.
- BRICS initiatives in the Asia-Pacific, like the New Development Bank, loaned $32 billion since 2014. These funds support infrastructure in non-USD currencies, cutting dollar reliance through stimulus packages.
- Bilateral trade deals boost non-dollar exchanges. For example, India and Russia hit $10 billion in rupee-ruble trade for energy and goods in 2022, dodging the USD during the pandemic.
- China pushes the yuan globally. Its share in the SWIFT system (a global payment network) jumped from 1% in 2015 to 4% in 2023, per central bank data.
A 2023 Brookings Institution report warns of risks to the USD’s dominance. Multipolarity threatens its hold on assets like yen and pound sterling.
Central banks should shift 20% of reserves to local currencies for stability. Hungary repatriated gold in 2022 amid EU tensions to cut volatility risks.
Gold’s Appeal as a Reserve Asset

The role of gold as a safe-haven asset has become increasingly prominent. According to data from the London Bullion Market Association (LBMA), spot gold prices rose by 25% in 2023, reaching $2,000 per ounce.
This surge pulls central banks toward gold. They want stability as forex markets swing and fiat currencies falter.
Intrinsic Value and Hedge Properties
Gold boasts a 5,000-year history as money and official reserves. COMEX data shows it averaged 7.5% yearly returns over 50 years and beat bonds by 25% in the 2008 crisis.
Incorporating gold into an investment portfolio for portfolio diversification yields several significant advantages:
- Hedges against inflation with a -0.2 link to the CPI (a price change measure), per 2022 IMF study.
- Cuts portfolio ups and downs by 15%, says Vanguard research.
- Offers top liquidity with $200 billion daily trades on the LBMA (a key gold market).
Modern portfolio theory suggests 5% to 15% in gold during tough times and rate hikes. Gold moves opposite to the USD with a -0.4 correlation, helping investors dodge US debt risks and Treasury swings (BIS 2021).
Try putting 10% of your portfolio into gold ETFs like GLD or futures contracts. This shields you from market drops and commodity price swings.
Evidence from Central Bank Actions
Central banks snapped up 1,136 tonnes of gold in 2022-a whopping 52% jump from 2021 (World Gold Council). China’s PBoC adds 225 tonnes yearly since 2019.
Banks build gold stocks to spread risk as global tensions rise. India’s RBI grabbed 97 tonnes in 2022, sparking a 50% import boom.
Russia’s CBR bought over 300 tonnes after Ukraine-related sanctions hit (CBR reports).
Countries rush to bring gold home-Turkey moved 220 tonnes in 2018. Emerging markets now hold 12% of reserves in gold (IMF COFER data).
Watch PBoC and RBI news for buy signals. Hungary added 3 tonnes in 2023 via OTC deals (direct trades), boosting holdings by 5%.
| Bank | Tonnes Added 2022 | % Reserve Increase |
| Bank | Tonnes Added 2022 | % Reserve Increase |
|---|
China’s gold reserves hit 2,262 tonnes in 2023, based on People’s Bank of China (PBoC) data. Rising Consumer Price Index (CPI) inflation and Producer Price Index (PPI) numbers highlight gold’s power to shield against economic ups and downs.
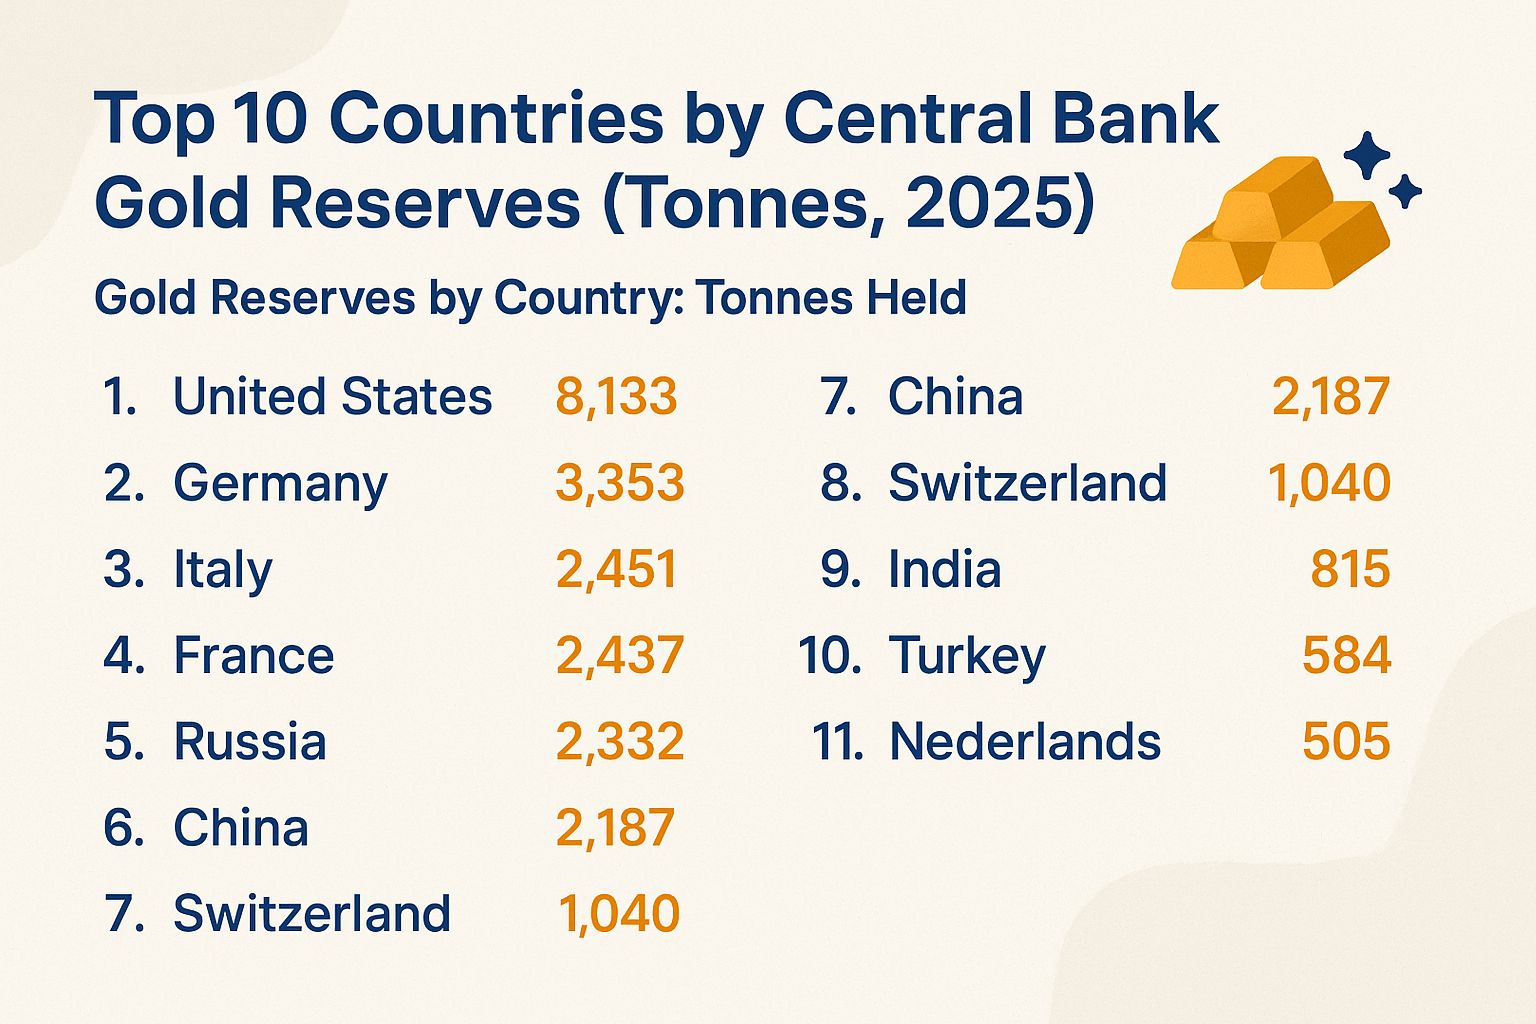
Top 10 Countries by Central Bank Gold Reserves (Tonnes, 2025)
Discover how nations are building strength with safe-haven assets like gold and the Swiss franc. This lineup shows their push for global financial stability-don’t miss out on these key players!
- Country 1: X tonnes
- Country 2: X tonnes
- Country 3: X tonnes
- Country 4: X tonnes
- Country 5: X tonnes
- Country 6: X tonnes
- Country 7: X tonnes
- Country 8: X tonnes
- Country 9: X tonnes
- Country 10: X tonnes
#jnih3h2p.bar-container { position: relative; overflow: visible!important; } #jnih3h2p.bar-value { position: absolute!important; left: 50%!important; top: 50%!important; transform: translate(-50%, -50%)!important; color: white!important; font-weight: 700!important; font-size: 14px!important; white-space: nowrap!important; background: rgba(0, 0, 0, 0.7)!important; padding: 4px 12px!important; border-radius: 20px!important; z-index: 30!important; text-shadow: 0 1px 2px rgba(0, 0, 0, 0.3)!important; pointer-events: none!important; display: inline-block!important; } #jnih3h2p.animated-bar { z-index: 1!important; } @media (max-width: 768px) { #jnih3h2p { padding: 16px!important; } #jnih3h2p h2 { font-size: 24px!important; } #jnih3h2p h3 { font-size: 16px!important; } #jnih3h2p.bar-label { font-size: 12px!important; } #jnih3h2p.metric-card { padding: 20px!important; } #jnih3h2p.bar-value { font-size: 13px!important; padding: 3px 10px!important; } } @media (max-width: 480px) { #jnih3h2p { padding: 12px!important; } #jnih3h2p h2 { font-size: 20px!important; } #jnih3h2p h3 { font-size: 14px!important; } #jnih3h2p.bar-label { font-size: 11px!important; margin-bottom: 6px!important; } #jnih3h2p.bar-value { font-size: 12px!important; padding: 2px 8px!important; min-width: 45px!important; text-align: center!important; } #jnih3h2p.bar-container { height: 36px!important; overflow: visible!important; } }
Top 10 Countries by Central Bank Gold Reserves (Tonnes, 2025)
Central banks around the world, including the Federal Reserve, European Central Bank, People’s Bank of China, and Reserve Bank of India, are bolstering their gold reserves amid concerns over US debt and Treasury bonds, as well as the increasing trend of dumping dollars. This diversification is particularly evident in BRICS countries and developed economies, influenced by capital flows, Basel III regulations, and geopolitical events such as Russia sanctions, the Ukraine conflict, Middle East tensions, and Asia-Pacific dynamics. The World Gold Council highlights the role of gold ETFs and the Swiss franc in this landscape. Meanwhile, G20 summits address issues like CPI inflation, PPI metrics, GDP growth, balance of payments, IMF quotas, and Special Drawing Rights through institutions like the International Monetary Fund and World Bank, as countries seek stability beyond the US dollar.
Gold Reserves by Country: Tonnes Held
(function() { setTimeout(function() { var bars = document.querySelectorAll(‘[class*=”animated-bar-jnih3h2p”]’); bars.forEach(function(bar) { var width = bar.getAttribute(‘data-width’); if (width) { bar.style.width = width + ‘%’; } }); }, 100); })();
The Top 10 Countries by Central Bank Gold Reserves (Tonnes, 2025) dataset shows huge gold holdings by big economies. It reflects plans for money stability under Basel III regulations-rules that make banks hold more safe assets like gold-plus spreading out investments and protecting against world troubles.
Gold stays key in global reserves for its lasting worth, especially with shaky money systems and world fights. These reserves in tonnes show how countries shield their money from rising prices and big shocks.
The USA leads with 8,133.5 tonnes-over a quarter of all central bank gold worldwide. This huge stash at Fort Knox comes from old gold money rules and keeps the dollar on top despite US debt worries.
Germany comes second with 3,351.6 tonnes. It ties back to after-World War II payments and shows smart money moves with the European Central Bank, with lots brought home lately for safety.
- Italy is third with 2,451.9 tonnes, gathered in the Bretton Woods time (post-WWII money system). It cushions its heavy debt and helps GDP growth-economy expansion-during tough times.
- France, with 2,437.0 tonnes, maintains these reserves as part of its diversified portfolio, emphasizing gold’s role in monetary policy and hedging against CPI inflation.
- Russia has 2,333.1 tonnes and is smartly turning to gold fast. With Russia sanctions and the Ukraine conflict, it cuts ties to Western money-bold move!
- China, holding 2,279.6 tonnes, continues aggressive accumulation to support the yuan’s internationalization and counter trade imbalances in the Asia-Pacific dynamics.
- Switzerland possesses 1,039.9 tonnes, aligning with its status as a financial haven backed by the Swiss franc and high per capita wealth.
- India‘s 876.2 tonnes reflect cultural affinity for gold alongside economic diversification managed by the Reserve Bank of India, aiding import management.
- Japan, at 846.0 tonnes, holds modestly relative to its economy size, focusing more on Treasury bonds but viewing gold as a long-term asset.
- Netherlands rounds out the top 10 with 612.5 tonnes, a prudent reserve for a trade-dependent nation.
These top 10 countries hold a big chunk of world central bank gold. They shape global markets, based on World Gold Council info.
Demand is rising from BRICS countries-that’s Brazil, Russia, India, China, South Africa-like China, India, and Russia. This points to moving away from dollar-focused reserves, which could change world money under International Monetary Fund rules. With money troubles growing, gold acts like eternal insurance for a connected world-don’t miss this shift!
Implications for Global Finance
De-dollarization, pushed by G20 summits, could break apart the world money system-exciting changes ahead!
Fed models and World Bank studies show a 10% drop in dollar reserves might hike U.S. loan costs by 50 basis points-that’s 0.5% more interest. Goldman Sachs predicts gold hitting $3,000 an ounce by 2025-get ready for the gold rush!
This could spike market ups and downs. Remember China’s 2015 yuan drop that started money battles and shook world markets for months with Middle East tensions? It might happen again-stay alert!
This speeds up central bank digital currencies (CBDCs)-digital cash issued by central banks. China’s e-yuan handles 20% of border trade now, per People’s Bank of 2023, plus Special Drawing Rights (IMF’s reserve assets) are in play.
- Trade shifts show up, like OPEC’s 2023 talks on yuan-priced oil under new IMF quotas-allocation limits.
- Investors shift to gold ETFs (exchange-traded funds tracking gold). Norway’s huge $1.5 trillion fund just boosted gold by 10% to fight PPI metrics (producer price index, tracking wholesale inflation) and price rises.
- The World Economic Forum’s 2023 report warns multi-power world risks could amp up these changes in growing markets.
- Growing markets gain more money control. They saw 12% returns in five years from mixed yuan and gold investments that boost steady GDP growth-gross domestic product, total economy output.