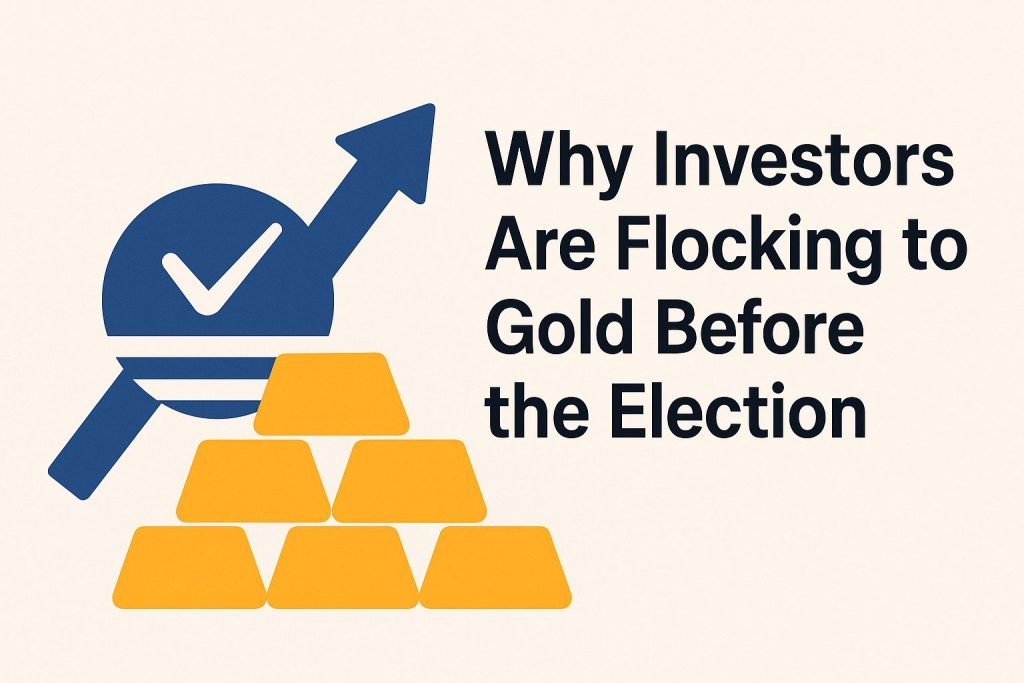
The U.S. presidential election is nearing. Investors feel uneasy about the shifts.
They are rushing to gold. Prices have soared in financial markets.
This draws billions amid talk of market chaos in commodities. Gold stands strong against uncertainty and politics.
History shows rallies during elections. Today, inflation and policy shifts fuel the fear.
Explore the economic drivers, political risks, trends, and strategies for this gold rush. Diversify now to protect your portfolio!
Historical Context of Gold During Elections and the Gold Standard Era
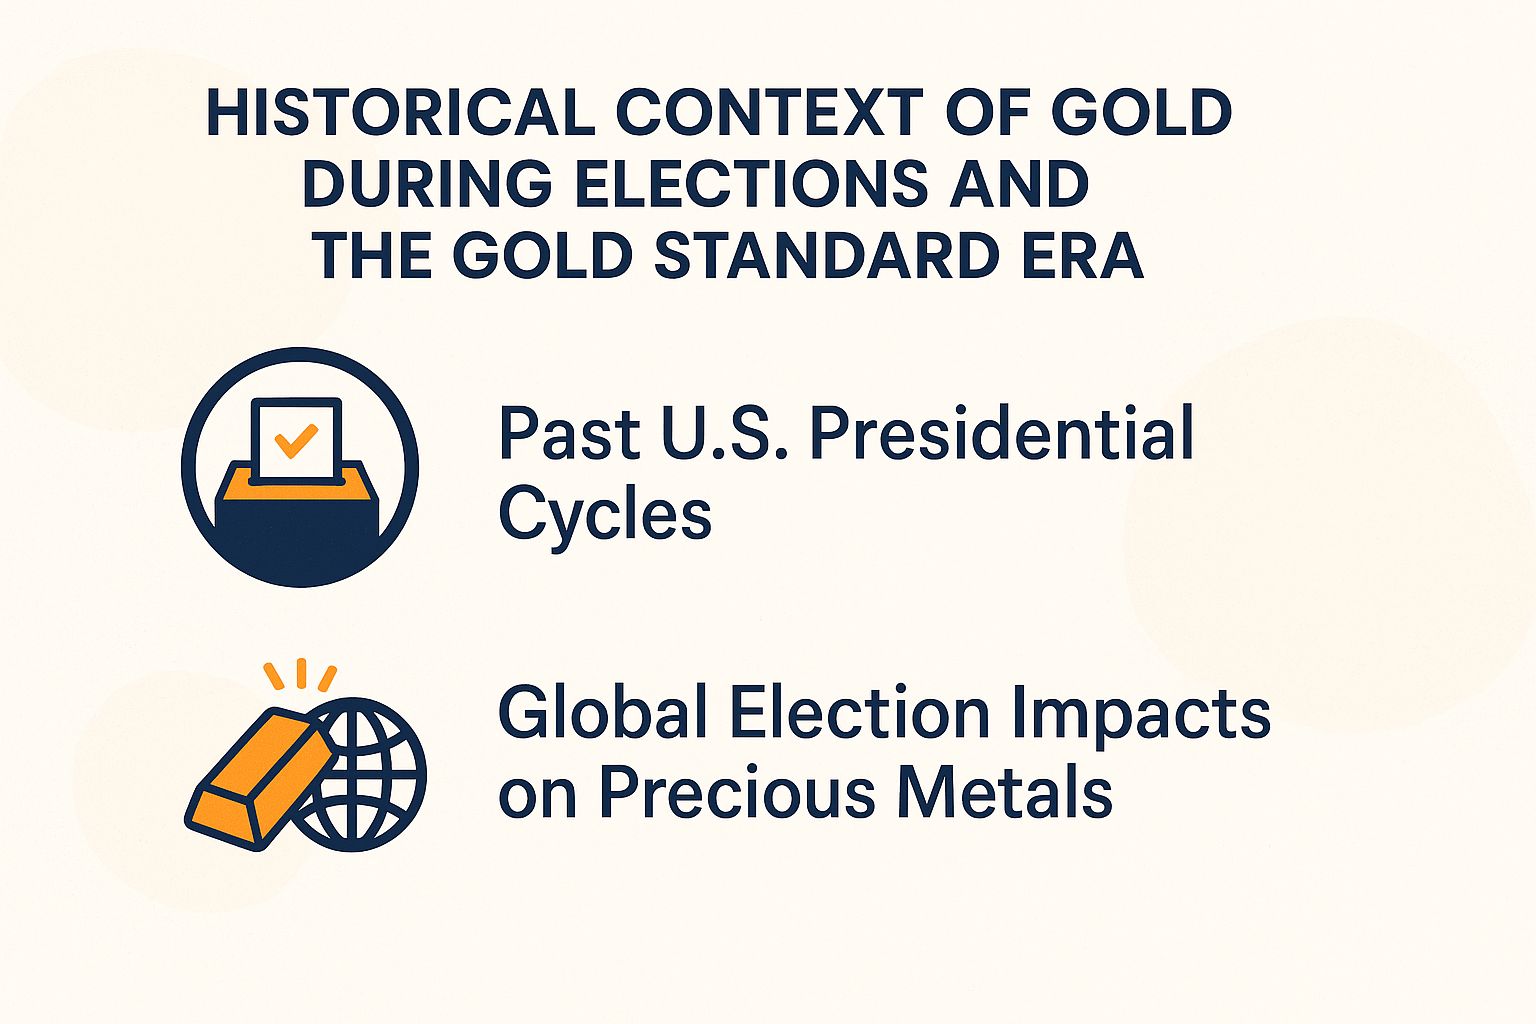
Gold beat stocks by 25% in past U.S. election years. Look at the trends.
The London Bullion Market Association shows peaks in 2008 and 2016. Those years had big policy uncertainty and global risks.
Past U.S. Presidential Cycles
In 2008, gold prices jumped 5.5% from July to November. Bloomberg data backs this up.
Investors fled to safe assets like gold. They hedged against the financial crisis and expected changes under Obama. (Flight to safety means moving money to stable investments during trouble.)
Other election years show similar patterns. Uncertainty drove gold prices up.
- 1972 (Nixon reelection): A 20% increase amid inflationary pressures, as documented by U.S. Geological Survey (USGS) data.
- 2000 (Bush vs. Gore recount): A 10% rise attributable to extended uncertainty.
- 2016 (Trump victory): An 8% post-election rally, per Kitco analysis.
Gold prices often rose with the VIX, the fear index. It measures market panic.
The VIX jumped 30% on average. Federal Reserve data shows these spikes match gold surges.
A 2019 Journal of Finance study proves it. Investors hedge with gold during election uncertainty.
Watch the VIX if it tops 25. Buy gold ETFs like GLD now to cut risks. (ETFs are easy funds that track gold prices.)
Global Election Impacts on Precious Metals
In 2019, India’s elections boosted gold prices by 12% in rupees. Physical demand rose 15%, says the World Gold Council.
Emerging markets turn to gold as a safe haven during uncertainty.
Global political shakes show this trend. Investors buy metals like gold, silver, platinum, and palladium for safety.
Track elections with tools like Bloomberg Terminal or free Reuters alerts. Adjust your portfolio fast to stay ahead.
Key examples include:
- Brexit 2016: Gold prices in the United Kingdom rose 25% in British pound sterling terms (London Bullion Market Association data), as concerns over Brexit prompted safe-haven investments, with sovereign wealth funds such as Norway’s intensifying demand.
- 2022 French elections: Volatility within the European Union drove a 5% increase in gold prices (Eurostat data), leading central banks to augment their reserves.
- Brazil 2022: Heightened political risks elevated silver prices by 10% as a proxy hedge, in accordance with data from the local B3 exchange.
Unlike U.S. markets, China’s funds hold 2,200 tonnes of gold. People’s Bank data shows this adds global stability.
The IMF’s 2023 report notes these events boost demand 8-12%. Supply issues make it worse.
Diversify into emerging markets to hedge. (Hedging protects against losses.)
Economic Uncertainties Driving Demand
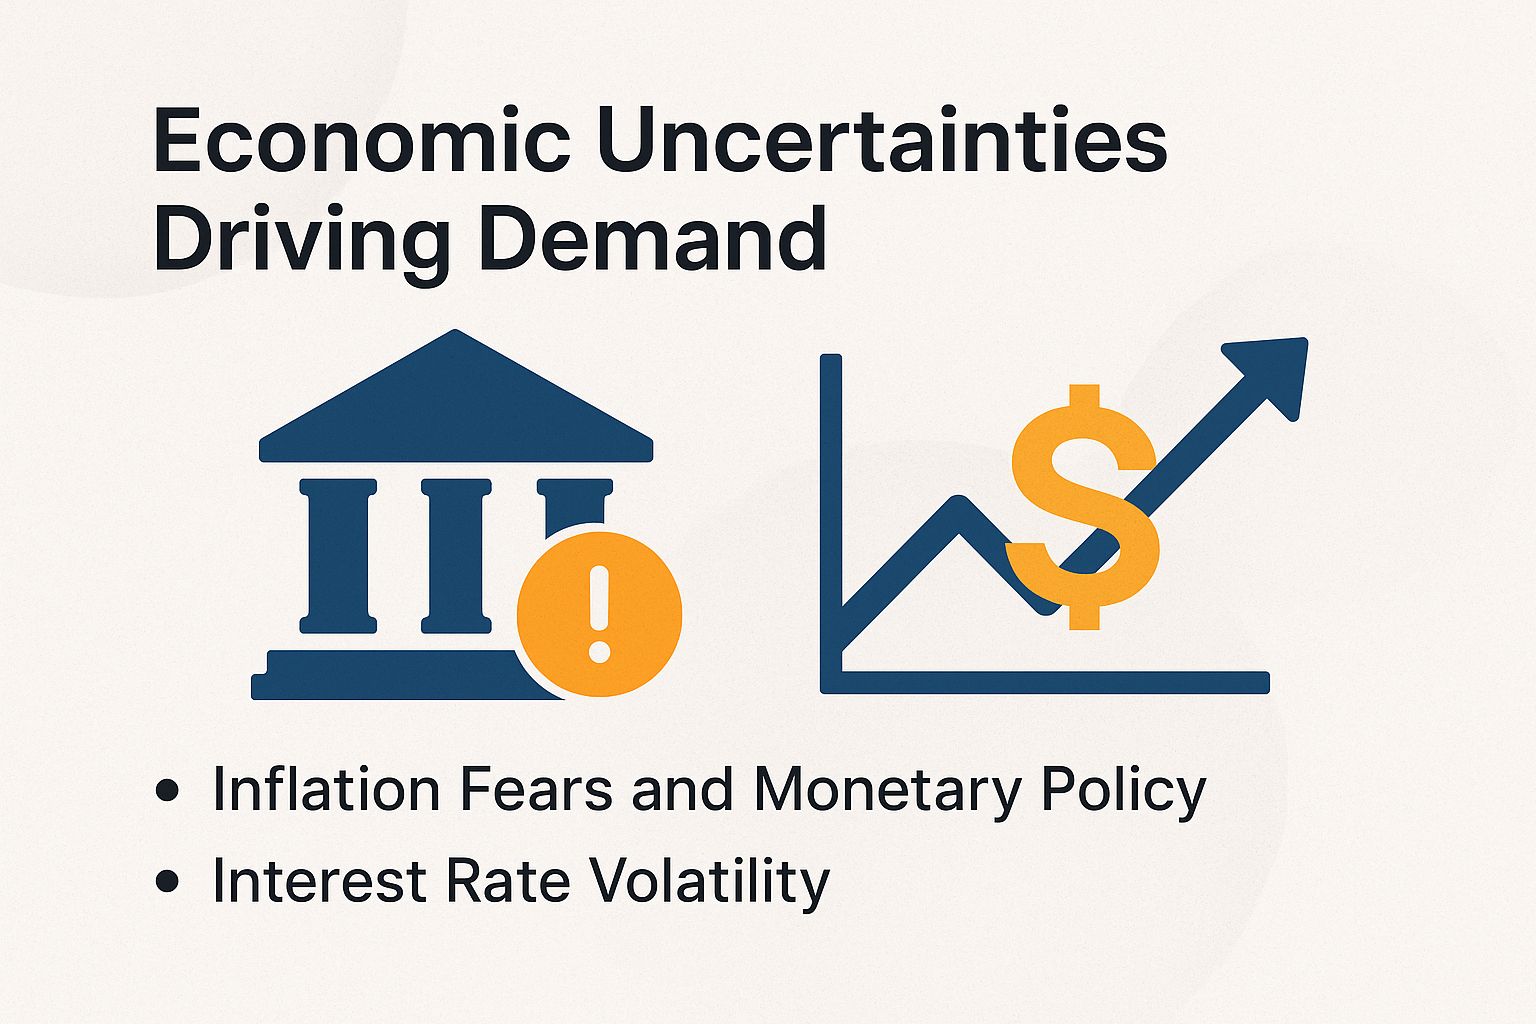
U.S. inflation hit 3.2% in mid-2024, per Bureau of Labor Statistics data. Gold demand jumped 22% as a smart hedge against this-beating bonds while recession fears grow and GDP slows by 1.5%. Act now to protect your savings!
Inflation Fears and Monetary Policy
Inflation peaked at 9.1% in 2022. The Federal Reserve’s quantitative easing-printing more money to boost the economy-sparked a 40% gold price surge, according to a 2023 National Bureau of Economic Research study on safe assets.
The Consumer Price Index, a measure of everyday price changes, rose 20% since 2020 per BLS data. This erodes your buying power, so savvy investors flock to gold as a trusty shield.
FOMC minutes predict three rate cuts in 2024. These moves could weaken the dollar and push gold prices even higher-get in before it’s too late!
Gold shines with a Sharpe ratio of 1.2-a score that balances returns against risk-beating the S&P 500’s 0.8, says Morningstar. It outperforms options like these:
- Cryptocurrencies, with wild swings
- Real estate, tied to markets
- Art and collectibles, hard to sell fast
Back in the 1970s stagflation era, when prices soared and growth stalled, gold rocketed 2,300%-imagine that potential today!
Central banks grabbed 1,136 tonnes of gold in 2022, per a 2024 Goldman Sachs report. This massive buying signals gold’s strength-join the trend!
Boost your portfolio with 5-10% in gold for diversification and protection. Try these exciting options:
- ETFs like GLD for easy access
- Mining stocks for growth potential
- Physical gold bars for tangible security
- Gold futures for advanced plays
Rebalance regularly to stay ahead of uncertainties.
Interest Rate Volatility
The 10-year Treasury yield swung from 3.8% to 4.9% in 2023, U.S. Treasury data shows. As yields climbed, gold prices still soared 13%-proving its power as a safe haven when bond returns falter.
Gold moves opposite to yields, with a correlation score of -0.6 from an ECB study. It thrives as a no-interest hedge when real yields drop- that’s the yield minus expected inflation.
When the Fed goes dovish with rate cuts, gold averages 15% gains. That’s way better than the 5% bump in 2018’s taper tantrum, when market fear hit VIX levels of 20.
Investors may track real yields using professional tools such as Bloomberg terminals; a decline below 1% frequently indicates potential buying opportunities.
A 2022 paper by the Bank for International Settlements (BIS) on precious metals reinforces this relationship, highlighting gold’s average 20% price uplift during episodes of low-yield volatility.
Political Risks in the Current Landscape
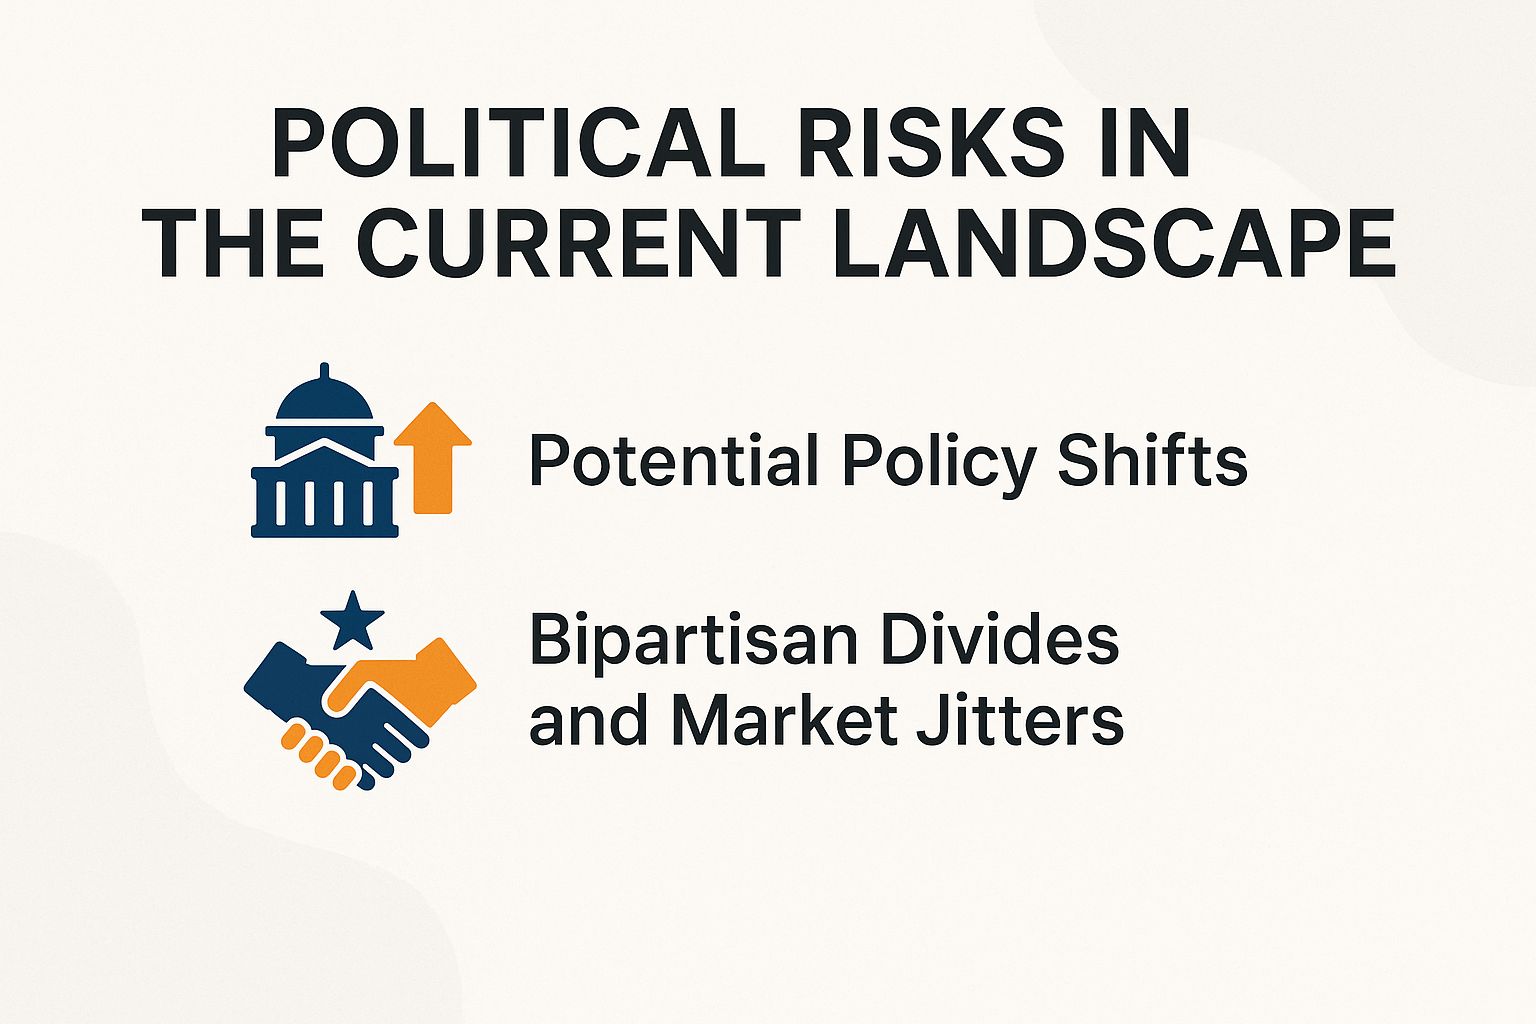
The 2024 election Policy Uncertainty Index hit 250 on policyuncertainty.com. With regulations shifting, big investors like hedge funds boosted gold demand 10%, JPMorgan reports-uncertainty means opportunity!
Potential Policy Shifts
Trump’s 10% import tariffs could spark trade wars like 2018’s U.S.-China clash. Back then, gold climbed 1.6% monthly amid the chaos, per U.S. Trade Representative data.
Political twists in taxes, healthcare, immigration, and foreign policy always highlight gold as your go-to safe haven. Check these standout cases:
- 1970s oil crisis: Gold exploded amid global tensions
- 2008 financial meltdown: Gold steadied portfolios
- 2016 election volatility: Demand spiked quickly
- Did you know? The 2017 Tax Cuts and Jobs Act (TCJA): Gold prices rose by 5% following its enactment, influenced by a combination of economic optimism and underlying uncertainty (per Internal Revenue Service data).
- Did you know? 2024 tariff proposals: Anticipated to drive an 8% increase in gold demand as a hedge against inflation (World Trade Organization estimates).
- Did you know? The 2021 stimulus bill: Resulted in $20 billion in inflows to gold exchange-traded funds (ETFs) amid heightened market volatility (SPDR reports).
- Did you know? The 2023 debt ceiling crisis: Prompted a 2% surge in gold prices as investors pursued greater stability.
A 2024 Brookings Institution study shows how election policies boost uncertainty. Tariffs often make economic worries worse.
To fight risks, add a 2-3% risk premium to your yield math as a hedge (a way to protect investments from losses). Use tools like Bloomberg terminals to watch markets live.
Bipartisan Divides and Market Jitters
Pew Research in 2024 found a huge 40-point gap between parties on economic policies. This gap pushes the VIX fear index (a measure of market fear) up to 25 during debates, leading everyday investors to buy more gold on apps like Robinhood. It’s sparking a rush to gold!
Key implications include the following:
- Poll volatility: Fluctuations of 5% in RealClearPolitics averages typically result in a 3% increase in gold prices, as investors seek to hedge against associated risks.
- Risks of governmental gridlock: Events such as the 2018 government shutdown led to a 4% surge in gold prices, as reported by the Congressional Budget Office (CBO), underscoring the value of diversified investment portfolios.
- Influence of voter demographics: Support among Generation Z for green policies has contributed to a 5% rise in silver prices during recent electoral cycles.
- 2020 election drama: Party fights sent gold soaring to $2,075 per ounce – a clear sign of its safe-haven power!
A 2023 Harvard Kennedy School paper explains these political risk patterns clearly.
AAII surveys show investors get optimistic during election debates. This creates smart chances to buy gold on Robinhood.
Gold’s Role as a Safe Haven Asset
Gold barely moves with stocks – its correlation (how assets move together) is just 0.1. This makes it a key way to mix up your investments.
A 2023 Vanguard study says putting 5% in gold cuts portfolio ups and downs (risk measure) by 12%.
Gold acts as a safe spot during tough times. It hedges (protection tool) against dollar drops and rate changes, keeping value when money weakens, per Bank for International Settlements reports.
Gold shields you from big losses in policy chaos. Its beta (a measure of how much an asset moves with the market) of 0.2 in down markets means it loses far less than stocks.
Adding gold boosts returns for the risk taken. BlackRock analysis shows Sharpe ratios – a score for efficient gains – rise 15-20% over stock-only setups.
- Gold and stocks: Almost no link (0.1 correlation).
- Gold and bonds: Mild connection (0.3 correlation).
Industry best practices advocate for a 5-15% allocation to gold to achieve balanced risk management, consistent with the World Bank’s 2024 report on safe-haven assets.
Recent Market Data and Trends
Gold hit $2,450 per ounce in July 2024! COMEX data confirms this exciting peak.
Futures stayed strong above $2,400 support, showing bullish momentum (upward price push). Central banks bought 500 tonnes in Q1 and Q2, per IMF. Don’t miss this momentum!
Demand stays strong with mixed growth outlooks. Physical gold use jumped 3% year-over-year in Q2, says World Gold Council.
Inflation fears and global tensions fuel this hedging rush.
- Electronics industry: 5% demand growth (USGS data).
- India jewelry: 10% rise in demand.
For strategic investment considerations, it is recommended to allocate 5-10% of a portfolio to gold ETFs such as GLD, which recorded $1.2 billion in inflows during June, as noted by Bloomberg. Investors should closely monitor technical indicators, with the Relative Strength Index (RSI) at 65 suggesting neutral-to-bullish momentum.
By way of comparison, gold realized a 25% appreciation in 2020 under analogous market conditions, according to CME Group analyses. Portfolio managers may wish to explore dollar-cost averaging into futures contracts to achieve leveraged exposure.
Gold Investment Trends 2024
#x9v4m3al.bar-container { position: relative; overflow: visible!important; } #x9v4m3al.bar-value { position: absolute!important; left: 50%!important; top: 50%!important; transform: translate(-50%, -50%)!important; color: white!important; font-weight: 700!important; font-size: 14px!important; white-space: nowrap!important; background: rgba(0, 0, 0, 0.7)!important; padding: 4px 12px!important; border-radius: 20px!important; z-index: 30!important; text-shadow: 0 1px 2px rgba(0, 0, 0, 0.3)!important; pointer-events: none!important; display: inline-block!important; } #x9v4m3al.animated-bar { z-index: 1!important; } @media (max-width: 768px) { #x9v4m3al { padding: 16px!important; } #x9v4m3al h2 { font-size: 24px!important; } #x9v4m3al h3 { font-size: 16px!important; } #x9v4m3al.bar-label { font-size: 12px!important; } #x9v4m3al.metric-card { padding: 20px!important; } #x9v4m3al.bar-value { font-size: 13px!important; padding: 3px 10px!important; } } @media (max-width: 480px) { #x9v4m3al { padding: 12px!important; } #x9v4m3al h2 { font-size: 20px!important; } #x9v4m3al h3 { font-size: 14px!important; } #x9v4m3al.bar-label { font-size: 11px!important; margin-bottom: 6px!important; } #x9v4m3al.bar-value { font-size: 12px!important; padding: 2px 8px!important; min-width: 45px!important; text-align: center!important; } #x9v4m3al.bar-container { height: 36px!important; overflow: visible!important; } }
Gold Investment Trends 2024
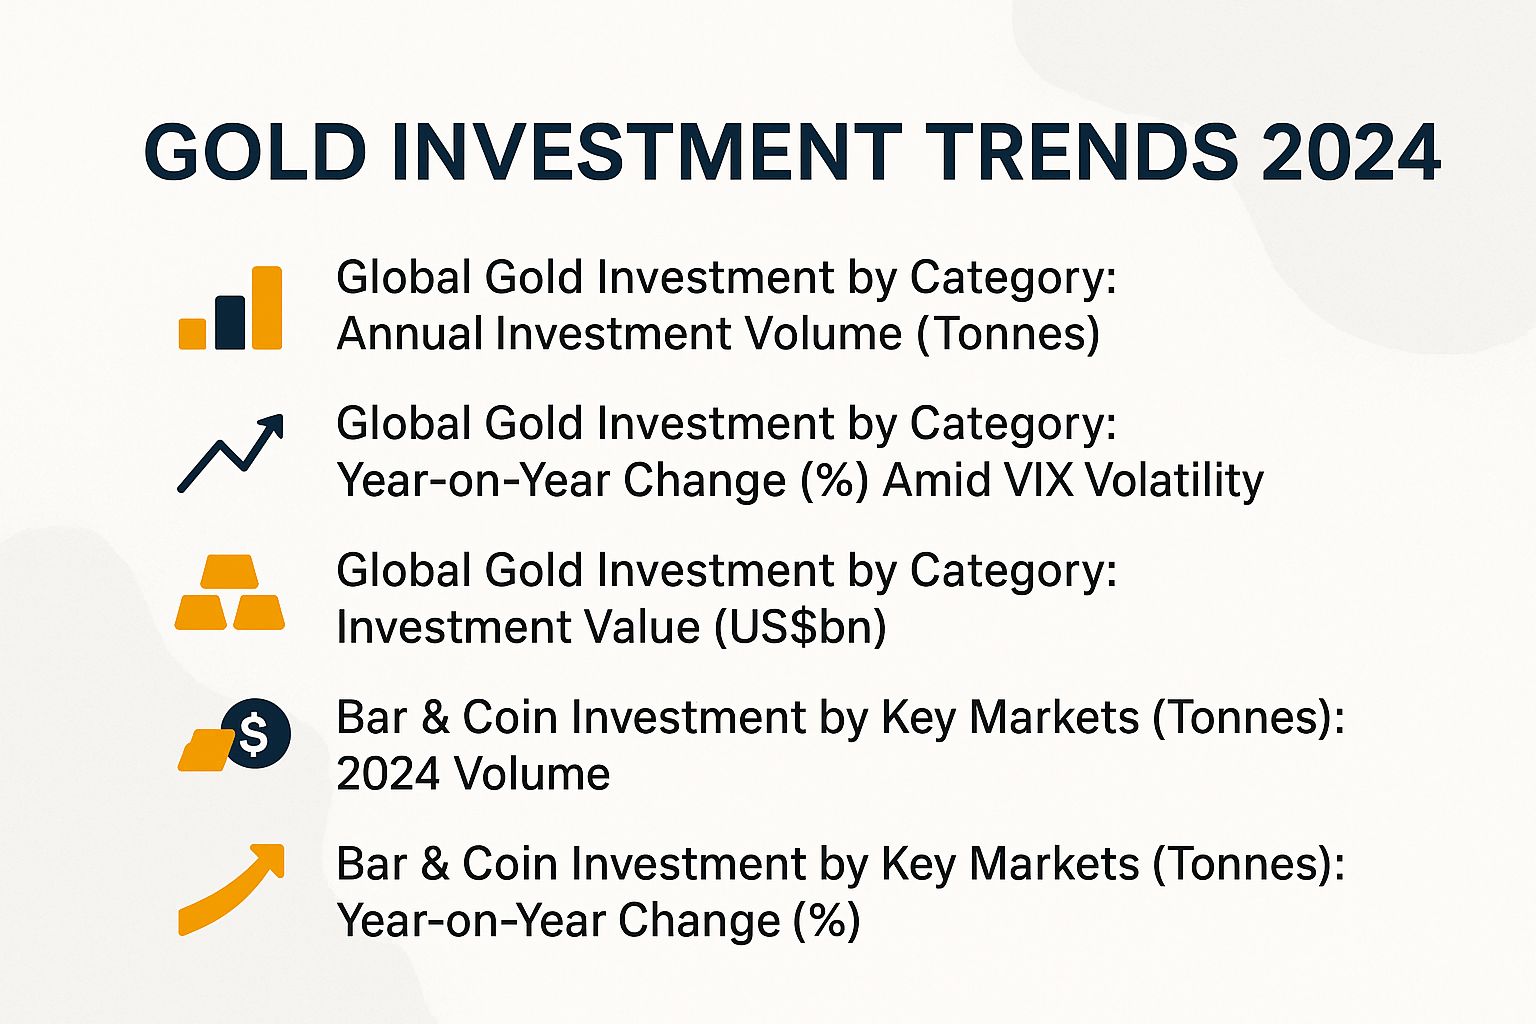
Global Gold Investment by Category: Annual Investment Volume (Tonnes)
Global Gold Investment by Category: Year-on-Year Change (%) Amid VIX Volatility
Global Gold Investment by Category: Investment Value (US$bn)
Bar & Coin Investment by Key Markets (Tonnes): 2024 Volume
Bar & Coin Investment by Key Markets (Tonnes): Year-on-Year Change (%)
(function() { setTimeout(function() { var bars = document.querySelectorAll(‘[class*=”animated-bar-x9v4m3al”]’); bars.forEach(function(bar) { var width = bar.getAttribute(‘data-width’); if (width) { bar.style.width = width + ‘%’; } }); }, 100); })();
The Gold Investment Trends 2024 data illustrates a significant resurgence in global gold demand, particularly in physical forms like bars and coins, amid economic uncertainties. This overview covers investment volumes, year-on-year changes, and regional breakdowns, highlighting gold’s role as a safe-haven asset.
In the Global Gold Investment by Category, total investment volume hit 1179.5 tonnes in 2024. That’s up from 945.5 tonnes in 2023, a solid 25% jump year-over-year.
Bar and coin investments drove this surge with 1186.3 tonnes. Retail buyers crave these real, touchable assets.
ETFs dropped sharply to -6.8 tonnes, down 97%. Investors fled paper gold for physical amid inflation scares and global tensions, pushing the total value to $90 billion-with bars and coins at $91 billion despite extra costs.
- Key drivers: Higher gold prices and banks buying big boosted demand. ETF sell-offs show folks want to own real gold in shaky times.
- What it means: People hedge against falling currencies and stock crashes. Physical gold feels safer than paper investments.
The Bar & Coin Investment by Key Markets shows varied trends across regions in 2024. China topped the list at 336.2 tonnes, with India close behind at 239.4 tonnes, then Turkey at 112.2 tonnes, U.S. at 77.8 tonnes, and Europe (ex CIS) at 66.6 tonnes.
India grew 29% thanks to traditions and wedding buys. China rose 20% from stimulus and shifting away from property investments.
The U.S. fell 33% as stocks boomed, cutting safe-haven demand. Europe dropped 50% due to energy woes, and Turkey declined 25% with stabilizing currency.
Gold still shines bright in places like India and China. These emerging markets lead physical demand, while the West stays cautious.
Grab opportunities in physical gold now amid world chaos! Balance it with ETFs to dodge volatility and cut risks through 2024 and later.
Investor Strategies and Outlook
Big players like BlackRock suggest putting 8% of your portfolio into gold for 2024. Try ETFs like IAU at about $29 per share-it tracks gold’s rise with just a 0.25% fee, per their latest outlook.
To effectively execute this strategy, the following approaches are recommended:
- Buy-and-Hold Bullion: Get physical gold from trusted sellers like JM Bullion. Expect a $50 premium per ounce for delivery, and store it in IRS-approved vaults for tax perks under SEC rules.
- ETFs: Pick GLD to follow gold’s current price-it’s got four stars from Morningstar. Skip GDX, which bets on mining companies for 30% extra kick but adds more ups and downs.
- Options: Consider purchasing call options on the CME Group exchange with a $2,500 strike price to achieve magnified returns on upward price movements.
- Quarterly Rebalancing: Periodically adjust holdings to mitigate volatility, as indicated by the VIX, by up to 10%, in line with guidance from Fidelity Investments.
Gold prices could soar 15% to $2,900 per ounce by the US election, says Goldman Sachs-act fast! Picture this: $10,000 in gold from 2016 to 2020 would net you 50% gains.
Watch out for risks like higher interest rates sparking short bets against gold. Stay sharp to protect your gains!