Why Precious Metals Could Enter a 10-Year Boom
Picture gold’s meteoric rise during the 1970s oil shocks. It multiplied investor returns amid economic turmoil.
This echoes its historical value from ancient civilizations. Precious metals like gold served as barter money and held cultural significance, such as in wedding jewelry.
Austrian economics principles highlight gold as sound money. Today, persistent inflation, eroding currencies, and geopolitical tensions signal a potential 10-year boom.
Precious metals act as inflation hedges and safe havens in uncertainty and recessions. Expect price surges soon!
Historical trends from bull markets, analyzed by the World Gold Council, show promise. Current USGS data reveals supply shortages.
Boost your investments with macroeconomic drivers, mining limits, and tech demand in jewelry, electronics, and catalysts. China and India’s imports from emerging markets fuel this global surge.
- Macroeconomic factors like inflation
- Mining supply constraints
- Industrial uses in tech and jewelry
- Demand from China and India
Discover investment strategies to seize these opportunities now!
Historical Cycles in Precious Metals Markets
Precious metals markets follow cyclical patterns. These cycles happen every 10 to 15 years.
In the 1970s inflation crisis, gold returned 400%. A Federal Reserve study backs this commodity boom fact.
Past Bull Markets and Triggers
From 1971 to 1980, gold prices jumped from $35 to $850 per ounce. The end of the Bretton Woods system-a post-WWII agreement tying currencies to gold-and oil shocks triggered this, per a 2020 NBER paper.
Prices gained over 2,300%. High inflation hit 13.5% in 1979 (IMF data), plus geopolitical tensions fueled the rise. Main triggers: U.S. dollar devaluation and OPEC oil embargoes.
Gold surged 600% from 2001 to 2011, from $256 to $1,900 per ounce (2012 World Bank). Uncertainty after 9/11, the 2008 crisis, and Fed’s quantitative easing-which pumps money into the economy-drove this, adding $2.3 trillion.
- Post-9/11 uncertainty
- 2008 financial crisis
- Fed’s money injection
Silver rose 47% to $29 per ounce in 2020 during COVID-19 (LBMA data). Supply disruptions and over $5 trillion in global stimulus pushed it up.
These bull markets last 5 to 7 years. They average over 300% gains, especially with loose money policies like low interest rates. Grab these chances before they peak!
Lessons from Previous Downturns
Gold fell 40% from 2011 to 2015 in a bear market. The Fed’s tapering-slowing money printing-caused it (2018 BIS paper).
- Manage volatility, like gold’s 45% drop after 2011. Diversify your portfolio-keep commodities under 10% (Vanguard advice).
- Watch for policy shifts, like the 2013 QE taper crash. Check Fed minutes, reports, and do monthly technical and fundamental analysis.
- Avoid bubbles, like the 1980 Hunt brothers’ silver manipulation via futures contracts and long positions. Limit leverage (borrowing to invest more) to 2:1 max; regulators like CFTC step in on manipulation.
Learn these to protect and grow your wealth!
Precious metals mining companies like Barrick Gold lost 70% of their market value from 2012 to 2015.
They bounced back with smart cost cuts and better operations. This shows why tough business strategies beat risky bets.
Macroeconomic Drivers Fueling Growth
Global inflation hit 6.8% in 2023, per IMF data. This wore down regular money’s value, making precious metals a top shield against rising prices. Silver prices jumped 12% that year.
Persistent Inflation and Currency Devaluation
In June 2022, U.S. inflation (measured by the Consumer Price Index, or CPI) soared to 9.1%-the highest since 1981. Gold prices rose 15% that year, proving its power as an inflation fighter, according to a 2023 Peterson Institute study.
Central banks pumped money into the economy with loose policies. The M2 money supply-a broad measure of cash in circulation-grew 40% from 2020 to 2022, per Federal Reserve stats.
All that extra money weakened the U.S. dollar. The USD index dropped 10%, showing the dollar losing ground to gold since 2020.
Back in the 1970s stagflation era-when prices rose but growth stalled-gold crushed stocks. It delivered 2,300% returns versus the S&P 500’s 230%, a whopping ten times better!
Don’t wait-protect your money now! Put 5-10% of your investments into physical precious metals.
- Bullion bars and coins: Easy to store securely.
- Numismatic gold items: High purity (check karat rating) but watch the premium over spot price.
Compare these to other options like real estate, bonds, Bitcoin (the so-called digital gold), or ETFs like GLD.
Check Kitco for live spot prices to make smart picks. With IMF forecasting 3-5% inflation through 2025, precious metals stay a must for mixing up your investments.
Declining Real Interest Rates
In 2021, real U.S. interest rates-actual rates after subtracting inflation-went negative for the first time since 2010. Platinum prices climbed 20%, as noted in a 2024 Goldman Sachs report on rates and commodities.
Negative real rates eat away at cash savings. For example, a 5% nominal rate loses out to 6% inflation, giving a -1% real return. That’s why metals like palladium and platinum shine as inflation protectors.
Gold jumped 25% from 2019 to 2021 when rates hit zero, per LBMA data.
The Fed’s 2008-2012 money-printing spree (quantitative easing) sent rhodium from $1,000 to $10,000 per ounce-talk about a boom!
Track 10-year TIPS yields on Bloomberg or Treasury.gov-these bonds adjust for inflation.
If they drop below zero, act fast: Shift 5-10% of your portfolio to metal ETFs like PPLT. Use the Fed’s Taylor Rule to predict rate moves.
Supply-Side Constraints and Shortages
Global gold mining output stuck at 3,000 tonnes yearly since 2018, says USGS.
With demand steady, this supply stall caused shortages and pushed gold prices up 30%.
Mining Production Challenges
Strikes hit South African platinum mines in 2023, cutting 20% of output (Reuters). This led to a 15% palladium shortage and wild price swings-get in before it gets crazier!
The platinum group metals (PGM) sector faces big challenges. Platinum group metals include platinum, palladium, and rhodium used in industries like automotive. Here are four key issues with solutions to tackle them right now.
- Labor Shortages: Peru’s silver mines saw a 10% drop in output in 2022, per McKinsey report. Fight this by using AI robots for routine jobs, like Rio Tinto does-it boosts efficiency by 20% and keeps things moving fast.
- Energy Costs: Prices jumped 50% after the Ukraine conflict, says IEA data. Switch to solar and renewables now, just like Anglo American’s solar farms in South Africa that cut costs by 30%-save big and go green!
- Strikes: Canada’s 2022 gold mine strikes caused 5% production losses, per Natural Resources Canada. Use IBM’s predictive tools to spot issues early and stop disruptions before they hit.
- Exploration Costs: Sites cost about $15 million on average, per USGS estimates. Cut that by 40% with satellite images and AI mapping-USGS backs these tools for quicker, cheaper finds.
Glencore cut cobalt production in 2021, showing PGM risks. Diversify now with recycling and better refining to stay ahead of shortages.
Geological and Regulatory Limits
The peak gold theory comes from a 2019 Science Advances study. It says global gold reserves could peak by 2030, making scarcity worse due to gold’s lasting qualities like strength and conductivity.
Rules add to the trouble. The EU’s ESG standards-rules for environment, society, and governance-delay 15% of projects.
USGS models using Hubbert curves predict peaks for metals like iridium after 2040. This limits new finds.
In Nevada, BLM data shows mining permits take 7 to 10 years. Delays like these slow everything down.
Tackle rising costs by investing in junior miners with ready permits. Pick ones in Australia or Canada for the best shot.
They often return 20-30% more during shortages. Indonesia’s 2020 nickel ban spiked rhodium prices by 150%-jump in before the next crunch!
Recycling fights scarcity head-on. IPMI says 25% of silver comes from e-waste today-it’s a game-changer!
Modern methods like hydrometallurgy recover 95% of gold from circuit boards. This uses safe leaching to pull out the precious stuff without digging new mines.
Escalating Demand from Key Sectors

Silver demand hit 1.2 billion ounces in 2023, up 10% from last year, says the Silver Institute. Solar panels and electric vehicles drive this boom, outpacing mine supplies-demand is exploding!
Industrial Applications in Technology
Palladium demand for car catalytic converters rose 8% to 300 tonnes in 2023, per Johnson Matthey’s PGM report. EVs push this, but hybrids keep it strong.
Green energy shifts boost demand for more precious metals in key areas.
- Electric vehicles use 20 grams of platinum per fuel cell. This supported 500,000 units in 2023, says BloombergNEF.
- Solar panels need 20 grams of silver each. Global installs hit 200 GW last year, per IRENA.
- Semiconductors eat up 300 tonnes of gold yearly for wiring, per USGS.
- Hydrogen tech relies on iridium catalysts. The market could reach $100 billion by 2030, estimates DOE-get excited for the growth!
Tesla faced supply chain issues in 2022. These caused a 25% jump in prices.
This shows risks in getting precious metals. Diversify your buying plans now to avoid big losses.
Geopolitical Risks Shaking Up Precious Metals
The Russia-Ukraine war in 2022 hit hard. It disrupted 40% of the world’s palladium from Russia and spiked prices by 10%, per the International Platinum Investment Council.
Geopolitical tensions shake gold and other precious metal prices. They create uncertainty and boost demand for safe-haven assets (investments like gold that hold value during tough times) over regular money.
Key factors include these:
- Trade wars like the 2018 U.S.-China tariffs pushed gold prices up 15% (World Trade Organization data). Get ready – similar fights could happen again!
- Economic sanctions, like those on Iran’s oil, create market ups and downs that lift precious metals prices.
- China buys about 25% of the world’s gold. Its central bank grabbed 1,000 tonnes in 2023 alone!
- India imports 700 tonnes of gold yearly for jewelry. Demand explodes during big festivals – watch for those spikes!
Track the GDELT Project’s tension indexes for early alerts. Think of the 1973 Yom Kippur War – it sent gold prices soaring!
Cut risks by putting 5-10% of your investments into precious metals ETFs. ETFs are funds you can buy and sell easily on the stock market.
Why Invest in Precious Metals Now – The Next 10 Years Look Golden!
JPMorgan’s 2024 forecast says gold will hit $2,500 per ounce on average by 2030. In a recession, diversified portfolios could see 8-12% yearly gains – don’t miss out!
Jump on this with Ray Dalio’s All Weather model. It follows Austrian economics ideas and suggests 5-15% in precious metals to fight inflation. A hedge protects your money when prices rise.
- SPDR Gold Shares ETF (GLD): Handles $60 billion and lets you trade easily without storing gold.
- Physical bullion or coins from JM Bullion: Costs an extra $50 per ounce, but you own real metal outright.
Handle risks like 15-20% yearly ups and downs with options strategies (contracts that let you buy or sell at set prices). These protect against big drops.
Look back: iShares Silver Trust (SLV) investors from 2010-2020 doubled their money twice over in tough times. Start with $10,000 in gold in 2000? It’s worth $100,000 now, says Kitco data. Imagine what the next decade could do!
Global Precious Metal Market Size and Shares: 2024-2034
#ippxvqt7.bar-container { position: relative; overflow: visible!important; } #ippxvqt7.bar-value { position: absolute!important; left: 50%!important; top: 50%!important; transform: translate(-50%, -50%)!important; color: white!important; font-weight: 700!important; font-size: 14px!important; white-space: nowrap!important; background: rgba(0, 0, 0, 0.7)!important; padding: 4px 12px!important; border-radius: 20px!important; z-index: 30!important; text-shadow: 0 1px 2px rgba(0, 0, 0, 0.3)!important; pointer-events: none!important; display: inline-block!important; } #ippxvqt7.animated-bar { z-index: 1!important; } /* Tablet styles */ @media (max-width: 768px) { #ippxvqt7 { padding: 16px!important; } #ippxvqt7 h2 { font-size: 24px!important; } #ippxvqt7 h3 { font-size: 16px!important; } #ippxvqt7.bar-label { font-size: 12px!important; } #ippxvqt7.metric-card { padding: 20px!important; } #ippxvqt7.bar-value { font-size: 13px!important; padding: 3px 10px!important; } } /* Mobile styles */ @media (max-width: 480px) { #ippxvqt7 { padding: 12px!important; } #ippxvqt7 h2 { font-size: 20px!important; } #ippxvqt7 h3 { font-size: 14px!important; } #ippxvqt7.bar-label { font-size: 11px!important; margin-bottom: 6px!important; } #ippxvqt7.bar-value { font-size: 12px!important; padding: 2px 8px!important; min-width: 45px!important; text-align: center!important; } #ippxvqt7.bar-container { height: 36px!important; overflow: visible!important; } }
Global Precious Metals Market: Size, Growth, and Shares 2024-2034
The precious metals market is booming fast. Watch it grow from $283 billion today to over half a trillion by 2034!
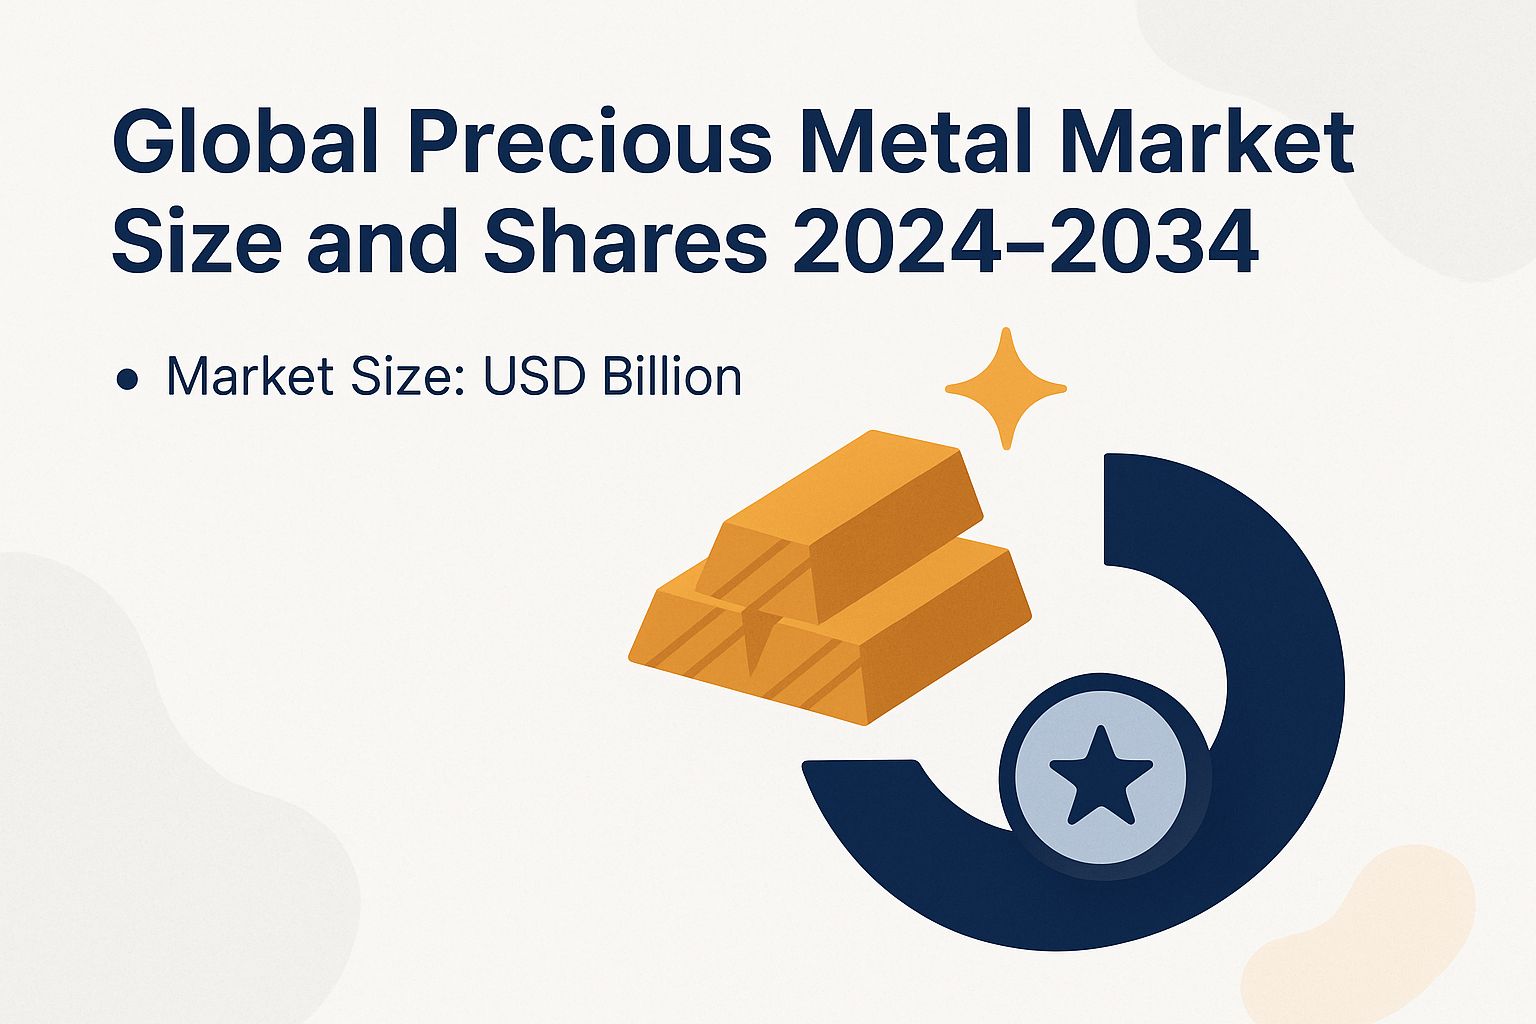
Market Size: USD Billion
Key Market Highlights
- 2024: Starts at $283 billion. Get ready for growth!
- 2025: Jumps to $303 billion. Exciting times ahead!
- 2034: Soars to $546 billion. Don’t miss this boom!
(function() { setTimeout(function() { var bars = document.querySelectorAll(‘[class*=”animated-bar-ippxvqt7″]’); bars.forEach(function(bar) { var width = bar.getAttribute(‘data-width’); if (width) { bar.style.width = width + ‘%’; } }); }, 100); })();
Discover the Global Precious Metal Market Size and Shares 2024-2034. It projects huge growth in total value, measured in USD billion, spotlighting gold, silver, platinum, and palladium as top safe investments during shaky economies, industry needs, and smart investing.
In 2024, the market is valued at $283.4 billion. It reflects steady recovery from global disruptions like supply chain issues and inflationary pressures.
Precious metals help diversify portfolios through ETFs. Gold leads as a hedge against USD index fluctuations. Silver and platinum group metals add value in electronics, automotive catalysts, and jewelry.
By 2025, the market should hit $302.79 billion. That’s a 6.9% jump from 2024, fueled by geopolitical tensions and central banks buying gold.
China’s strong demand and India’s rising imports drive growth in these emerging markets for cultural and investment reasons. Green tech pushes platinum and palladium needs in hydrogen fuel cells and electric vehicles, exciting the sector forward.
- Long-term projection to 2034: Expect the market to soar to $545.57 billion. This means a compound annual growth rate (CAGR, the steady yearly increase) of about 6.7% over ten years, showing strong investor trust and industry growth.
- Key drivers: Economic ups and downs, like recessions and trade wars (as Austrian economics highlights), boost precious metals’ appeal. New tech in mining and recycling improves supply, and eco-concerns push for sustainable sourcing.
- Challenges: Volatility in prices due to speculative trading and regulatory changes in mining could temper growth, yet the intrinsic value of these metals remains resilient.
The Global Precious Metal Market is growing fast and looks ready for big wins. Investors and manufacturers, grab these insights now to spot chances in a blend of old traditions and new ideas that steady the world economy with precious metals’ lasting charm!