Economic uncertainties are rising. The green revolution is speeding up.
Silver stands out as an undervalued metal. It beats gold and platinum in uses and growth potential.
We use data from the U.S. Geological Survey and market reports. Explore silver’s price history, supply shortages, demand surges, roles in solar and EVs, inflation protection, growth drivers, risks, and investment tips.
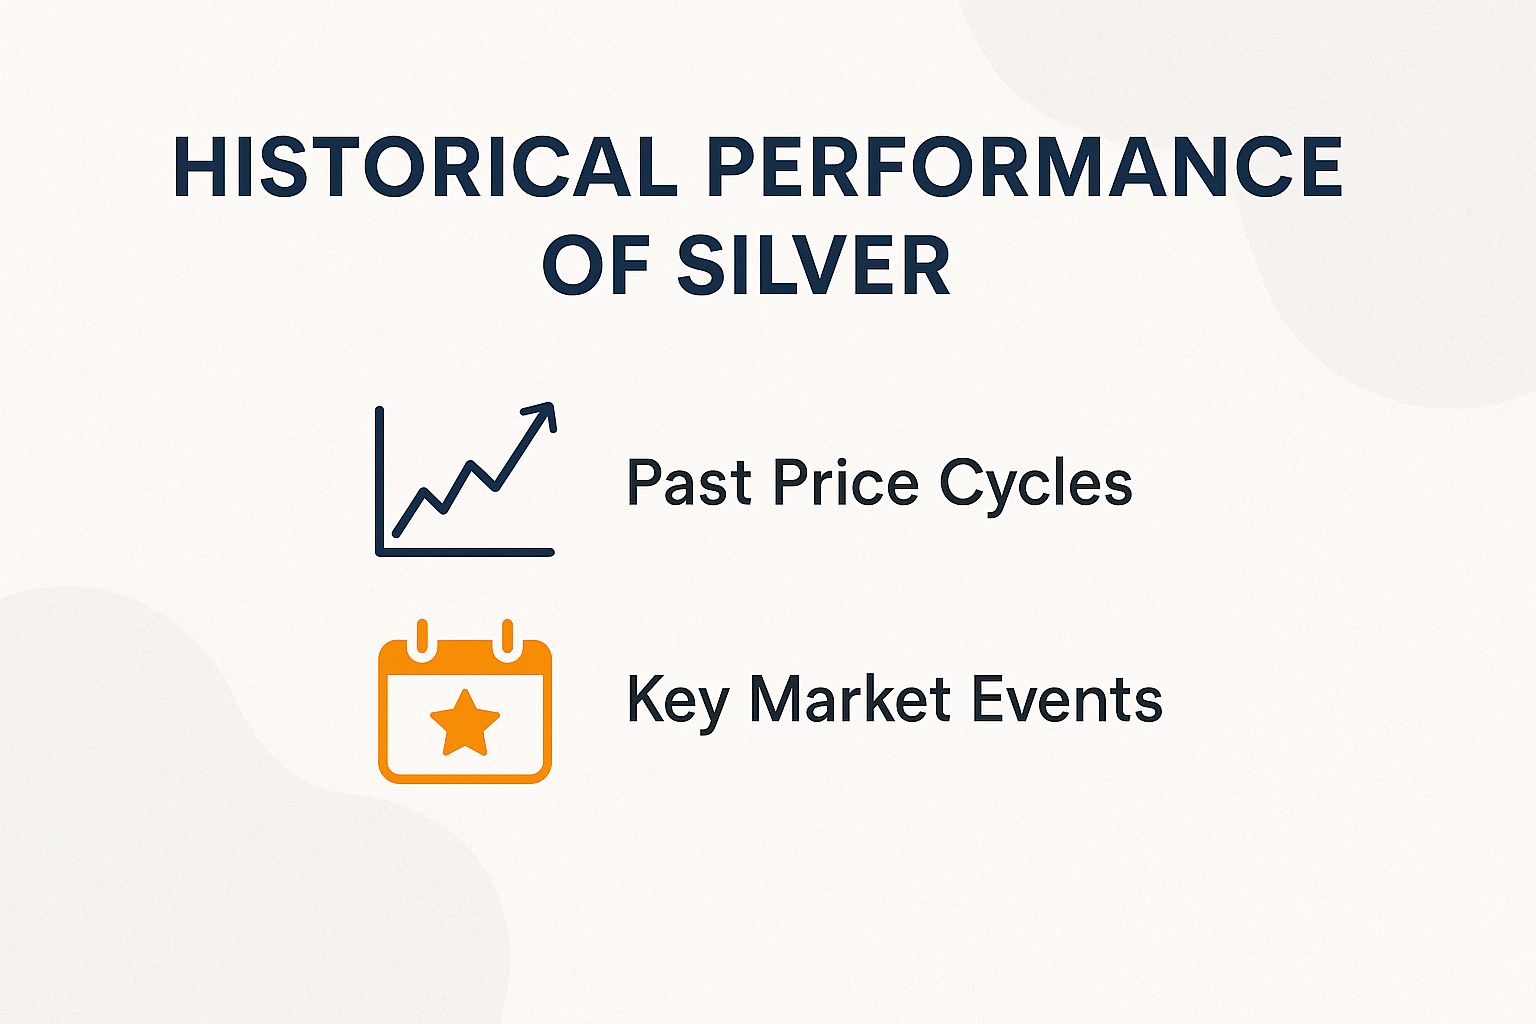
Historical Performance of Silver
Silver’s price swings wildly in good and bad markets. It jumped from $4.01 per ounce in 2001 to $48.70 in 2011-exciting gains!
Strong demand from industries and loose money policies fueled this rise. Check London Bullion Market Association data for charts and basics-chart analysis means spotting patterns visually.
Past Price Cycles
In 1980, the Hunt Brothers tried to corner the silver market. Prices skyrocketed 1,200% to $49.45-watch out for bubbles like this!
- From the 1960s to 1980, prices soared from $1.29 to $49.45 per ounce. Inflation and speculation drove it, per Federal Reserve records.
- The 1990s were characterized by price stagnation within the $4 to $5 range, resulting from a post-Cold War surplus in global supply.
- The rally from 2001 to 2011 elevated prices from $4 to $48.70 per ounce, propelled by expansions in the housing market and surging demand from China (per data from the Silver Institute).
- The 2020 surge advanced prices from $12 to $29 per ounce, attributable to expansive economic stimulus measures in response to the COVID-19 pandemic.
Keep an eye on key signals like price breaks above the 200-day moving average-a line showing average price over 200 days. It predicted the 2011 high.
Use TradingView to add these to silver charts (XAGUSD is silver’s trading code). Set alerts for buys when prices break key averages-don’t miss the next big move!
Key Market Events
The 2011 flash crash hit after MF Global collapsed. Prices dropped 30% in days, showing regulatory risks-hedging means protecting your investments, per the 2012 CFTC report.
Silver markets swing wildly, as this shows. Get ready for ups and downs!
- Lesson 1: Volatility can strike fast.
- Lesson 2: Diversify to hedge risks.
#n0hrnxxr.bar-container { position: relative; overflow: visible!important; } #n0hrnxxr.bar-value { position: absolute!important; left: 50%!important; top: 50%!important; transform: translate(-50%, -50%)!important; color: white!important; font-weight: 700!important; font-size: 14px!important; white-space: nowrap!important; background: rgba(0, 0, 0, 0.7)!important; padding: 4px 12px!important; border-radius: 20px!important; z-index: 30!important; text-shadow: 0 1px 2px rgba(0, 0, 0, 0.3)!important; pointer-events: none!important; display: inline-block!important; } #n0hrnxxr.animated-bar { z-index: 1!important; } @media (max-width: 768px) { #n0hrnxxr { padding: 16px!important; } #n0hrnxxr h2 { font-size: 24px!important; } #n0hrnxxr h3 { font-size: 16px!important; } #n0hrnxxr.bar-label { font-size: 12px!important; } #n0hrnxxr.metric-card { padding: 20px!important; } #n0hrnxxr.bar-value { font-size: 13px!important; padding: 3px 10px!important; } } @media (max-width: 480px) { #n0hrnxxr { padding: 12px!important; } #n0hrnxxr h2 { font-size: 20px!important; } #n0hrnxxr h3 { font-size: 14px!important; } #n0hrnxxr.bar-label { font-size: 11px!important; margin-bottom: 6px!important; } #n0hrnxxr.bar-value { font-size: 12px!important; padding: 2px 8px!important; min-width: 45px!important; text-align: center!important; } #n0hrnxxr.bar-container { height: 36px!important; overflow: visible!important; } }
- The 1980 Hunt Brothers manipulation. Prices soared through futures contracts-agreements to buy or sell silver at a future date-before crashing hard. JPMorgan paid $1 billion in 2020 (CFTC data). Lesson: Avoid heavy borrowing in futures trading. Spread your money into physical silver bars or coins. Watch out for storage fees to cut risks and protect your investments.
- The 2008 financial crisis hit hard. Silver prices dropped 50% then bounced back 400% by 2011 (IMF data). Lesson: Buy low during crashes for long-term gains. Use ETFs like SLV-funds that track silver prices-to make it easy. Remember taxes on profits when you sell.
- The 2021 Reddit frenzy sparked a short squeeze. Prices jumped 15% in a week, driven by everyday investors chasing the hype (WallStreetBets). Lesson: Track buzz on StockTwits for market mood swings. Time your buys right and hold tight-HODL- even as big players move in. Get in now before the next wave!
- Allegations of 2013 COMEX manipulation shook the market. Banks faced $920 million in fines (CFTC). Lesson: Use options-contracts giving the right to buy or sell at set prices-to dodge manipulation tricks. Spot arbitrage chances, like price differences, to profit safely.
- The 2022 Russia-Ukraine war fueled global tensions. Silver prices climbed 10% over supply fears and disruptions (Bloomberg). Lesson: Stay alert to world news via Reuters updates. Treat silver as a safe spot to park money during chaos. Factor in how tariffs might hit prices.
Current Supply and Demand Dynamics
Silver mining in top spots like Mexico, Peru, and China fell short in 2023. The global deficit hit 184 million ounces, marking five years straight of shortages (Silver Institute’s World Silver Survey).
Supply chain hiccups made things worse. Demand keeps climbing, pushing prices up-act fast to lock in opportunities!
Year-over-Year Changes in Silver Demand and Supply (2024)
Year-over-Year Changes in Silver Demand and Supply Components (2024)
Year-over-Year Changes in Silver Demand and Supply Components (2024) dives into the silver market’s exciting shifts. It spotlights how demand and supply moved compared to last year.
Silver shines in jewelry, factories, gadgets, 5G networks, healthcare, and investments. Economic swings, tech breakthroughs, and global drama spark big year-over-year changes – get ready for the details!
Demand Breakdown: Industrial use eats up over half of all silver worldwide. It jumped noticeably in 2024, thanks to solar panels and electronics.
Solar power is exploding! Photovoltaic (PV) panels – that’s solar tech – use silver in conductive pastes and grew 15-20% year-over-year with the rush to clean energy.
Electronics demand climbed 5-10%. Smartphones and 5G chips bounced back as people spent more after the pandemic.
Jewelry and silverware grew just 2-3% in big markets like India and China. These areas react fast to money worries and changing incomes.
Investors went wild, up 10-15%! They grabbed bars, US Mint coins, and ETFs like SLV – easy-to-trade funds that can beat or lag the silver price for smart deals – to hedge inflation and add sparkle to portfolios.
- Top Demand Boosters: Green tech is booming! Electric vehicles need silver for batteries and wiring, driving a thrilling 12% jump in auto use last year.
- Where Demand is Hot: Asia-Pacific surged 8% ahead. North America steadied after its big wins.
Supply Breakdown: Most silver comes as a side product from mining copper, lead, and zinc. Primary mining dropped 3-5% year-over-year due to worker shortages and tough rules in key spots like Mexico and Peru.
Recycling saved the day, up 7%! Higher prices got people collecting scrap from old gadgets and factory leftovers.
Supply can’t keep up – deficits hit 100-200 million ounces in 2024! This shortage is pushing prices higher fast – act now if you’re watching silver.
- Mining Output: South America’s output fell 4% year-over-year. Blame strict eco rules and local protests – it’s tightening the market!
- Recycled Silver: Better collection is ramping it up, covering some mining gaps.
- Stockpile Drawdowns: Old reserves are keeping things steady for now. But they’re vanishing quicker than new supply arrives – urgency ahead!
- Investment Options: Royalty companies and streaming deals let you tap silver miners safely, skipping the dirt and risks.
Year-over-year changes highlight silver’s role in industry and investment. Demand has outpaced supply for four years straight.
This gap may keep prices high. It helps producers but hurts manufacturers.
Watch these trends closely. Changes in eco-friendly mining and recycling could change supply chains.
2024 data shows a tight market. Diversify sources now to cut risks. Get ready – this could shake things up!
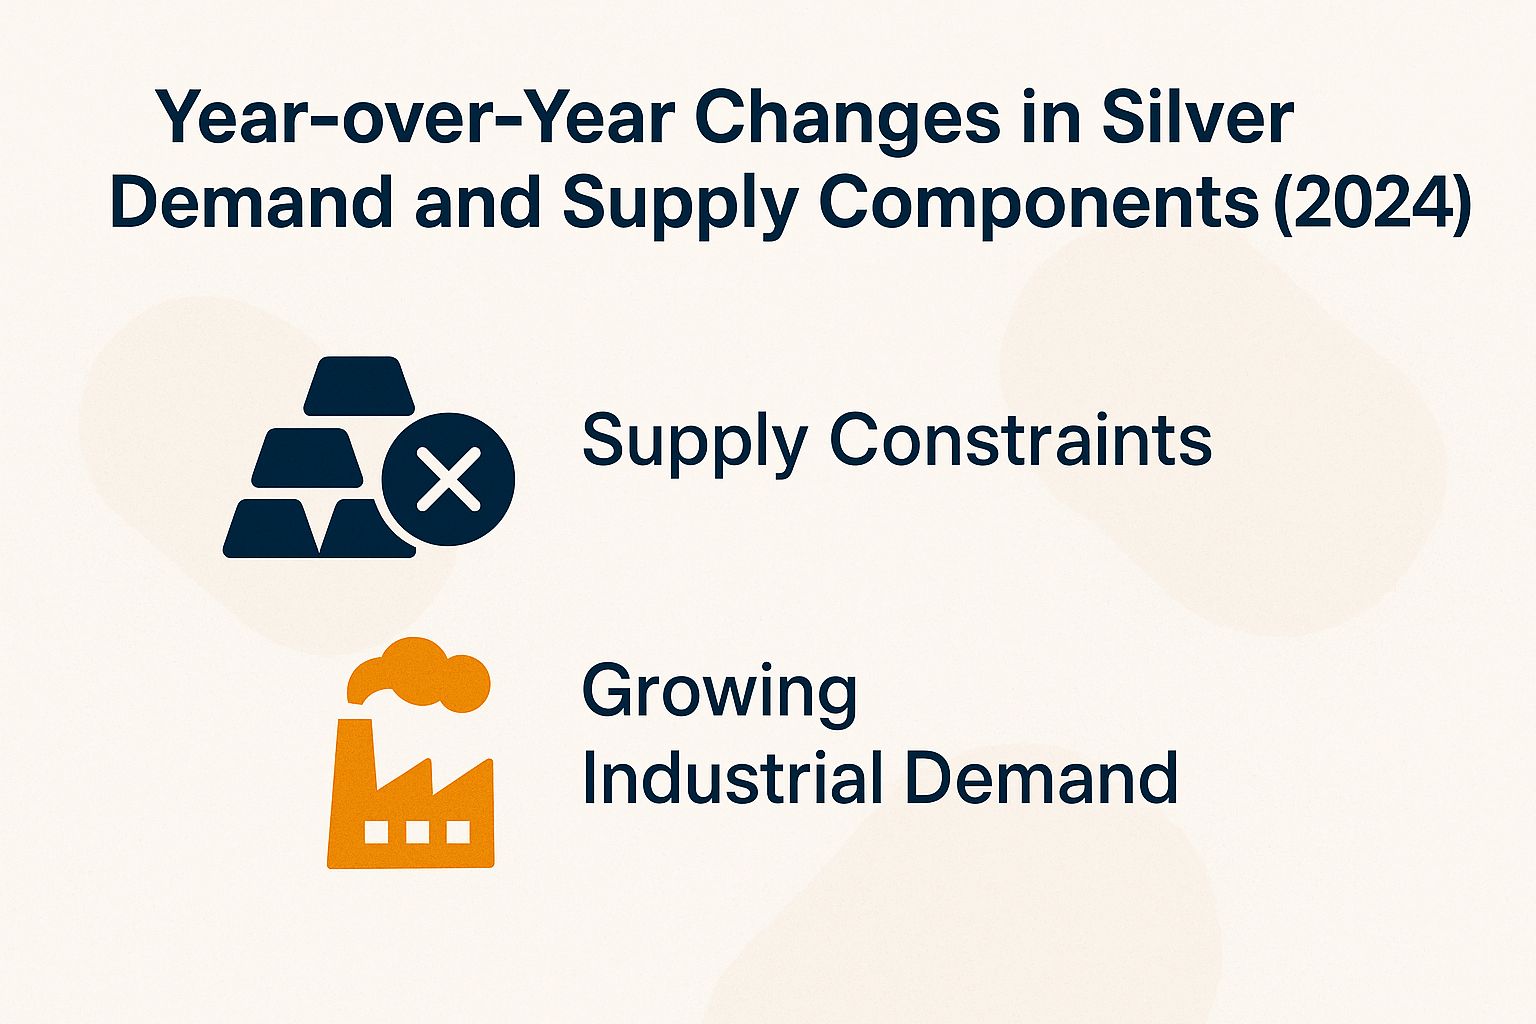
Supply Constraints
Silver mine output stayed flat at 830 million ounces in 2023.
It dropped 1% from 2022 due to lower ore quality and delays in permits in Mexico and Peru. Check the USGS Mineral Commodity Summaries for details.
Several critical supply constraints contributed to this trend, encompassing the following four factors:
- Top countries saw drops. Peru hit 130 million ounces, down 5% from last year. Mexico stayed at 190 million ounces (Silver Institute).
- About 70% of silver comes from copper and lead mining by-products. This makes supply swing with base metal prices (World Bank).
- Recycling produced 184 million ounces in 2023, below demand. ETF sales drained stocks even more.
- Geopolitical issues block growth. Argentina’s mine takeovers are a big hurdle (Reuters).
Grab the yearly USGS reports for solid forecasts and deep insights. Don’t miss them!
Growing Industrial Demand
- Industrial demand hit 654 million ounces in 2023, up 10% from last year. Electronics and solar led the charge (Silver Institute).
- Electronics took 38% share with 250 million ounces. It grew 12% thanks to 5G boom (Statista).
- Solar panels used 160 million ounces. Expect 24% yearly growth to 2030 – that’s huge for green energy (IRENA).
- Jewelry, especially in India, added 200 million ounces. Cultural love keeps it growing 5%.
- Medical uses hit 50 million ounces. New antibacterial tech post-COVID drives this (WHO).
- Other areas totaled about 164 million ounces. Car catalysts balanced out falling photography.
The following table summarizes the key segments, volumes, growth rates, and projections:
| Segment | Volume (Moz) | Growth Rate | Key Projection/Driver |
|---|---|---|---|
| Electronics | 250 | +12% | 5G semiconductors |
| Photovoltaics (Solar) | 160 | +24% CAGR | To 2030 (IRENA) |
| Jewelry/India | 200 | +5% | Cultural demand |
| Medical | 50 | N/A | Antibacterial coatings |
| Other | ~164 | Balanced | Auto catalysts offset photography decline |
CAGR means steady yearly growth rate.
Create a pie chart of 2023 demand with Google Charts. It spotlights electronics at 38% – the top player!
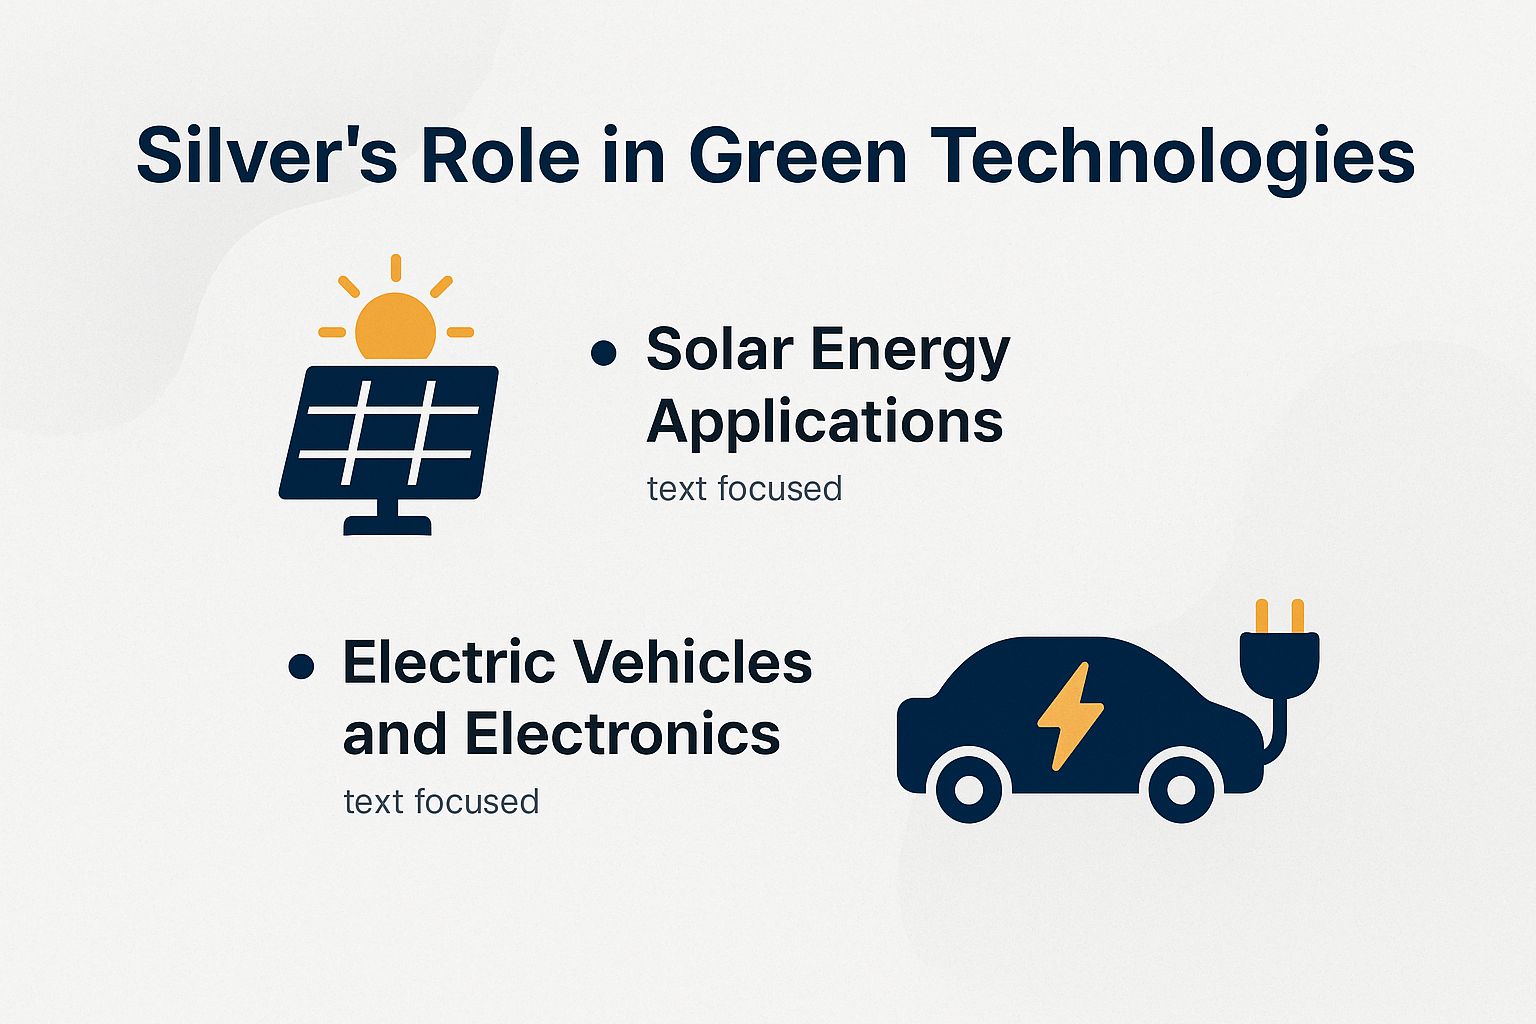
Silver’s Role in Green Technologies
Silver conducts electricity like a champ. This makes it key for green tech.
A 2023 BloombergNEF study predicts solar panels will use 20% of all silver by 2030. Exciting times ahead!
Solar Energy Applications
Every solar panel needs 20 grams of silver paste for its wiring. In 2023, this drove demand to 120 million ounces, up 38% since 2020 (International Energy Agency). Solar is booming!
Silver plays a pivotal role in solar technology, manifesting across several critical processes. In photovoltaic cells, silver electrodes achieve efficiencies exceeding 22% through their superior conductivity, as evidenced by research from the National Renewable Energy Laboratory (NREL).
Projections indicate that demand will reach 265 million ounces by 2030, representing an 85% increase, based on estimates from the Silver Institute.
China’s addition of 50 gigawatts of solar capacity in 2023, as outlined by Bernreuter Research, illustrates this trend, underscoring the substantial silver requirements essential for large-scale deployment.
Switching to copper plating cuts efficiency by 10%. Silver simply performs better.
Subsidies under the U.S. Inflation Reduction Act are accelerating the adoption of solar technologies, compelling manufacturers to prioritize silver in order to maximize yields.
Electric Vehicles and Electronics
Silver use in electric vehicles (EVs) jumps 25% each year. EVs need 25 to 50 grams of silver for wiring and batteries.
Demand could hit 80 million ounces by 2025, says IDTechEx.
5G networks rely on silver for key parts like RFID tags and antennas. Expect 50 million ounces needed yearly, says Ericsson’s Mobility Report – the tech revolution is here!
Semiconductors use high-purity silver wires for top reliability, with steady growth per SEMI data. Everyday gadgets like iPhones with OLED screens pack in about 0.34 grams of silver each.
The expansion of Tesla’s Gigafactory operations contributes an additional 10 million ounces of silver demand each year. For insights into emerging trends and investment opportunities, resources such as SEMI.org are recommended.
Monetary and Safe-Haven Appeal
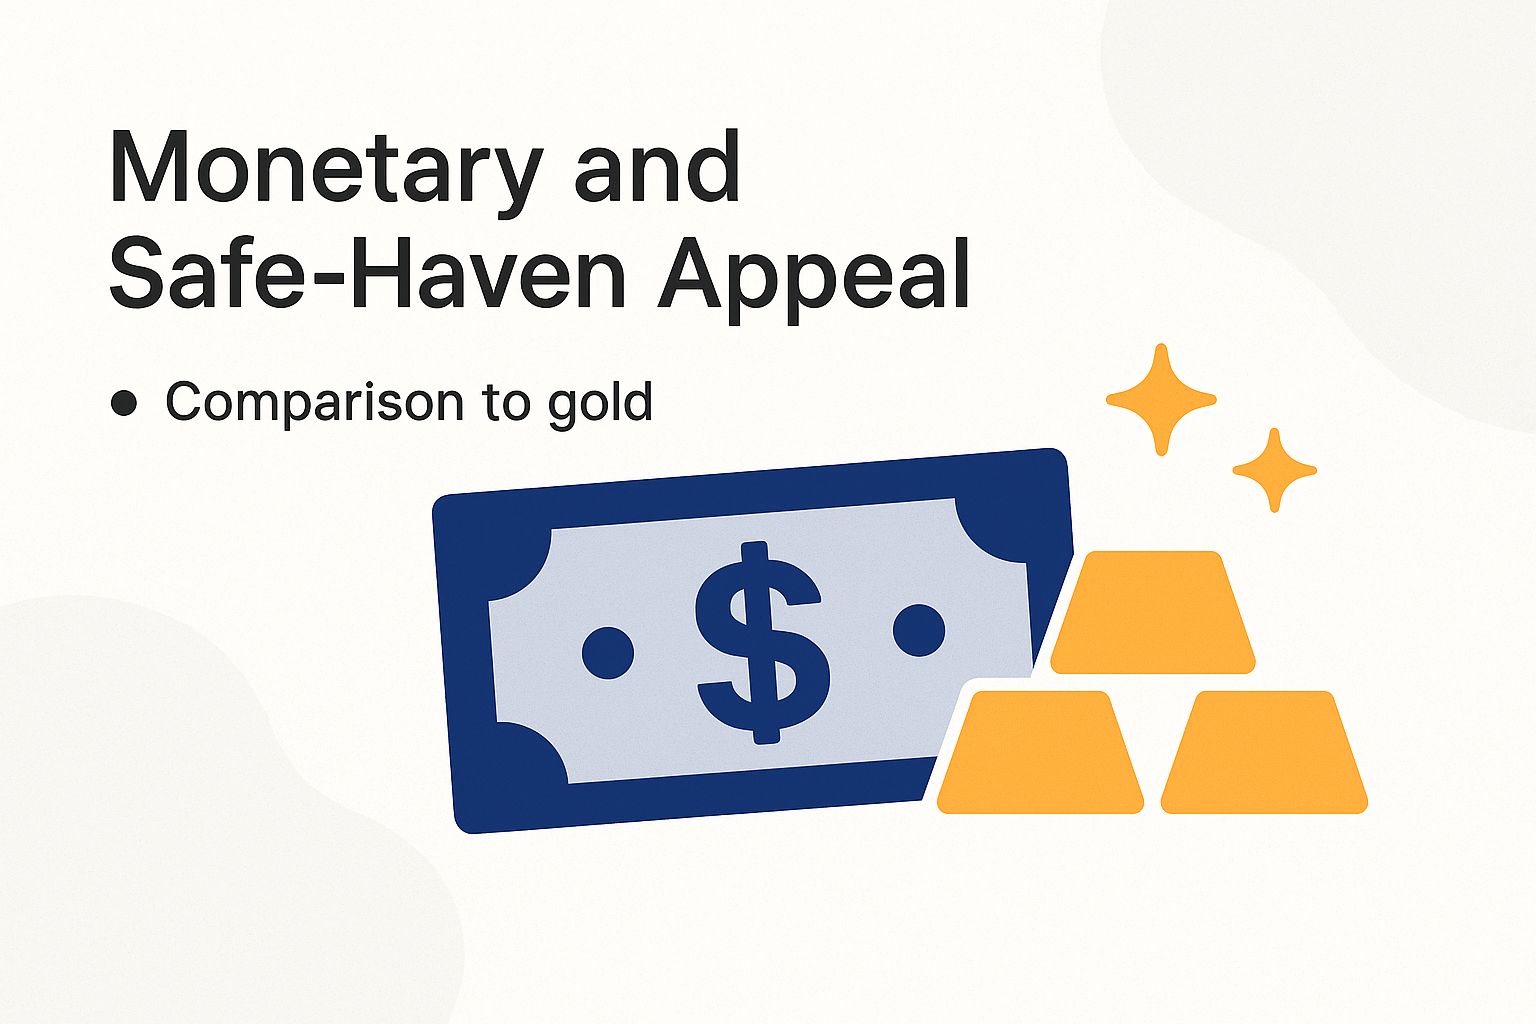
In 2022, inflation hit 9.1%. Silver prices climbed 3%, acting as a strong shield against economic worries.
Coins like American Silver Eagles from the US Mint became hot items. Silver beat the US dollar, which dropped 15%, per Federal Reserve data.
Comparison to Gold
The gold-silver ratio is now 82:1. That’s higher than the usual 50:1, meaning silver looks like a bargain with big upside in booming markets – it’s sparking FOMO (fear of missing out), as Kitco’s 2023 report shows.
Investors may capitalize on this dynamic by diversifying their portfolios with both metals through exchange-traded funds (ETFs). Gold serves as a safe-haven asset for preserving wealth amid market volatility, while silver presents growth opportunities driven by industrial demand.
Consider establishing a hybrid portfolio with a 5% allocation to each metal, as recommended in Vanguard’s 2022 diversification study to achieve balanced risk exposure.
table { border-collapse: collapse; width: 100%; } th, td { border: 1px solid #ddd; padding: 8px; text-align: left; } th { background-color: #f2f2f2; }
| Metric | Gold | Silver |
|---|---|---|
| Focus | Safe-haven | Industrial + monetary |
| Price/Oz | $2,000+ | $25 |
| Volatility | Low | 2x gold |
| Key ETF (AUM) | GLD ($190B) | SLV ($14B) |
| 5-Year Return (Yahoo Finance) | 50% | 60% |
| Correlation to Gold | – | 0.8 |
Grab GLD shares for steady protection and SLV for that exciting growth potential. Or hold onto physical silver – HODL (hold on for dear life) it for the long haul, and rebalance every quarter to ride the gold-silver wave.
Potential Price Catalysts
According to analysts at UBS, COMEX silver prices are projected to reach $28 per ounce by 2025, propelled by a sustained supply deficit and the expansion of green energy applications, as detailed in their 2024 Commodities Outlook Report.
Exciting catalysts could push silver prices higher fast. Key drivers:
- Supply shortages building pressure.
- Green energy boom demanding more silver.
- Global economic shifts favoring precious metals.
- Widening of the supply deficit in major producing countries like Mexico and Peru (70% probability, potentially resulting in a 20% price increase; data from the Silver Institute).
- Federal Reserve interest rate cuts (60% probability, mirroring the impacts of the 2020 stimulus measures; CME FedWatch Tool).
- Surge in green technology adoption and 5G technology (80% likelihood, supported by Inflation Reduction Act subsidies; BloombergNEF report).
- Escalating geopolitical tensions (50% probability, such as intensifying trade conflicts; IMF World Economic Outlook).
- Rebound in inflation (40% probability, with the Consumer Price Index exceeding 3%; consensus from Reuters poll).
- Potential for a short squeeze (30% probability; COMEX positioning data).
Imagine investing $10,000 in silver at $25 per ounce. If prices hit $35, you could see a thrilling 40% return, making silver a must-have in your portfolio and sparking FOMO – that’s fear of missing out – among buyers.
This highlights silver’s power to boost diversified investments. Don’t wait – act now to join the silver surge!
Risks and Mitigation Strategies
Silver can be a wild ride. Its 30-day standard deviation hits 25%, meaning big ups and downs – like the 35% drop in 2013 when the Federal Reserve tightened policy (check Bloomberg data).
This volatility brings real risks. Get ready, but smart strategies can help you stay ahead!
A comprehensive study by RiskMetrics on the volatility of precious metals identifies four principal risks confronting investors.
- Price swings are a top risk. Silver dropped 25% in 2022 due to inflation fears. Beat this with dollar-cost averaging: buy a bit each month over 12 months to smooth out highs and lows. It’s simple and effective – start today!
- Market manipulation is another danger. JPMorgan paid $920 million in 2020 for illegal tricks called spoofing, per the CFTC. Stick to safe ETFs like iShares Silver Trust (SLV) to avoid the mess – they’re regulated and easy.
- Factory slowdowns hurt demand. Watch for dips in China’s GDP or India’s economy – they drive much of silver’s use. Fight back by diversifying: split 60% stocks and 40% silver, as Morningstar suggests. This keeps your portfolio strong!
- Storage and theft are sneaky risks. Bullion extras cost 5-10% more. Go secure with allocated IRAs from trusted pros like Equity Trust – they’re insured and protect your silver. Secure yours now before it’s too late!
Investment Approaches for Silver
Own real silver bullion for that hands-on feel. It costs 3-5% more than the spot price from LBMA.
Perfect for long-term in a self-directed IRA. The IRS loves it for tax-deferred growth – build wealth without the tax hit!
To achieve diversification, it is advisable to allocate 5-10% of a portfolio to silver through the iShares Silver Trust (SLV) exchange-traded fund (ETF). The following table compares various investment approaches:
| Method | Cost | Liquidity | Risk | Best For |
|---|---|---|---|---|
| ETFs (SLV) | 0.5% expense ratio | High | Low storage | Beginners |
| Mining Stocks (SLVP ETF) | Volatile, 2x leverage | High | High market | Aggressive investors |
| Physical (American Silver Eagle from the US Mint) | 4% premium | Medium | Storage/theft | Long-term holders |
| Futures (COMEX) | 5-10% margin | High | High leverage | Speculators |
| Options (CBOE) | $0.50/contract premium | High | Time decay | Hedging |
Set up an IRA with Rocket Dollar for just $360. Open online, roll over funds, and buy through Equity Trust – it’s quick and straightforward.
Heads up on taxes: long-term gains on physical silver top out at 28% (see IRS Publication 544). Plan smart to keep more of your profits!
Start with SLV ETF – it’s simple and easy to hold long-term. Morningstar says it can boost your portfolio by 10% against inflation. Jump in and watch your investments shine!