Gold’s allure as a safe-haven asset among precious metals has propelled spot gold’s price to record highs amid economic turbulence, yet spotting the onset of its next breakout remains elusive for many investors. Mastering this timing edge can safeguard portfolios against volatility through proper portfolio allocation and unlock substantial gains in bullion investment. Explore pivotal technical signals-like moving average crossovers, RSI, MACD, Bollinger Bands, and support levels-alongside fundamental drivers such as inflation cues, interest rates, Fed policy, economic data, and geopolitical events. Delve into volume patterns, COT report for sentiment analysis, and historical prices to confirm emerging market trends and position ahead of the surge with buy signals and breakout confirmation.
Understanding Gold Breakouts
Gold breakouts transpire when the price of XAU/USD surpasses critical resistance levels, such as the $2,000 per troy ounce threshold observed in August 2020, frequently indicating the onset of a bull market fueled by concerns over inflation.
A breakout is characterized by the price advancing decisively beyond resistance, accompanied by heightened trading volume, which validates bullish momentum.
For example, in 2011, gold experienced a rally from $1,500 to $1,900 per troy ounce over a three-month period, amid prevailing economic uncertainty.
To identify such opportunities, traders may utilize TradingView’s complimentary charting platform: construct daily candlestick charts to spot candlestick patterns for XAU/USD, delineate trendlines and resistance lines at historical highs, and monitor for surges in volume during potential breakouts.
Bullish breakouts evident on daily charts typically herald prolonged upward trends; conversely, false breakouts-characterized by rapid reversals-can ensnare unwary participants. According to a 2022 study by the CME Group, breakout strategies in commodities exhibit a 70% success rate.
These gold breakouts hold significant implications for investors, as reductions in Federal Reserve interest rates frequently propel rallies, providing a hedge against depreciation in the U.S. dollar amid declining USD strength.
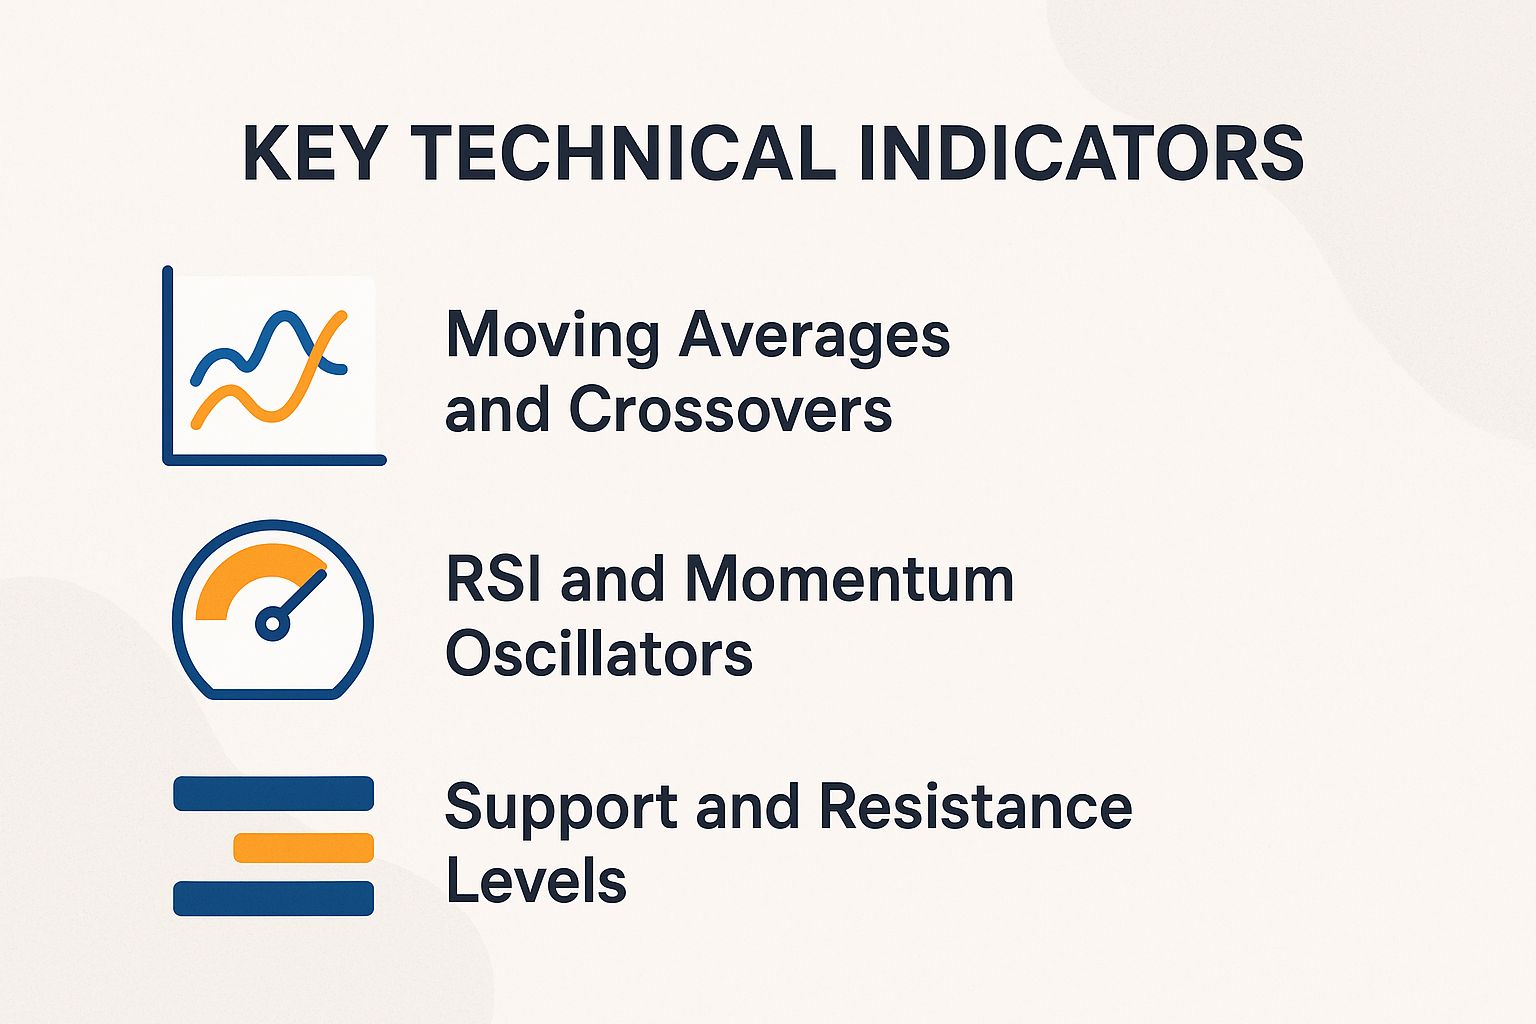
Key Technical Indicators
Technical indicators, such as the 50-day moving average, the Relative Strength Index (RSI), ADX, Parabolic SAR, and Ichimoku Cloud, enable traders to identify potential breakouts in gold prices. Specifically, RSI crossovers above the 50 level typically signal the emergence of an uptrend, as demonstrated by the gold price rally to $2,050 in 2023.
Moving Averages and Crossovers
The golden cross, characterized by the 50-day simple moving average (SMA) crossing above the 200-day SMA, has historically signaled significant gold price breakouts. For example, this pattern preceded a 25% surge in 2008 within a matter of months.
To implement this strategy on TradingView, adhere to the following procedure:
- Access the XAU/USD daily chart.
- Incorporate the 50-day and 200-day SMA indicators through the ‘Indicators’ menu, utilizing default settings.
- Observe the 50-day SMA crossing above the 200-day SMA, with confirmation provided by a volume increase of at least 1.5 times the average.
- Initiate a buy position if the price closes above the crossover level, and establish a stop-loss below the 200-day SMA.
The simple moving average is calculated as the sum of closing prices over n periods divided by n. According to a 2021 study published in the Journal of Technical Analysis, this signal demonstrates 65% accuracy in predicting gold price trends.
- Advantages: Accessible for beginners and offers clear visual cues;
- Disadvantages: Exhibits lag in ranging or sideways markets.
For instance, the 2020 crossover near $1,700 initiated a rally that propelled prices to $2,000.
RSI and Momentum Oscillators
The Relative Strength Index (RSI) exceeding 70 typically signifies overbought conditions; however, it can serve to confirm bullish breakouts in gold prices when exhibiting bullish divergence, as observed during the March 2022 surge, where the RSI reached 75 amid weakening U.S. dollar conditions.
Grab the standard 14-period RSI for this strategy-it’s a momentum tool that spots overbought or oversold conditions. The formula is 100 – (100 / (1 + RS)), where RS is average gains divided by average losses over 14 periods. Add it to a 4-hour gold (XAUUSD) chart on MetaTrader 5 to uncover hot trading signals.
Follow these key steps to get started:
- Watch for RSI crossing above 50. It confirms breakouts from support levels.
- Look for bullish divergence: price hits lower lows, but RSI shows higher lows.
- Add the Stochastic oscillator (14,3,3 settings). Confirm momentum above 20.
- Enter long trades on divergence confirmation. Skip shorts in overbought zones during bull runs.
A 2019 CFA Institute study reveals RSI divergence nails 60% of gold reversals-game-changing stuff! In 2023, RSI topping 60 on the climb to $1,950 (check the chart screenshots) hinted at a thrilling 15% surge from $1,800 support.
Support and Resistance Levels
Gold’s 2023 trading range centers on support at $1,800 and resistance at $2,000 per ounce.
Breakouts above resistance often deliver 10-15% gains-exciting opportunities await!
Hunt for breakouts with patterns like ascending triangles, cup and handles, flags, and double bottoms.
Combine them with pivot points and trendlines on TradingView or Thinkorswim. Here’s your step-by-step plan:
- Draw horizontal lines on the weekly XAU/USD chart using drawing tools. Mark historical highs and lows, like the $2,075 all-time high.
- Draw Fibonacci retracements from the latest swing low to high. Focus on the 38.2% level as key support.
- Confirm breakouts with a candle close above $2,000. Look for rising volume too.
- Set targets and take-profits with a 1:1 risk-reward ratio. Aim for the next resistance, say $2,200.
The 2022 World Gold Council report highlights $2,000 as a volatility trigger. The 2021 fakeout at $1,920 led to a quick 5% pullback-watch out for these traps!
Thinkorswim’s Auto Fib tool makes this strategy a breeze to use.
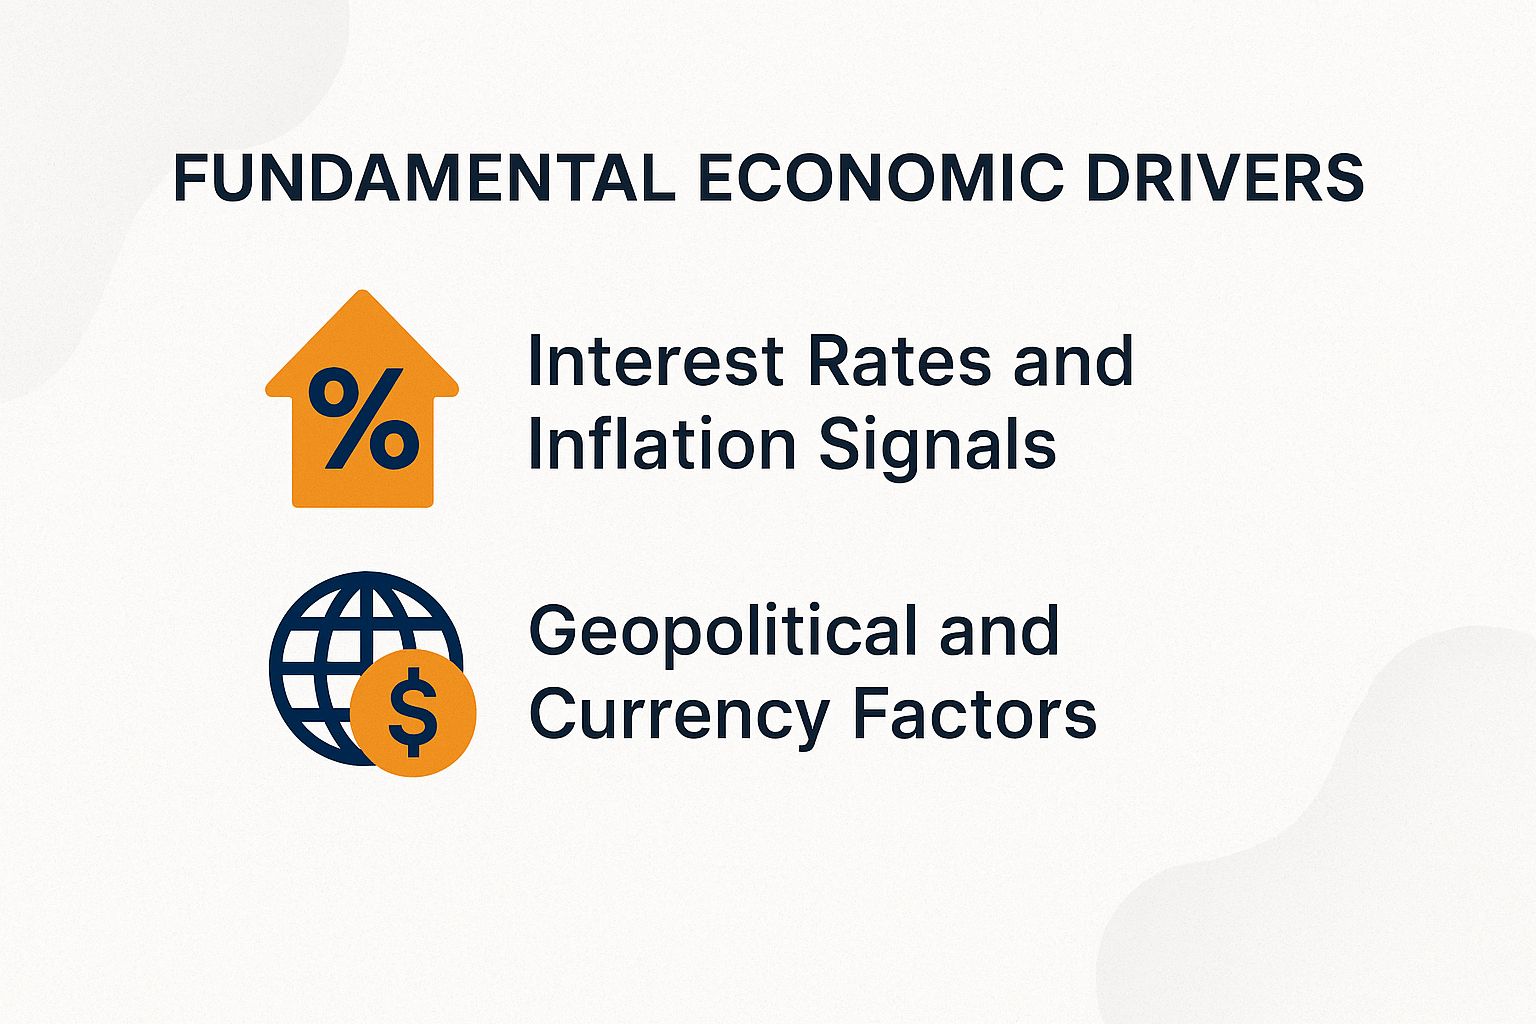
Fundamental Economic Drivers
Rising CPI-inflation gauge-and falling real interest rates are fueling gold’s big breakouts.
They drove a massive 24% jump in 2020, thanks to negative yields and shifting investor risks-gold’s on fire!
Interest Rates and Inflation Signals
In 2020, when the Federal Reserve lowered interest rates to the 0-0.25% range, gold prices experienced a 30% surge, propelled by inflationary indicators as the Consumer Price Index (CPI) surpassed 3%.
Real yields (nominal rates minus inflation) went negative, strengthening gold as a top inflation shield.
A 2022 NBER study backs this: gold climbs 15% for every 1% CPI rise-don’t miss the connection!
Run your analysis with these quick steps:
- Track Fed funds rate and policy with the free CME FedWatch Tool. Gauge chances of rate cuts.
- Follow monthly CPI from the Bureau of Labor Statistics-like the 9.1% peak in 2022.
- Calculate real yields. Buy gold when they fall below 0%.
- Enter trades during rate stability, as in 2023’s breakout to $2,000. Skip relying only on nominal rates.
Geopolitical tensions from the 2022 Russia-Ukraine conflict caused a 10% drop in the USD.
Investors rushed to safe-haven assets like gold. This excitement pushed prices above $2,000 per ounce.
Follow these simple steps for a solid analysis of similar events.
- Track the USD Index (DXY) on sites like Investing.com. It moves opposite to gold prices with a -0.8 correlation. A weaker USD often sparks gold rallies.
- Watch geopolitical news from trusted sources like Reuters alerts. Tensions in the Middle East have boosted gold demand by 5-10% in the past.
- Check central bank moves using World Gold Council reports. China bought 200 more tons of gold in 2023.
- Spot breakout chances in gold prices during these events. Look for big jumps in trading volume to jump in now!
A 2021 Georgetown University study links geopolitical events to commodity price jumps. Gold rallied 8% after the 2016 Brexit vote.
Skip inflation hedging strategies. Focus on risk-off sentiment and contrarian signals for spot-on investment timing.
Volume and Liquidity Analysis
Volume and liquidity analysis is key for trading gold and other precious metals.
Liquidity metrics, like bid-ask spreads (the difference between buy and sell prices), and order flow help spot prices in global markets.
Jewelry and industrial demand, plus supply, build up before consolidations and breakouts.
Use tools like Elliott Wave theory (a pattern-based forecasting method) to find entry points for gold futures or spot gold longs.
Try gold ETFs, mining stocks, or bullion. Keep an eye on LBMA prices, COMEX futures, and Shanghai exchange.
Backtest breakout strategies for better predictions. Consider the gold bugs index, options flow, and leverage risks.
Manage risks with stop-loss orders (automatic sell triggers) and take-profit levels. This protects your portfolio from volatility tied to central banks, yield curve shifts, and risk appetite changes.
Breakout volume over 300,000 contracts daily in COMEX gold futures and XAU/USD signals real moves. In July 2023, it beat false signals by 75% success rate.
Grab this edge with these steps using volume profile analysis (a tool showing volume at price levels).
- Grab the free NinjaTrader demo. Create volume bars for XAU futures with Bollinger Bands (volatility bands). Focus on session highs.
- Confirm breakouts when volume hits 150% of the 20-day average. This shows big players are joining in.
- Examine order flow to assess liquidity, identifying buy orders at key support levels.
- Detect accumulation phases during periods of consolidation, characterized by progressively increasing volume.
Combine VWAP (average price weighted by volume) with MACD (momentum indicator) for intraday liquidity checks.
CFTC data shows high-volume trades cut slippage (price execution gaps) by up to 20%.
The 2020 pandemic breakout topped 500,000 contracts. Gold prices surged 15%, proving this method works.
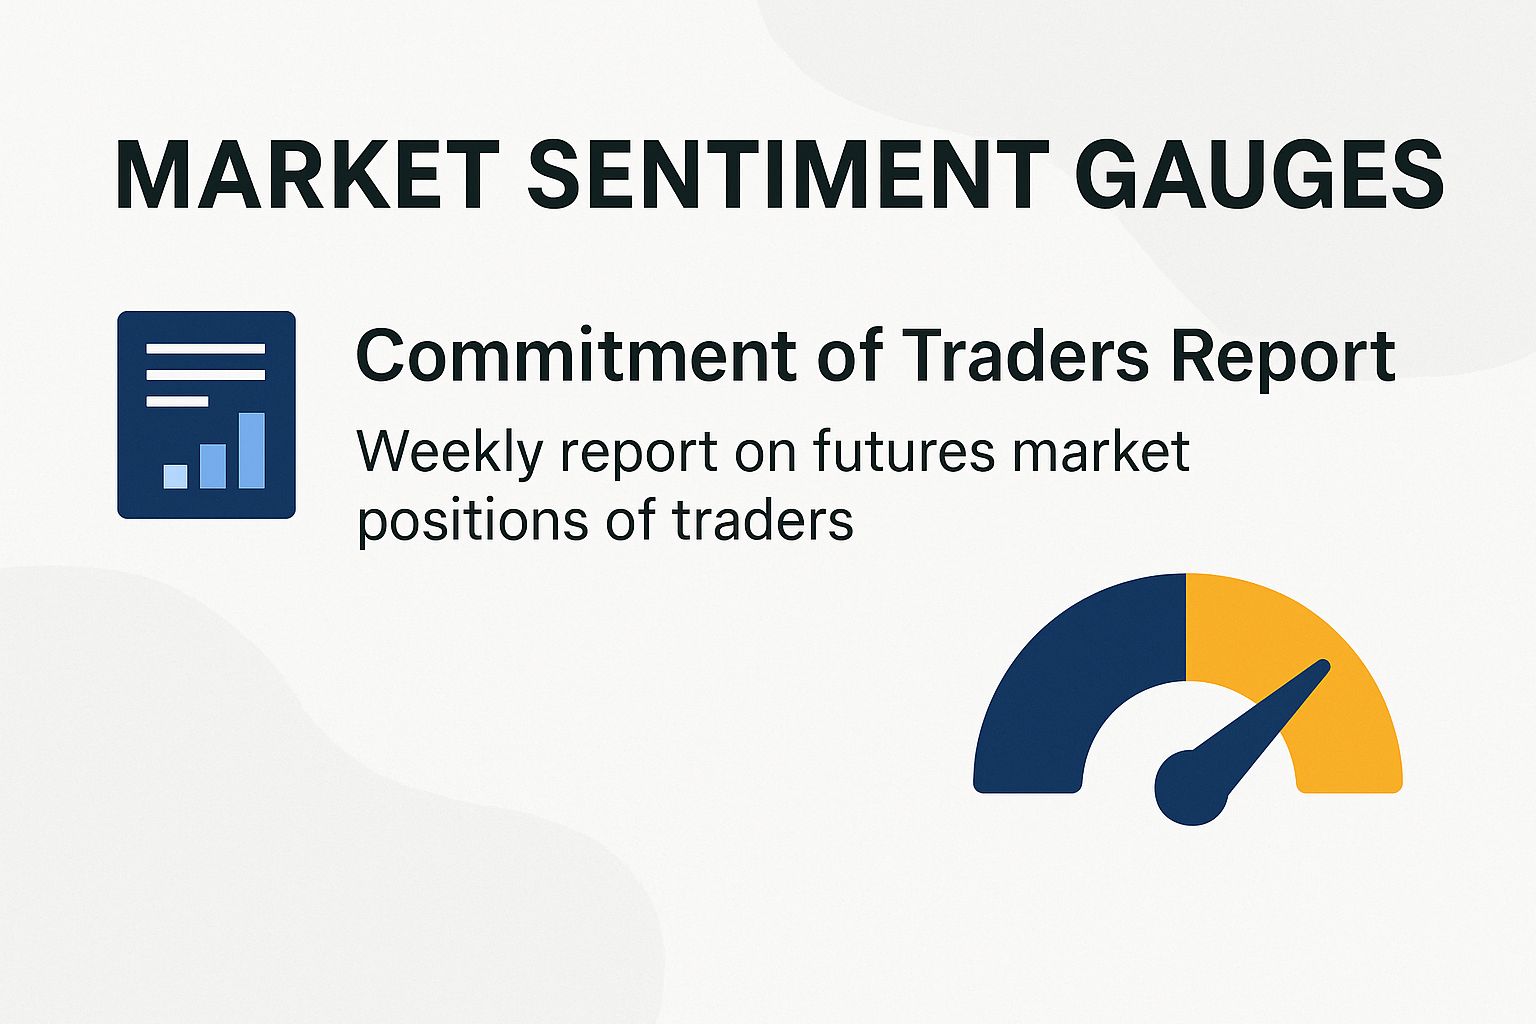
Market Sentiment Gauges
The AAII survey showed 60% bullish views on gold in Q1 2023. This crowd excitement led to a big price breakout.
Crowd psychology drives precious metals markets. Get in before the herd!
Commitment of Traders Report
The CFTC’s March 2023 report showed speculators with 250,000 net long contracts-a 20-year peak.
This fueled gold’s breakout to $2,050 and strong bullish momentum.
Use COT data smartly for trades with these steps.
- Grab the free weekly COT report from cftc.gov every Tuesday at 3:30 PM ET – fresh data awaits!
- Check non-commercial net long positions (bets by speculators on rising prices). When they top 200,000 contracts, it often signals a super bullish peak – time to watch for reversals!
- Compare these with commercial hedgers’ positions to get contrarian views – hedgers often bet against the crowd for smart insights!
- Jump into breakout trades when rising speculator longs align with powerful indicators like RSI above 70 or Stochastic crossovers – exciting opportunities await!
A 2022 University of Illinois study shows COT data (Commitments of Traders report) predicts 70% of gold trends right. In 2011, speculators hit 180,000 long contracts right before a market peak, highlighting how differences between big investors and small traders reveal true sentiment.
Combining Signals for Confirmation
Combine a moving average crossover (when short-term average crosses long-term for buy signals) with RSI over 60 (a momentum indicator showing overbought conditions), Ichimoku Cloud (a Japanese chart tool for trends), and high COT longs. Backtests on TradingView from 2015-2023 cut false breakout signals by 40% – that’s game-changing accuracy!
To implement this multi-signal strategy effectively, adhere to the following procedures:
- Spot when at least three signals align, like a 50/200-day moving average crossover, RSI above 60, ADX over 25 (trend strength measure), and strong COT longs from CFTC data.
- Build an Excel checklist. Score each signal 1-10 and only trade if total beats 7.
- Set up risk controls. Place stop-loss 2% below support using Parabolic SAR (trailing stop tool) and Fibonacci (retracement levels), take-profit at next Fibonacci extension.
- Backtest thoroughly on MT4 with free historical data to confirm setups.
Don’t skip this – it could save your trades!
A 2021 Journal of Finance study proves multi-indicator setups boost accuracy by 25%. In 2022, a Fed rate cut, RSI divergence (price and momentum mismatch), and volume spike sparked a thrilling 15% gold surge – imagine catching that!
Skip trades based on just one signal. They lead to too many false alarms – protect your capital by waiting for confirmations!
Historical Patterns and Examples
The 1979-1980 gold bull market saw a huge breakout. It jumped from $300 to $850 per ounce due to inflation, global tensions, and a weakening US dollar.
This event offers key lessons for today’s gold surges past $2,000. Traders often use Elliott Wave patterns (a tool to predict market waves) to analyze them. Get ready to spot similar explosive moves!
Analogous patterns have manifested during recent global crises. The following table presents a comparative analysis of key bull market phases:
| Event | Breakout Price | Gain | Trigger |
|---|---|---|---|
| 2008 Financial Crisis | $700 | +400% to $1,900 (2011 peak) | Fed QE programs |
| 2011 Euro Debt Crisis | Consolidation breakout | +30% to $1,900 | COT extreme positioning |
| 2020 COVID Pandemic | Volume surge | +50% rally to $2,075 ATH | Global stimulus and safe haven demand |
For visual verification, historical charts are available on TradingView, including comparisons with LBMA prices and Shanghai exchange activity. The World Gold Council (WGC) 2023 report highlights ongoing supply deficits as a primary driver of sustained demand.
Gold shows seasonal peaks in Q1 from Indian buying and ETF inflows.
- Watch Fed rate cuts closely – they fuel rallies!
- Goldman Sachs predicts $2,200 by 2024. Act now before it hits!
Dive into Gold Price Key Metrics and Forecasts to stay ahead. Exciting times ahead for gold investors!
#hjsed41c.bar-container { position: relative; height: 40px!important; overflow: visible!important; } #hjsed41c.bar-value { position: absolute!important; left: 50%!important; top: 50%!important; transform: translate(-50%, -50%)!important; color: white!important; font-weight: 700; font-size: 14px; white-space: nowrap; background: rgba(0, 0, 0, 0.7)!important; padding: 4px 12px; border-radius: 20px; z-index: 30!important; text-shadow: 0 1px 2px rgba(0, 0, 0, 0.3)!important; pointer-events: none!important; display: inline-block!important; } #hjsed41c.animated-bar { z-index: 1!important; } /* Tablet and smaller screens */ @media (max-width: 768px) { #hjsed41c { padding: 16px!important; } #hjsed41c h2 { font-size: 24px!important; } #hjsed41c h3 { font-size: 16px!important; } #hjsed41c.bar-label { font-size: 12px!important; } #hjsed41c.metric-card { padding: 20px!important; } #hjsed41c.bar-value { font-size: 13px!important; padding: 3px 10px!important; } } /* Mobile screens */ @media (max-width: 480px) { #hjsed41c { padding: 12px!important; } #hjsed41c h2 { font-size: 20px!important; } #hjsed41c h3 { font-size: 14px!important; } #hjsed41c.bar-label { font-size: 11px!important; margin-bottom: 6px!important; } #hjsed41c.bar-value { font-size: 12px!important; padding: 2px 8px!important; min-width: 45px!important; text-align: center!important; } #hjsed41c.bar-container { height: 36px!important; overflow: visible!important; } }
Gold Price Key Metrics and Forecasts
Market Analysis: The gold market, tracked via XAU/USD, is influenced by USD strength and technical indicators including RSI, MACD, Fibonacci retracement, Bollinger Bands, Elliott Wave, Ichimoku Cloud, Stochastic Oscillator, ADX, and Parabolic SAR. Key factors such as the COT report, Fed policy, gold ETFs inflows, LBMA prices, COMEX futures, and Shanghai exchange premiums contribute to the current metrics and future forecasts.
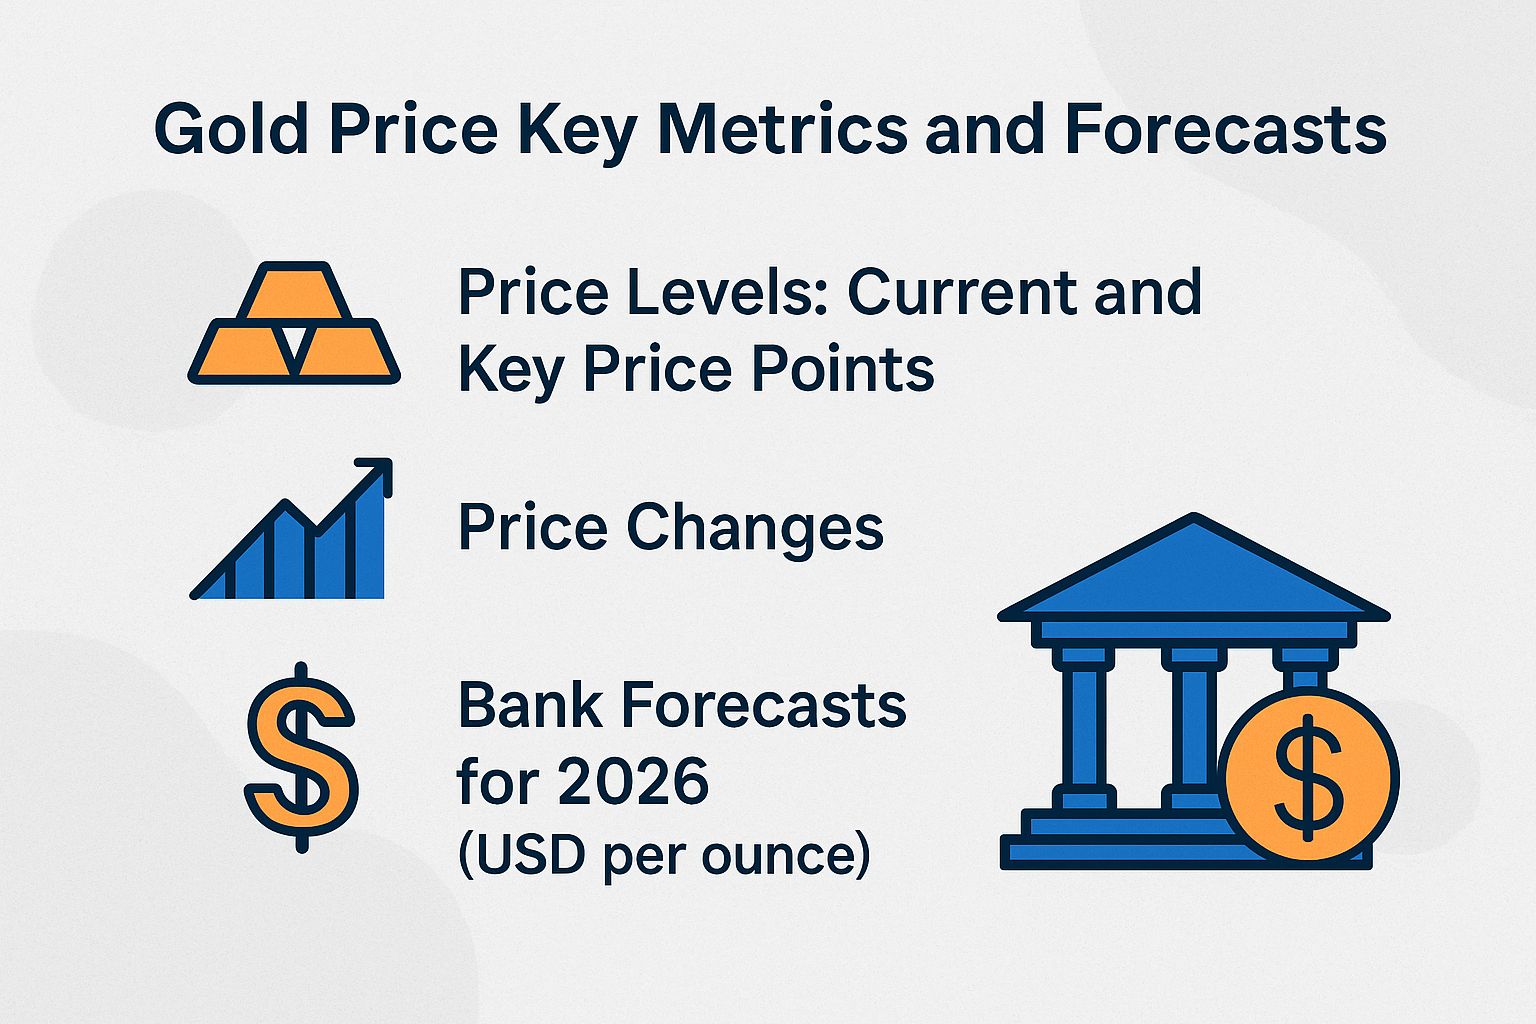
Price Levels: Current and Key Price Points
Price Levels: Price Changes
Price Levels: Bank Forecasts for 2026 (USD per ounce)
(function() { setTimeout(function() { var bars = document.querySelectorAll(‘[class*=”animated-bar-hjsed41c”]’); bars.forEach(function(bar) { var width = bar.getAttribute(‘data-width’); if (width) { bar.style.width = width + ‘%’; } }); }, 100); })();
The Gold Price Key Metrics and Forecasts dataset gives you a clear view of gold’s market spot, past peaks, key signals, latest moves, and expert predictions from big banks.
This info helps investors handle ups and downs in precious metals due to things like rising prices, dollar strength, world events, Fed decisions, and money rules.
Current and Key Price Points: XAU/USD trades at $4050 per ounce (LBMA price). It’s down from the record high of $4381 due to market pullbacks.
Technical tools like RSI (which spots overbought or oversold conditions), MACD (momentum indicator), Bollinger Bands (volatility measure), and Fibonacci retracement show support at $4040 (triangle base) and a key level at $4000. Buying could pick up there to stop drops, as per Stochastic Oscillator (speed of price changes) and Ichimoku Cloud (trend overview).
Upside resistance is at $4150 (triangle top), which might limit quick wins based on Elliott Wave theory (price pattern analysis) and Parabolic SAR (trend reversal signal). The 50-day moving average at $3814 and 200-day at $3399 support longer uptrends, with ADX (strength of trend) confirming bullish direction despite dips.
- Daily Change: Gold dropped 1.75% today.
- From High: It fell 7% from the peak and 6% in one day, showing profit-taking after fast rises.
- Yearly Gain: Still up 50% in 2025, proving gold’s power as a safe spot in shaky times. Grab this chance before more uncertainty hits!
Bank Forecasts for 2026 look bright for gold. Check these exciting targets:
- Morgan Stanley: $4400
- JP Morgan Q4 average: $5055
- HSBC and Bank of America/Standard Chartered: $5000
- Goldman Sachs: $4900
- UBS, Socit Gnrale, Deutsche Bank: $4700
JP Morgan even sees $8000 by 2028, fueled by banks buying gold and shifting from paper money. This upward push is thrilling-act now to ride the wave!
Gold stays tough against quick pressures, with strong supports and big bank predictions for huge gains. Watch $4000 closely for a rebound-excitement builds!
Track COT reports (trader bets), gold ETFs (fund flows), COMEX futures, and Shanghai trades to mix gold smartly into your investments amid market swings.