As central banks like the ECB are cutting interest rates and restarting quantitative easing. This happens amid global economic uncertainty.
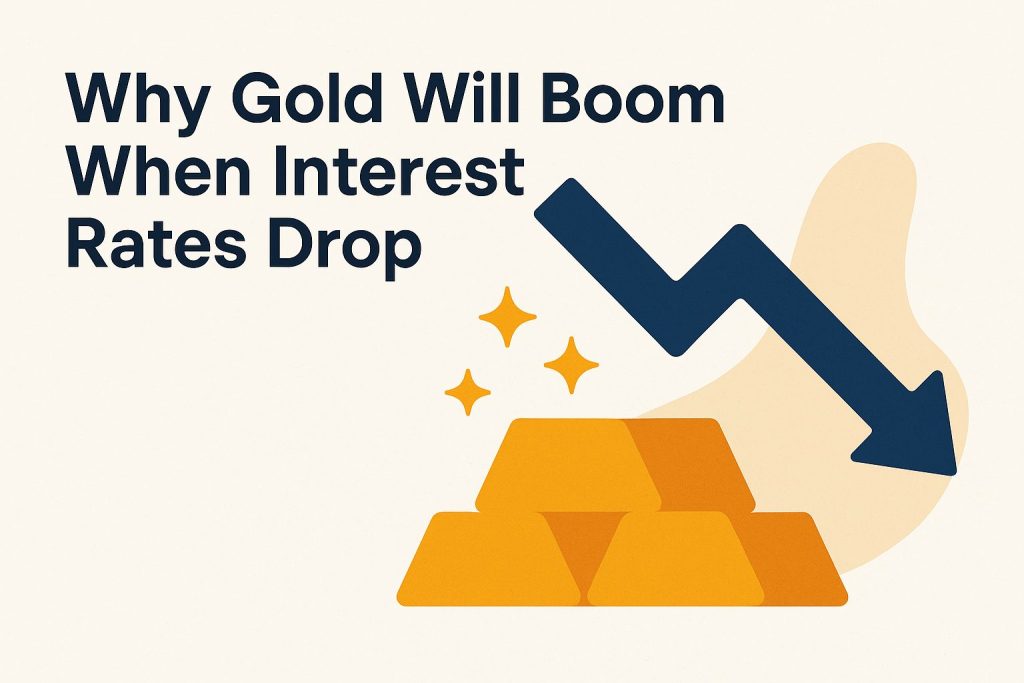
Gold is set for a huge price jump, just like its big rallies in 2008 and after 2020. Get ready for the next boom!
Lower rates make bonds less attractive and spark inflation worries. This boosts gold as a safe haven, with central banks buying more-driving up demand for bullion now!
The Inverse Relationship Between Interest Rates and Gold
Gold prices usually move opposite to interest rates. Data from the World Gold Council shows a strong link, with a correlation score of -0.72 from 1971 to 2023-a score that means when rates drop, gold prices climb.
This link comes from opportunity cost-the money you miss out on by picking one investment over another.
For gold, it means skipping interest from bonds. Lower rates make holding gold cheaper, so more people buy it, pushing prices up fast!
Check this out from Federal Reserve data since 2000: Treasury yields crashed from 6.5% in 2000 to almost 0% after 2008, and gold skyrocketed from $280 to over $1,900 an ounce-history could repeat soon!
In low-rate times, gold shines as an inflation shield for investors. London Bullion Market data shows it averaged 15% yearly returns from 2000 to 2020-don’t miss out!
Watch Federal Reserve announcements closely. When 10-year Treasury yields fall below 2%, act fast to protect your wealth.
Add 5-10% of your portfolio to gold for diversification. Options include:
- Gold ETFs like GLD
- Gold bars or coins
- Gold mining stocks
- Physical bullion in retirement accounts
- Key Drivers: Inflation expectations play a pivotal role; high rates fight inflation, making gold less exciting as a hedge. But geopolitical tensions or downturns can spike demand anyway-stay alert!
- Historical Trends: Data from the 1970s stagflation saw gold soar despite rising rates due to persistent inflation. More recently, the 2022 rate hikes correlated with a 10-15% drop in gold prices, though rebounds occurred with recession fears.
- Investment Implications: Watch rate decisions like a hawk! Dovish shifts spark gold rallies, while hawkish ones mean caution for gold-rich portfolios.
This correlation isn’t absolute. Factors like U.S. dollar strength and currency movements influence it-gold prices inversely track the U.S. dollar, which strengthens with higher rates.
Emerging market demand and central bank purchases add more layers. These factors increase during times of risk aversion and liquidity searches.
For portfolio diversification, grasp this linkage to balance your assets. Gold excels in low-rate, high-uncertainty times like deflation or stagflation, serving as a counter to rate-sensitive investments and hedge fund speculation.
Gold prices closely follow interest rates, showing its sensitivity to monetary policy. Track Fed announcements to predict moves in these volatile markets-don’t miss the next big shift!
Opportunity Cost: Why Lower Rates Favor Gold
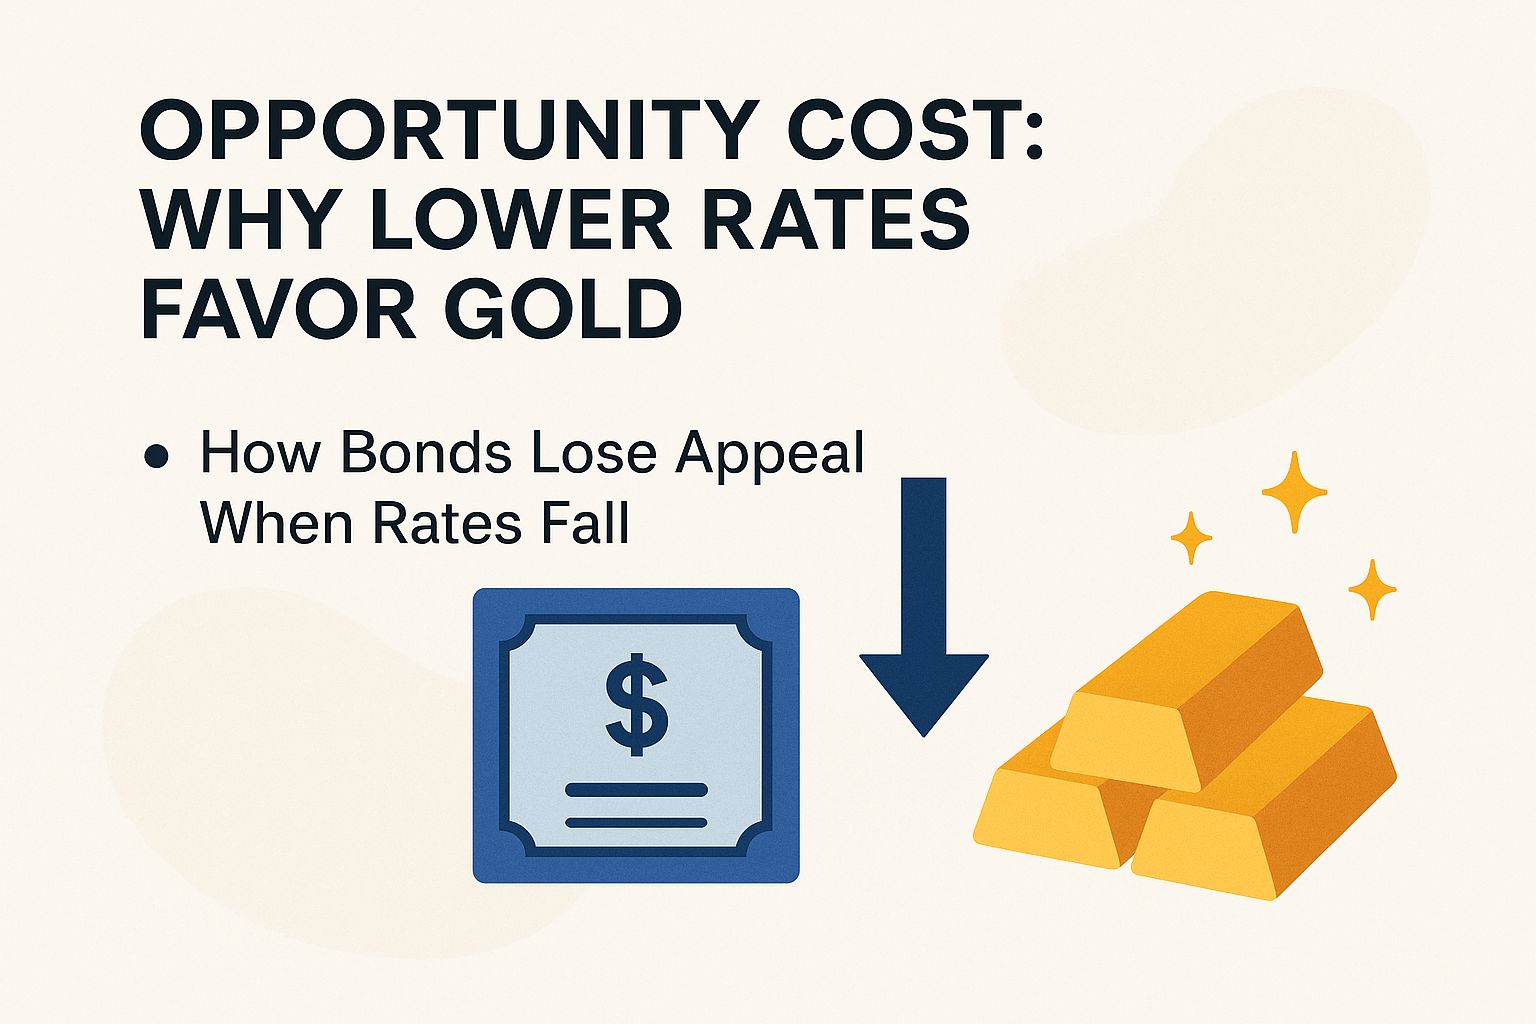
Interest rates dropping to 1% or below cut the opportunity cost of holding gold. This happened during 2020’s stimulus and quantitative easing-gold became more appealing than bonds yielding just 2-3%.
Low liquidity and economic downturns make this shift even clearer. Grab gold now when rates fall low!
How Bonds Lose Appeal When Rates Fall
After the 2008 crisis, U.S. rates fell from 2.5% to 0.25%. This caused a 10-15% drop in real Treasury bond prices due to lower yields, per Bloomberg data.
Investors then turned to gold as a better option. This shift highlights bonds’ risks in low-rate times.
Bond prices move opposite to yields. When yields drop, prices rise-but post-2008 inflation ate up real returns, wiping out gains.
Duration measures a bond’s sensitivity to rate changes. It approximates price shifts: % change -duration x yield change.
For a 10-year bond with 5-year duration, a 1% yield drop boosts price by 5%. That means a $500 gain on $10,000 invested-exciting potential!
In 2022 rate hikes, the Bloomberg Aggregate Bond Index fell 13%. Gold held steady amid uncertainty, says the World Gold Council-proving its resilience!
Watch yield curve inversions on FRED for recession signals. These have driven gold buys over bonds in 2007 and 2019-act fast on these signs!
Yield curve inversion means short-term rates exceed long-term ones, hinting at economic trouble.
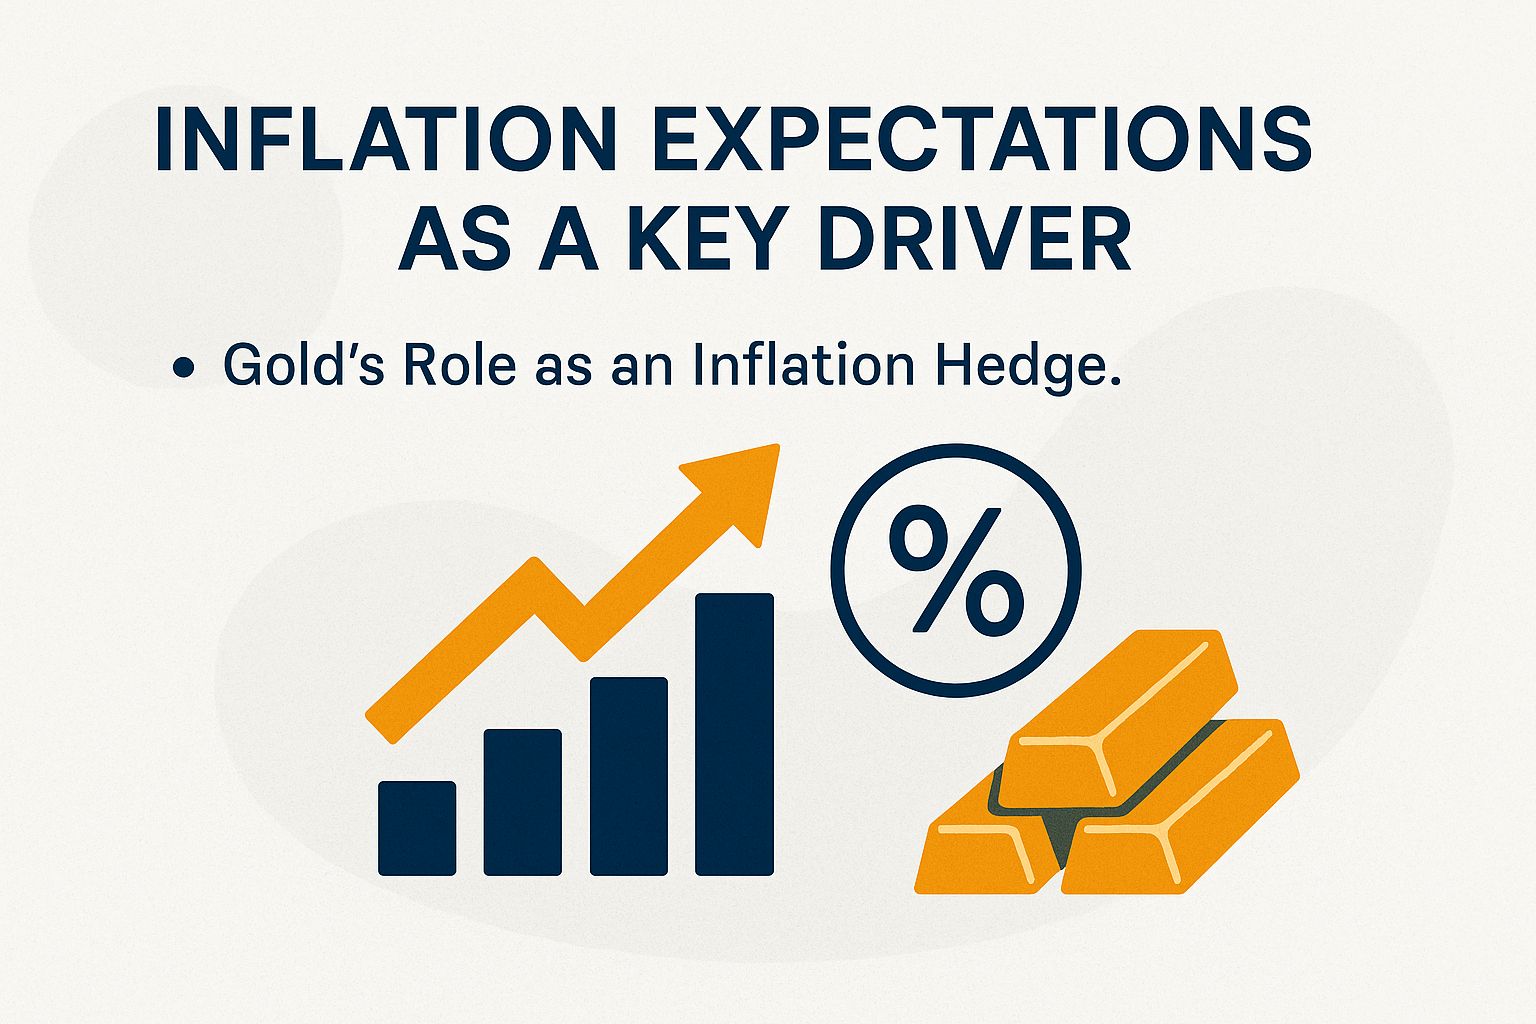
Inflation Expectations as a Key Driver
- Inflation expectations push gold as a top hedge against rising prices.
- Supply and demand matter too-think mining output, jewelry, and industrial uses.
- Investors speculate based on sentiment and the VIX fear index (a measure of market panic).
- Gold ties to history like the gold standard and shines in commodity cycles.
- It guards against devaluation, hyperinflation, stimulus, policy changes, debt, and crises.
- As a store of value, gold preserves wealth in retirement against fiat currency risks.
- Track key indicators: CPI (inflation measure), unemployment, GDP growth, and yield curve inversions.
- Global factors include BRICS economies, emerging markets, China, and India demand.
- Use technical analysis: chart patterns, moving averages, RSI (momentum indicator), volume, support/resistance levels, spot prices in futures like COMEX and London fix.
- Spot a bullish trend early for potential rallies-get in now!
The escalation of inflation expectations, exemplified by the 7% peak in the Consumer Price Index (CPI) in 2022, has propelled gold prices upward by 20% annually, establishing it as a reliable hedge against inflationary pressures. This trend is substantiated by research from the International Monetary Fund (IMF) on precious metals.
Gold’s Role as an Inflation Hedge
In the 1970s, during stagflation (when the economy doesn’t grow but prices keep rising), gold made 35% a year on average. Inflation averaged 7.1%, and it beat stocks by 20 percentage points, according to a Federal Reserve Bank of St. Louis study.
Contemporary investors may draw upon this historical insight by allocating 5 to 10 percent of their portfolio to gold exchange-traded funds (ETFs), such as SPDR Gold Shares (GLD), particularly when the Consumer Price Index (CPI) surpasses 3 percent. This strategy serves as an effective hedge against inflation, mirroring the protective role gold played during the 1970s.
For additional perspective, during the hyperinflationary episodes of the 1980s in emerging markets, including Argentina, gold preserved approximately 80 percent of investors’ wealth, according to a World Bank analysis, substantially surpassing the performance of local currencies.
Gold’s short-term volatility exhibits a correlation with the VIX index (r = 0.45, derived from 20 years of Bloomberg data). To manage this volatility, investors are advised to implement dollar-cost averaging, such as committing $500 monthly to GLD, thereby mitigating price fluctuations and methodically accumulating positions over a 6- to 12-month period.
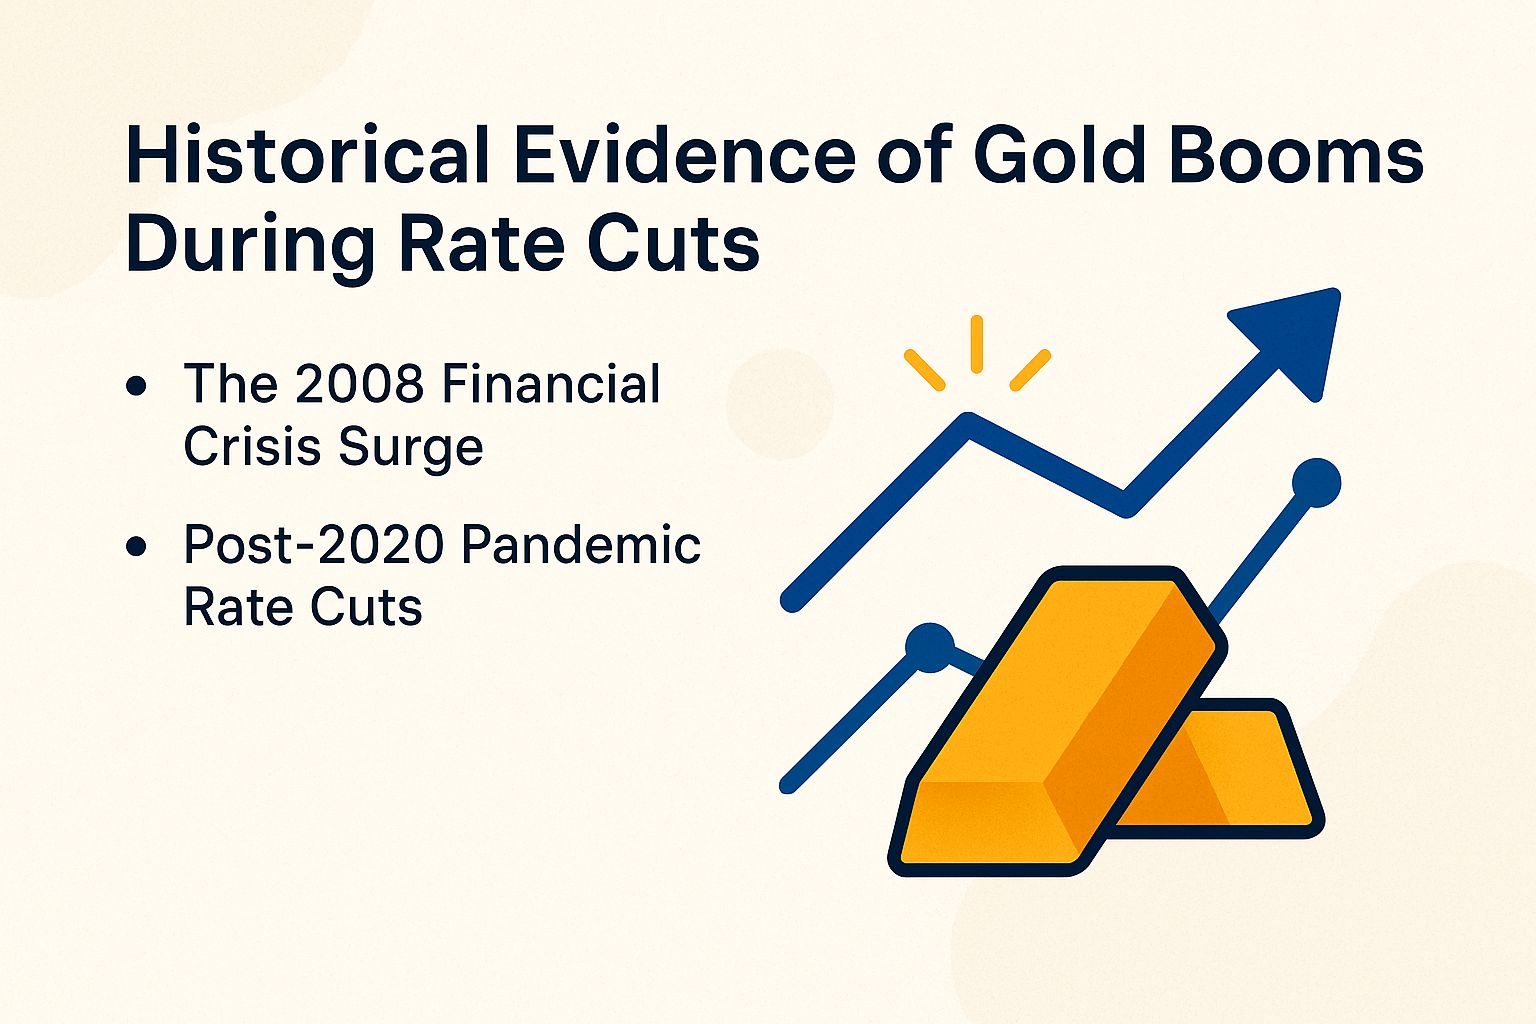
Historical Evidence of Gold Booms During Rate Cuts
Between 2001 and 2011, the Federal Reserve’s reductions in interest rates to near-zero levels precipitated a 600% increase in gold prices, elevating the value from $250 to $1,900 per ounce, as documented in historical charts from the World Gold Council.
The 2008 Financial Crisis Surge
Following the 2008 Lehman Brothers collapse, the Federal Reserve reduced the Fed funds rate to a range of 0-0.25%, leading to declining bond yields, and initiated quantitative easing (QE) measures. As a result, gold prices surged by 150%, rising from $700 to $1,900 per ounce by 2011, according to the London fix records from the London Bullion Market Association (LBMA).
The upward trajectory commenced with the September 2008 financial crash, which prompted a flight to safe-haven assets. Gold prices advanced steadily throughout 2009 and 2010, supported by approximately $4 trillion in economic stimulus and QE programs that contributed to the devaluation of fiat currencies.
Key indicators of this period include inflows of $50 billion into gold exchange-traded funds (ETFs) by 2011, which significantly enhanced demand, as documented by the World Gold Council. A 2011 International Monetary Fund (IMF) paper on safe-haven assets underscores gold’s attractiveness during periods of economic uncertainty, noting its positive correlation with elevated market volatility.
For investors, a well-established approach involves purchasing gold during spikes in the Volatility Index (VIX) exceeding 30, as observed in late 2008 when the VIX reached 80. This strategy has historically enabled the capture of 20-30% price rebounds within several months, while providing portfolio diversification against inflationary pressures.
Post-2020 Pandemic Rate Cuts
Following the Federal Reserve’s interest rate reductions to 0% in March 2020, the price of gold reached $2,075 by August, representing a 40% increase. This appreciation was primarily propelled by the $6 trillion U.S. stimulus package, as documented in Federal Reserve balance sheet data.
The foremost drivers included the expansion of the Federal Reserve’s quantitative easing (QE) program to $3 trillion by mid-2020 and the unemployment rate peaking at 14.8% in April, which intensified concerns over inflation and decelerating GDP growth.
The stimulus initiatives, encompassing the $2.2 trillion CARES Act and subsequent legislative measures, augmented liquidity and amplified demand for safe-haven assets.
A 2021 study from the Brookings Institution emphasized that such fiscal interventions have historically led to commodity price surges of 20-30% during times of economic uncertainty.
For practical investment approaches, monitor M2 money supply expansion through Federal Reserve Economic Data (FRED); year-over-year growth exceeding 10% often foreshadows gold price rallies.
Investing in Gold via ETFs
Want to invest in gold? The GLD ETF tracks gold prices closely with a low 0.40% fee.
Time your entry around Federal Reserve news for the best results.
Currency Weakness and Gold’s Safe-Haven Status
The US dollar dropped 10% against major currencies from 2020 to 2022. Gold prices jumped 25% as the DXY index fell from 103 to 90, per Bloomberg data.
Gold acts as a safe haven during currency weakness.
Gold often rises when the dollar falls. The ECB reports show that for every 1% drop in the USD, gold prices usually climb 0.8%.
This ‘elasticity coefficient’ from data analysis measures how strongly they move together in opposite directions.
Look at the 1990s Asian financial crisis. Gold prices soared 30% as currencies tumbled everywhere.
Protect your money from dollar risks with gold futures on COMEX. Watch for signs like huge US trade deficits.
- The 2022 deficit hit $951 billion, per US Census data.
- Annual deficits top $1 trillion now.
Jump on platforms like CME Group for gold futures starting at 100 ounces. Profit big when the dollar weakens-don’t miss out!
Central Bank Policies Amplifying Demand
Central banks added 1,136 tonnes of gold to reserves in 2022-a 50% jump from the year before, says the World Gold Council. India’s big imports helped drive this.
Low interest rates and $20 trillion in global money printing since 2008 fueled the buying.
The buying sped up in 2023. The Fed kept rates at 5.25% to 5.50% during balance sheet changes.
The ECB stopped raising rates at 4.5% as Eurozone inflation cooled, according to their reports.
China’s central bank bought 1,200 tonnes of gold to steady the yuan and meet rising demand, per customs data.
A BIS survey shows 70% of central banks-even in BRICS nations-are shifting from paper money to gold. This move cuts risks and signals big changes ahead!
Spot bullish gold signals with these steps.
- Check LBMA’s quarterly clearing reports.
- Follow World Gold Council updates.
- Set alerts on TradingView or Bloomberg for buys over 100 tonnes.
Act fast to make smart moves.
Investor Sentiment and Portfolio Shifts
In 2022, amid rate worries, retail gold ETF holdings grew 15% to 3,500 tonnes. Institutions bumped gold to 7% of their portfolios, per Morningstar.
Panicked retail investors rushed to buy gold on apps like Robinhood. AAII surveys in late 2022 showed bullish vibes, with bearish views under 20%.
Big institutions played it smart. They slowly added to BlackRock’s GLD ETF to hedge risks.
Follow Vanguard’s tips from their 2023 whitepaper.
- Add 5-15% gold to your mixed portfolio to cut volatility.
- Pick cheap ETFs like GLD or IAU for smart risk control.
- Avoid too much exposure for steady long-term gains.
Projected Magnitude of the Upcoming Boom
Goldman Sachs sees gold hitting $2,500 by 2025 if rates drop to 3%. History from 1980-2020 shows 20-30% jumps after rate cuts-get ready!
Other experts agree.
- JPMorgan predicts a 25% rise from now.
- UBS aims for $2,300 as inflation eases.
Kitco polls show 60% of analysts are bullish on gold.
Expect gold to climb 15% by the end of the year in steady times. Interest rates are settling down.
A recession could push gold up 40% or more. Investors flock to it as a safe haven when times get tough.
Get excited-gold’s potential is huge!
Jump in now-trade gold before the next big move! Use MetaTrader 4, a popular trading platform, to check prices.
- Look at the 50-day moving average-this shows the average price over the last 50 days to spot trends.
- Check the RSI, or Relative Strength Index, which measures if gold is overbought or oversold.
- Watch for resistance at $2,100, a price level where gold often struggles to rise further.
Start buying (long positions) when prices break above resistance. Set stop-loss at $1,950 to limit losses if things turn volatile-this fits with the Federal Reserve’s plans to cut interest rates.