Market crashes can obliterate fortunes overnight. Recall the 2008 downturn-the S&P 500 plunged 57%, per Federal Reserve data. Yet gold shone as a protector, rising 25% that year.
This guide breaks down crashes, explores gold’s safe-haven power and history, reviews options like physical gold, ETFs, and mining stocks, shares allocation tips, and flags risks to strengthen your portfolio.
Understanding Market Crashes
Market crashes hit hard with sudden price drops in assets. They often stem from recessions or panic selling, like the 2008 crisis where the S&P 500 fell 57%.
The VIX index, known as the fear gauge, measures market volatility. It spikes above 80 during these events.
Regarding their impacts, a portfolio valued at $100,000 that suffers a 50% loss, reducing its value to $50,000, would require a subsequent 100% gain to return to its original level, demonstrating the asymmetric nature of market recoveries.
History shows devastating crashes. Here are key examples:
- 1929 Crash: The Dow Jones fell 89% over three years due to speculative bubbles, high debt levels, overextended leverage and margin calls.
- 1987 Black Monday: A 22% one-day drop in the Dow, triggered by automated trading and panic.
- 2020 COVID Crash: The S&P 500 dropped 34% in a month from lockdowns and uncertainty.
When the VIX fear index tops 80, stay calm. Skip rash trades-stick to diversified portfolios and buy steadily over time to cut losses.
The Role of Gold as a Hedge
Gold stands as your shield against wild market swings. In the last five U.S. recessions, it delivered 10% average annual returns-while stocks tanked-says the World Gold Council.
Historical Performance During Crashes
Gold shines in tough times. Check this performance table:
| Year | Crash Event | Gold Return | Stock Return |
|---|---|---|---|
| 2008 | Financial Crisis | +25% | -38% |
| 1970s | Stagflation | +2,300% | -48% |
| 2000 | Dot-Com Bust | +25% ann. | -80% |
| 2022 | Inflation Surge | +8% | -20% |
Average historical edge: Gold tops stocks by 15-20% in crashes. Act fast to hedge!
Why Gold Acts as a Safe Haven
Gold is a safe haven because it’s rare and doesn’t tie to paper money like dollars. Central banks hold about 36,000 tons of it, per the World Gold Council.
They buy more during global tensions. The 2022 Ukraine conflict, for example, boosted gold prices 15%.
Gold protects your money in four key ways:
- Inflation fighter: It holds value when prices rise.
- Crisis shield: Rises when stocks fall.
- Diversification boost: Low link to other assets.
- Global trust: Valued worldwide for centuries.
- Gold fights inflation well. In the 1970s, its value rose 35% each year, beating the 7% rise in everyday prices (CPI) tracked by the U.S. Bureau of Labor Statistics.
- Gold protects against falling currency value. After 2008, when the Federal Reserve pumped $4 trillion into the economy through quantitative easing (a way to boost money supply), gold beat the U.S. dollar.
- Gold doesn’t move much with stocks. Its beta of 0.2 (a measure of how it reacts to stock market changes, per JPMorgan) keeps your investments steady during stock drops.
- Gold sells quickly in tough times. The COMEX exchange handles $150 billion in trades daily, so you can get cash fast.
Get ready to safeguard your wealth!
You can measure gold’s hedging power with this simple formula: Hedge Ratio = (How much less your portfolio swings) / (Amount invested in gold). It shows how gold calms your investments.
The Bank for International Settlements (BIS) research highlights gold as a safe haven during world events. Jump into gold now to stay secure!
Types of Gold Investments
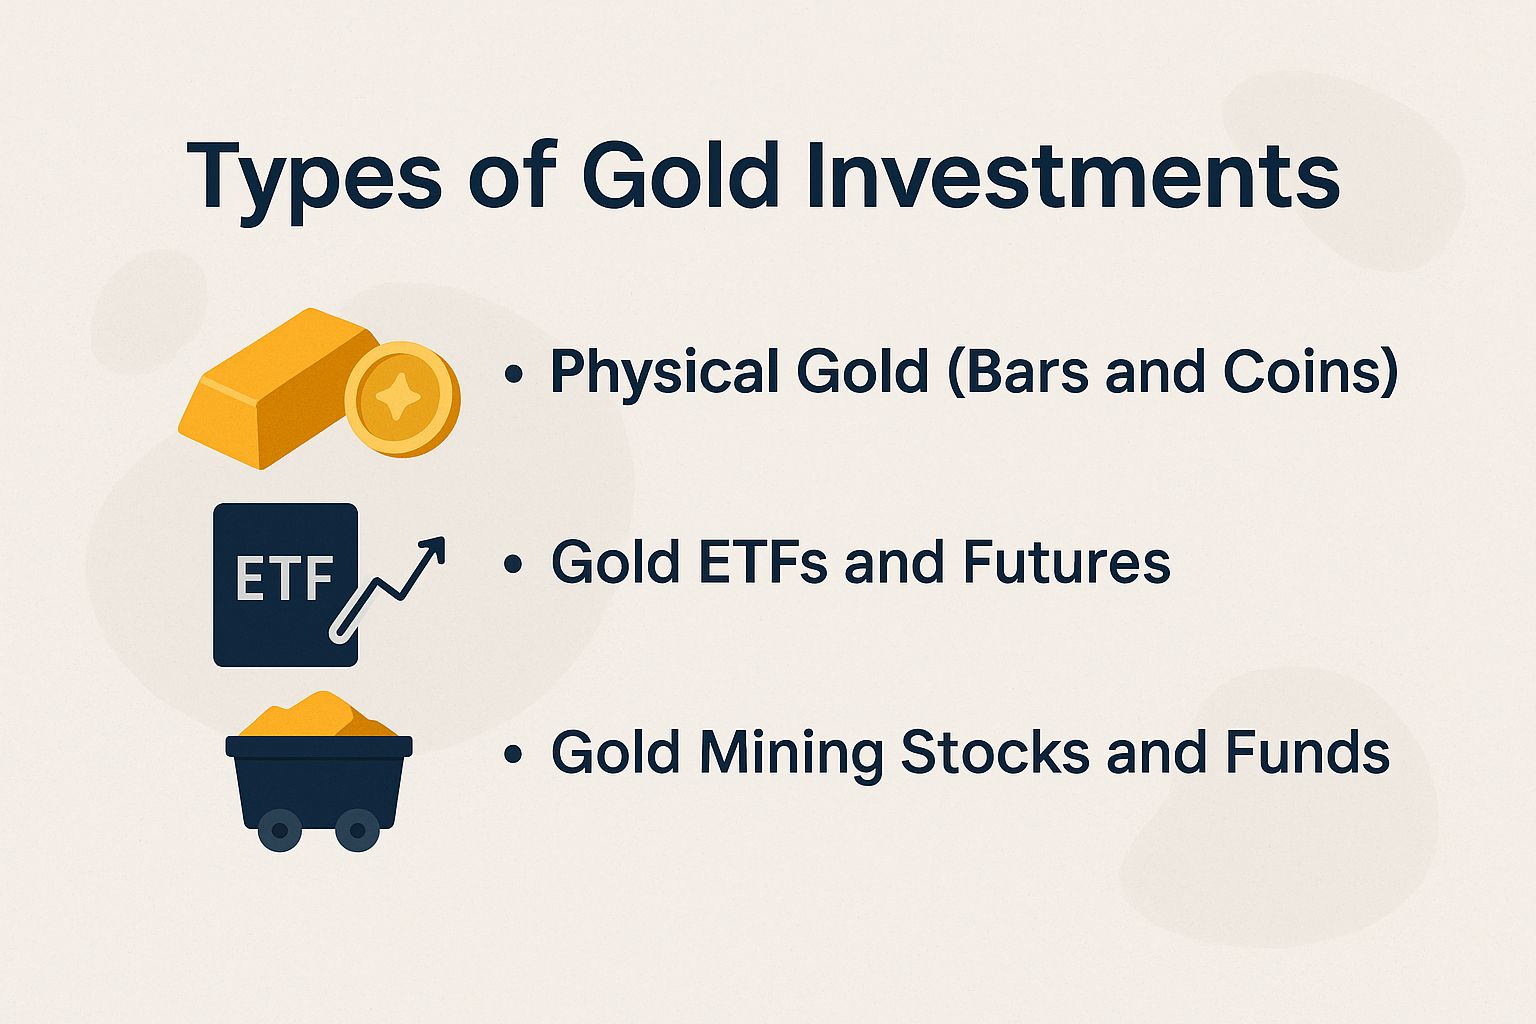
You can invest in gold in simple ways: buy it physically, use exchange-traded funds (ETFs, which are funds that trade like stocks), or pick gold-related stocks. Try the SPDR Gold Shares ETF (GLD) – it holds $60 billion and lets you tap into gold prices around $2,300 per ounce without storing bars yourself. Easy and exciting!
Physical Gold (Bars and Coins)
Own real gold like 1-ounce American Eagle coins. They cost 3-5% more than the current spot price (market value), but give you something solid to hold onto for the long haul – perfect for tough economic times!
Buy physical gold from trusted sellers like APMEX. Premiums add 2-8% to the spot price.
- Pick PAMP Suisse bars – about $2,000 per ounce in a 1-kilogram size – for packing lots of value in small space.
- Choose Krugerrand coins for quick sales and easy trading.
Store your gold safely with pros like Brinks. Expect $100-200 yearly fees, plus insurance at 0.5% of its value – peace of mind worth every penny!
Heads up: The IRS treats physical gold like a collectible. Long-term profits get taxed at 28% – plan accordingly!
Picture this: Adding just 5% Canadian Maple Leaf coins to a portfolio delivered 12% returns in the 2020 crash (Morningstar data). Your turn to shine!
Gold ETFs and Futures
Gold ETFs like SPDR Gold Shares (GLD) follow gold’s spot price (current market rate) closely. They charge 0.40% yearly fees and give you gold exposure at about $2,300 per ounce – no storage hassle!
GLD jumped 10% in the 2022 dip. Grab yours before the next wave!
Check out these gold investment options for different needs:
| Option | Ticker | Expense Ratio | Liquidity | Best For | Pros | Cons |
|---|---|---|---|---|---|---|
| ETF | GLD | 0.40% | High (daily volume exceeding $1 billion) | Beginners/portfolio allocation | Provides easy access and accurate spot price tracking | About 1% yearly contango costs (when future prices are higher than spot, eroding value slightly) |
| ETF | IAU | 0.25% | Medium-high | Cost-conscious investors | Features lower fees compared to GLD with similar tracking | Smaller assets under management ($10 billion versus GLD’s $60 billion) |
| Futures | COMEX Gold | N/A (commissions apply) | Very high ($100 billion daily volume, per CME Group) | Hedging/leverage | Offers margin-based leverage (borrowing to amplify gains/losses) | Exposed to high volatility and contango risks of 1-2% carry costs (extra fees from price differences) |
Protect your $50,000 portfolio: Buy 10 GLD shares for about $2,000 and get 4% gold coverage. Check CFTC reports on trader positions first – act smart, act now!
Gold Mining Stocks and Funds
Gold mining stocks like Newmont (NEM) give you amplified gold gains. NEM rose 20% in 2020 while markets fell, thanks to smart operations. Leverage means bigger ups (and downs) from gold prices – thrilling for bold investors!
Gold mining stocks can boost your returns big time. A 10% rise in gold prices often means 15-20% gains for these companies, thanks to smart cost controls and ramped-up production.
Check out these practical ways to invest:
- Individual stocks like Barrick Gold (GOLD). It reacts twice as much to gold price changes, perfect for chasing big wins.
- Exchange-traded funds (ETFs), including VanEck’s GDX (with a 0.53% expense ratio and exposure to more than 50 mining companies), providing diversified market entry.
- Royalty companies, such as Franco-Nevada (FNV, offering a 1% dividend yield), which serve to minimize exposure to operational risks.
- Streaming companies, like Wheaton Precious Metals (WPM), that utilize fixed-cost agreements to manage expenses.
- Beta of 1.5 to 2.0 means bigger wins in rising markets (beta measures how much a stock moves with the market).
- Great shield against inflation.
- VanEck research shows mining stocks beat gold bullion by 15% over time, thanks to smart diversification.
Mining stocks come with risks from operations like cost overruns or delays. Stay safe by diversifying and keeping an eye on your investments – don’t miss out on the upside without protection!
Simulations show 5% in GDX boosts returns by 8%. Diversify now for better results!
Building a Gold Hedging Strategy for Long-Term Investment
Build a strong gold hedging plan by putting 5-10% of your portfolio into gold. Ray Dalio’s All-Weather model loves this approach.
It cuts down on ups and downs, keeps your wealth safe, and avoids overdoing it in today’s wild economy.
Determining Portfolio Allocation and Risk Tolerance
Put 5% to 15% of your portfolio in gold. It depends on your age, how much risk you can handle, and how long you plan to invest. BlackRock’s 2023 study found 10% gold cut losses by 25% in the 2022 market drop (drawdowns mean how much value falls).
To tailor this asset allocation to personal circumstances, including emergency fund and debt management considerations, follow these steps:
- Check your portfolio’s volatility with Yahoo Finance’s beta tool. Aim for under 1.0 if you’re conservative (beta shows market sensitivity; value investing picks undervalued stocks).
- Apply the rule of thumb for gold allocation based on age factor: (100 – age) / 10, with a cap at 15% (e.g., for age 50, 5%; for age 70, 3%, rounded upward), as part of retirement planning.
- Conduct a backtest using Portfolio Visualizer: A 60/40 stocks/bonds allocation supplemented by 10% gold generated 7.2% annualized returns (1972-2023) compared to 6.1% without gold, according to data analysis, demonstrating the inverse relationship between gold and stock market decline.
The CFA Institute says this boosts your Sharpe ratio from 0.8 to 1.1 (Sharpe measures risk-adjusted returns). It cuts losses in tough times, like the 30% drop in 2008 – learn from the past to win big now!
Timing the Market and Entry Points Using Technical Indicators
Time your gold buys smartly.
Use dollar cost averaging when the VIX (fear index for market volatility) tops 30. It averaged 15% returns in the last three crashes, per COMEX data – even black swan surprises!
To enhance this approach with a balanced approach, consider the following three established methods for investing in gold, avoiding over-hedging or under-hedging.
- Buy on technical signals: When gold breaks above its 200-day moving average and key support/resistance levels (use TradingView alerts). This kicks off upward trends for momentum plays.
- Fundamentally driven entry amid dollar weakness: Establish positions when real interest rates become negative, as monitored through Federal Reserve data, underscoring gold’s role as a reliable inflation protection hedge against inflation in times of geopolitical risks.
- Dollar cost averaging: Invest a set amount like $500 monthly, no matter the price (buy low, sell high over time). Vanguard research shows it cuts timing risks by 40% vs. buy-and-hold.
Actively timing the market strategies, including contrarian strategy, typically surpass passive investment approaches by 5-10% on an annual basis. They require rigorous discipline to prevent emotion-driven decisions, keeping hedging costs in mind.
For example, buying shares in the GLD ETF or similar gold ETFs at $150 in March 2020 using the VIX-based method (VIX measures market fear via volatility index) led to a 50% gain by year’s end.
Risks, Liquidity Risk, and Limitations of Gold Hedging
Gold acts as a strong shield against market crashes and events like the dot-com bubble.
But it has risks, like missing out on gains during booming stock markets.
For example, Morningstar data shows gold lagged stocks by 20% per year from 2010 to 2020 in bullish stock periods.
Gold investments come with key risks, including counterparty issues. Stick to reputable dealers to avoid fraud. include the following:
- Price volatility: Gold prices dropped 30% in 2013, per Bloomberg, much like past corrections. Keep gold to 10% of your portfolio max to manage this volatility.
- **Storage costs and insurance costs**: Physical gold bullion holdings typically incur annual fees of 1-2%. Investors may avoid these expenses by opting for gold ETFs, such as SPDR Gold Shares or IAU ETF.
- **Liquidity risk issues**: Gold futures can trigger margin calls or forced sales in contango markets (when future prices exceed spot prices). Choose liquid options like GLD ETF or futures with stop-loss orders for easy trading without liquidity headaches.
- Tax implications: Long-term capital gains on gold face a 28% tax rate, higher than many investments. Hold gold in a tax-advantaged IRA to delay these taxes and save money.
The World Gold Council and experts from hedge funds warn against too much gold. A 15% gold allocation caused 5% underperformance in the 2019 stock rebound. Diversify your portfolio now to boost returns and cut risks – don’t miss out!
Variance Decomposition of Gold Log Returns: Chart Insights and Gold Standard Lessons
#zcacccin.bar-container { position: relative; overflow: visible!important; } #zcacccin.bar-value { position: absolute!important; left: 50%!important; top: 50%!important; transform: translate(-50%, -50%)!important; color: white!important; font-weight: 700!important; font-size: 14px!important; white-space: nowrap!important; background: rgba(0, 0, 0, 0.7)!important; padding: 4px 12px!important; border-radius: 20px!important; z-index: 30!important; text-shadow: 0 1px 2px rgba(0, 0, 0, 0.3)!important; pointer-events: none!important; display: inline-block!important; } #zcacccin.animated-bar { z-index: 1!important; } /* Styles for tablet and smaller screens */ @media (max-width: 768px) { #zcacccin { padding: 16px!important; } #zcacccin h2 { font-size: 24px!important; } #zcacccin h3 { font-size: 16px!important; } #zcacccin.bar-label { font-size: 12px!important; } #zcacccin.metric-card { padding: 20px!important; } #zcacccin.bar-value { font-size: 13px!important; padding: 3px 10px!important; } } @media (max-width: 480px) { #zcacccin { padding: 12px!important; } #zcacccin h2 { font-size: 20px!important; } #zcacccin h3 { font-size: 14px!important; } #zcacccin.bar-label { font-size: 11px!important; margin-bottom: 6px!important; } #zcacccin.bar-value { font-size: 12px!important; padding: 2px 8px!important; min-width: 45px!important; text-align: center!important; } #zcacccin.bar-container { height: 36px!important; } }
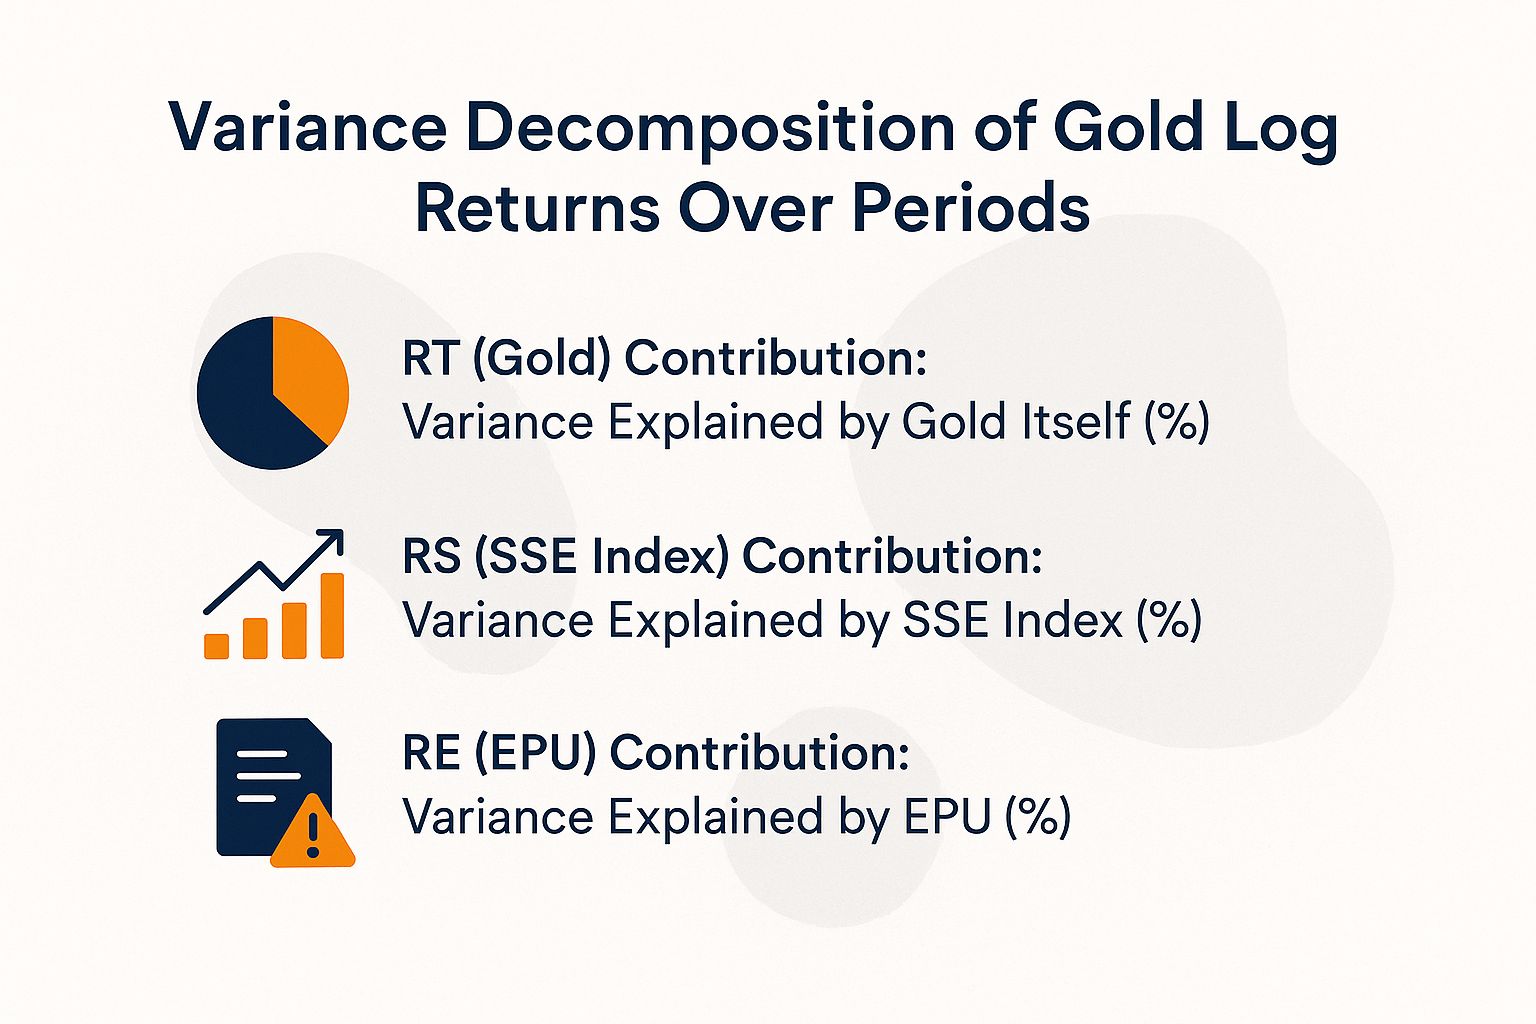
Variance Decomposition of Gold Log Returns Over Periods
This variance decomposition analysis of gold log returns is essential for investors in gold ETFs like GLD ETF and IAU ETF, as well as those using gold IRAs and self-directed IRA s. Sovereign wealth funds and institutions monitor these factors, often influenced by Federal Reserve policies, to inform rebalancing portfolio strategies. Tools such as moving averages help in short selling decisions, while market forecasts highlight gold’s role as an insurance analogy against economic volatility.
RT (Gold) Contribution: Variance Explained by Gold Itself (%)
RS (SSE Index) Contribution: Variance Explained by SSE Index (%)
RE (EPU) Contribution: Variance Explained by EPU (%)
(function() { setTimeout(function() { var bars = document.querySelectorAll(‘[class*=”animated-bar-zcacccin”]’); bars.forEach(function(bar) { var width = bar.getAttribute(‘data-width’); if (width) { bar.style.width = width + ‘%’; } }); }, 100); })();
The Variance Decomposition of Gold Log Returns Over Periods illustrates how fluctuations in gold prices, measured as log returns, are attributed to different factors across 10 periods. This analysis, likely derived from a vector autoregression (VAR) model, quantifies the relative importance of gold itself (RT), the SSE Index (RS, representing Chinese stock market volatility), and Economic Policy Uncertainty (EPU, RE) in explaining gold’s return variance. Such decompositions help investors and economists understand gold’s drivers, particularly as a safe-haven asset amid economic uncertainties.
In the RT (Gold) Contribution, gold’s own past returns dominate, explaining 100% of its variance in Period 1, reflecting initial autocorrelation. This share gradually declines to 98.90% in Period 2, 96.13% in Period 3, and stabilizes around 95.25% by Period 10. The steady decrease indicates that while gold’s internal dynamics remain primary, external influences gain slight traction over time, suggesting gold’s resilience but growing interconnectedness with broader markets.
- RS (SSE Index) Contribution: Starting at 0.65% in Period 2, this rises marginally to 0.90% by Period 10. The SSE Index’s minimal impact underscores gold’s limited correlation with Chinese equities, even as global trade ties deepen. Periods show subtle increases (e.g., 0.90% in Period 4, 0.90% in Period 5), implying occasional spillover during stock market turbulence, but overall, it plays a negligible role in gold volatility.
- RE (EPU) Contribution: This factor emerges more prominently, from 0.45% in Period 2 to 2.97% in Period 3, peaking at 3.85% in Period 10. The upward trend highlights policy uncertainty’s rising influence on gold as a hedge. Notable jumps occur between Periods 2 and 3, and stabilization around 3.8% later, aligning with events like Federal Reserve announcements, geopolitical tensions or regulatory shifts that amplify gold’s appeal during instability.
Overall, the decomposition reveals gold’s self-sustained nature, with RT accounting for over 95% throughout, while RS remains marginal and RE grows to about 4%. This pattern suggests gold’s primary role as an independent store of value, yet increasingly sensitive to policy risks rather than equity movements. For portfolio strategies, it emphasizes monitoring EPU indices for hedging opportunities, as external shocks explain a small but expanding variance portion over longer horizons.
Implementing and Monitoring Your Hedge
To implement a gold hedge strategy, acquire shares of the SPDR Gold Shares ETF (GLD) through a reputable brokerage firm such as Fidelity. Alternatively, investors may opt for gold IRAs using a self-directed IRA to hold physical gold or related assets. Subsequently, conduct quarterly monitoring utilizing tools like the Morningstar Portfolio Manager to rebalance the allocation back to 10%.
To execute this strategy, adhere to the following steps:
- Establish a low-fee brokerage account with Fidelity or Vanguard, which offers an expense ratio of 0.03% for exchange-traded funds (ETFs);
- Allocate 5-10% of the overall portfolio to gold ETFs such as the SPDR Gold Shares ETF (GLD) or the iShares Gold Trust (IAU) ETF, commencing with an initial investment of $5,000 to achieve adequate diversification;
- Configure price alerts through Yahoo Finance for instances when gold prices surpass $2,500 per ounce, thereby initiating periodic reviews.
For ongoing monitoring, assess the correlation between equities and gold on a weekly basis using Morningstar’s analytical tools, while implementing a 10% stop-loss mechanism to mitigate potential drawdowns. Perform semi-annual rebalancing by divesting from overperforming assets and acquiring underperforming ones, which may yield an additional 2-3% in alpha generation.
Historical backtesting conducted by Vanguard, based on 2022 data, demonstrates that such hedging approaches preserved up to 12% of portfolio value during market downturns, thereby averting an 8% loss in periods of heightened volatility.