Inflation keeps coming back, and markets swing wildly. Time to decide: stick with hot stocks or grab the steady shine of precious metals?
Gold and silver act as safe spots in tough times. Meanwhile, the S&P 500 and Nasdaq wow us with tech booms.
We look at data from 2010-2024 and tips from experts like Goldman Sachs. Find out the economic forces, risks, and what 2025 might bring – who will win?
Overview of Precious Metals

Precious metals like gold and silver hold their value over time. In late 2024, gold costs $2,650 per ounce and silver $31 per ounce, according to Kitco Metals – perfect for shaky economies.
Key Types: Gold and Silver
- Gold: Produced at 3,000 tonnes yearly (USGS 2024). It shines as a safe-haven when times get tough.
- Silver: Used in jewelry (50% of demand) and industries like electronics and solar panels. This boosts its total market value to $1.2 trillion.
Gold stays steady in uncertain times. It jumped +400% from 2000 to 2011 as the Federal Reserve pumped money into the economy.
Silver swings more – its beta of 1.5 means it’s 1.5 times as volatile as the S&P 500. But rising factory needs could spark big growth!
Easy ways to invest:
- Buy physical gold bars from trusted sellers like APMEX for hands-on ownership.
- Choose ETFs: GLD for gold (0.40% fee, easy to trade) or SLV for silver (tracks prices, 0.50% fee).
Gold pays no dividends. Yet, its average yearly growth (CAGR) hits 7-10% over time, beating silver’s ups and downs.
| Type | Avg Annual Return (2010-2024) | Key Driver | Example Investment |
|---|---|---|---|
| Gold | 5.2% | Safe-haven demand | GLD ETF |
| Silver | 3.8% | Industrial use | SLV ETF |
Stock Market Fundamentals
The stock market lists over 4,000 companies on big U.S. exchanges, worth $50 trillion total (NYSE 2024). Dive into shares of tech giants on the NASDAQ for real growth thrills!
Major Indices: S&P 500 and Nasdaq
The S&P 500 follows 500 top U.S. companies. It averaged 10.2% yearly returns from 2010-2024 (Yahoo Finance).
The tech-focused NASDAQ beat it at 15.8%, thanks to stars like Apple and Nvidia. Get ready for even more excitement in 2025!
The S&P 500 covers 11 sectors; finance makes up 13%. Its beta of 1.0 shows steady moves matching the market.
Jump in with the SPY ETF – about $500 per share and just 0.09% fees for easy access.
The NASDAQ targets growth stocks like FAANG (Facebook, Apple, Amazon, Netflix, Google). Its average yearly growth hit 20% in the last 10 years.
Watch out – it’s volatile, with the VIX fear index at 20 in 2024.
Mix it up: Put 60% in stable S&P 500 ETFs and 40% in NASDAQ ones like QQQ for big wins!
| Index | 10-Year Return | Volatility (Std Dev) | Top Holdings Example |
|---|---|---|---|
| S&P 500 | 10.2% | 15% | Apple, Microsoft |
| NASDAQ | 15.8% | 25% | Apple, Nvidia |
Historical Performance: Metals vs. Stocks – Who Wins?
From 2010 to 2024, S&P 500 stocks grew at an average of 12.5% per year. This rate, known as the compounded annual growth rate or CAGR, beat gold's 5.2% return in strong markets.
Precious metals proved their worth in tough times. They surged an impressive 25% during the 2020 market crash (Bloomberg data).
Precious Metals vs. Global Stocks: Annual Returns (2016-2025 YTD)
#m1f9lfur.bar-container { position: relative; overflow: visible!important; } #m1f9lfur.bar-value { position: absolute!important; left: 50%!important; top: 50%!important; transform: translate(-50%, -50%)!important; color: white!important; font-weight: 700!important; font-size: 14px!important; white-space: nowrap!important; background: rgba(0, 0, 0, 0.7)!important; padding: 4px 12px!important; border-radius: 20px!important; z-index: 30!important; text-shadow: 0 1px 2px rgba(0, 0, 0, 0.3)!important; pointer-events: none!important; display: inline-block!important; } #m1f9lfur.animated-bar { z-index: 1!important; } @media (max-width: 768px) { #m1f9lfur { padding: 16px!important; } #m1f9lfur h2 { font-size: 24px!important; } #m1f9lfur h3 { font-size: 16px!important; } #m1f9lfur.bar-label { font-size: 12px!important; } #m1f9lfur.metric-card { padding: 20px!important; } #m1f9lfur.bar-value { font-size: 13px!important; padding: 3px 10px!important; } } @media (max-width: 480px) { #m1f9lfur { padding: 12px!important; } #m1f9lfur h2 { font-size: 20px!important; } #m1f9lfur h3 { font-size: 14px!important; } #m1f9lfur.bar-label { font-size: 11px!important; margin-bottom: 6px!important; } #m1f9lfur.bar-value { font-size: 12px!important; padding: 2px 8px!important; min-width: 45px!important; text-align: center!important; } #m1f9lfur.bar-container { height: 36px!important; overflow: visible!important; } }
Precious Metals vs Global Stocks Annual Returns (2016-2025 YTD)
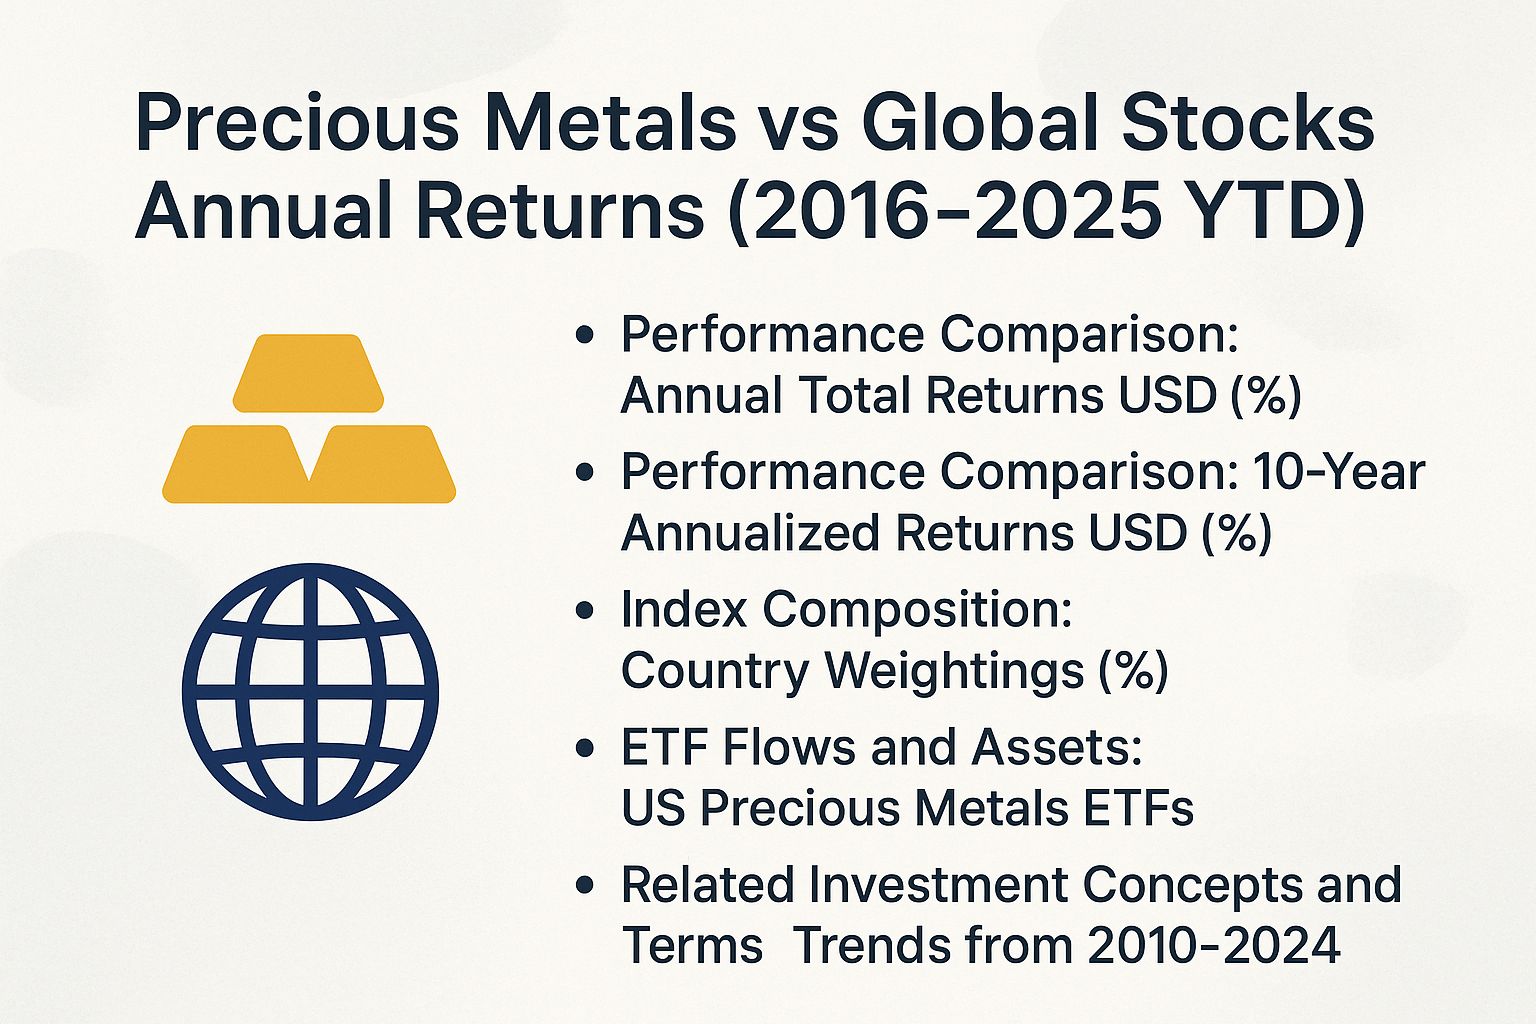
Performance Comparison: Annual Total Returns USD (%)
Performance Comparison: 10-Year Annualized Returns USD (%)
Index Composition: Country Weightings (%)
ETF Flows and Assets: US Precious Metals ETFs
Related Investment Concepts and Terms
platinum, palladium, rhodium, equities, S&P 500, Dow Jones, NASDAQ, interest rates, recession, economic outlook, portfolio diversification, safe haven, hedge against inflation, commodity prices, market volatility, bear market, central bank policies, Federal Reserve, geopolitical tensions, supply chain, mining industry, mutual funds, trading, speculation, long-term investment, short-term gains, risk management, asset allocation, financial forecast, analyst predictions, correlation, alpha, Sharpe ratio, technical analysis, fundamental analysis, macroeconomic factors, currency fluctuations, dollar strength, emerging markets, developed markets, sector performance, technology stocks, value stocks, dividend stocks, blue-chip stocks, penny stocks, commodity trading, metals ETF, stock index, investment returns, economic recovery, fiscal policy, monetary policy, global economy, market trends, investor sentiment, capital gains, tax implications, brokerage fees, volatility index, VIX, gold standard, silver mining, platinum group metals, jewelry demand, electronics industry, automotive sector, renewable energy, supply disruption, demand forecast, price prediction, bullish outlook, bearish scenario, diversification strategy, balanced portfolio, high-risk assets, low-risk investments, inflation rate, GDP growth, unemployment rate, consumer spending, corporate earnings, earnings season, P/E ratio, small-cap stocks, mid-cap stocks, large-cap stocks, international stocks, bond market, fixed income, alternative investments, real estate, cryptocurrencies, hedge funds, pension funds, retirement planning, wealth management, financial advisor, investment strategy, market cycle, boom and bust, correction phase, rally phase, peak performance, trough recovery, sustainable investing, ESG factors, environmental impact, social responsibility, governance standards, regulatory changes, trade wars, sanctions impact, energy prices, oil market, natural resources, raw materials, futures contracts, options trading, margin trading, stop-loss orders, buy and hold, day trading, swing trading, value investing, momentum investing, contrarian approach, technical indicators, moving averages, RSI, MACD, support levels, resistance levels, candlestick patterns, chart analysis, news events, earnings reports, merger activity, IPO market, venture capital, private equity, public markets, overvaluation, undervaluation, bubble risk, crash prediction, recovery timeline, 2025 projections, year-end targets, quarterly reports, compounded growth, inflation-adjusted returns, real returns, nominal returns, risk premium, expected return, standard deviation, portfolio beta, diversification benefits, correlation matrix, asset rebalancing, tactical allocation, strategic allocation, passive investing, active management, index funds, smart beta, factor investing, quality factor, momentum factor, size factor, value factor, low volatility factor, commodity supercycle, metals boom, stock rally, equity premium, metals premium, backtesting, simulation models, Monte Carlo simulation, scenario analysis, stress testing, black swan events, tail risks, opportunity cost, sunk cost, behavioral finance, herd mentality, fear and greed, market psychology, contrarian signals, leading indicators, lagging indicators, coincident indicators, economic calendar, FOMC meetings, rate hikes, rate cuts, taper tantrum, debt ceiling, government spending, budget deficit, sovereign debt, credit rating, junk bonds, investment grade, yield curve, inverted yield curve, steepening curve, flat curve, term premium, duration risk, convexity, immunization strategy, laddering, barbell strategy, satellite allocation, core satellite, absolute return, relative return, benchmark comparison, peer performance, alpha generation, skill-based investing, luck vs skill, survivorship bias, selection bias, data mining, overfitting, out-of-sample testing, robust models, econometric models, VAR models, cointegration, Granger causality, impulse response, forecasting accuracy, confidence intervals, point estimates, probabilistic outcomes, binary outcomes, outperform probability, underperform risk, breakeven analysis, sensitivity analysis, Monte Carlo paths, random walks, efficient market hypothesis, behavioral anomalies, arbitrage opportunities, market inefficiencies, liquidity premium, illiquidity discount, transaction costs, bid-ask spread, slippage, market impact, order flow, dark pools, HFT impact, algorithmic trading, quant funds, systematic strategies, discretionary trading, fundamental drivers, valuation metrics, DCF models, comparable analysis, precedent transactions, sum-of-parts, NAV calculation, book value, intrinsic value, market value, replacement cost, liquidation value
(function() { setTimeout(function() { var bars = document.querySelectorAll(‘[class*=”animated-bar-m1f9lfur”]’); bars.forEach(function(bar) { var width = bar.getAttribute(‘data-width’); if (width) { bar.style.width = width + ‘%’; } }); }, 100); })();
The Precious Metals vs Global Stocks Annual Returns (2016-2025 YTD) dataset compares investment performance between precious metals and global all-cap stocks. It shows how precious metals outperform during economic uncertainty, inflation, and market volatility-think of the VIX as a fear gauge for stocks.
Precious metals act as safe-haven assets. They deliver higher long-term returns but swing more year to year than steady, growth-focused global stocks.
The Performance Comparison tracks annual total returns in USD. Check out these exciting trends!
- 2016: Precious metals rocketed 58.2% vs. global stocks’ 8.98%. Post-crisis recovery boosted gold demand.
- 2019: Metals surged 48.13% against 27.09%. Trade tensions fueled the gains.
- 2020: Amid the pandemic, metals hit 27.22% vs. stocks’ 16.76%. Investors grabbed them as a safety net.
- 2022: Metals dropped –12.23% vs. stocks’ –17.87%. Rising rates hurt both, but stocks suffered more.
- 2018: Similar losses at –9.6% vs. –9.62%. Interest rate hikes were the culprit.
- 2021: Stocks led with 18.54% vs. metals’ –5.65%. Tech booms drove the rally.
- 2023: Stocks soared 22.19% vs. 3.31%. Economic rebounds powered them.
- 2017: Stocks won at 24.38% vs. 10.57%. More growth vibes.
- 2025 YTD: Wow-metals at 85.72% vs. stocks’ 14.75%! Geopolitical scares and inflation fears are pushing metals higher-don’t miss this surge!
Over 10 years, metals average 17.4% annually vs. stocks’ 11.4%. Add them to diversify your portfolio now!
- Index Composition: Precious metals focus heavily on certain countries. Canada leads at 48.7%, followed by the US at 17.0%, South Africa at 15.0%, and Australia at 9.0%. This setup links returns to mining in these resource hotspots, but watch for risks like new rules in those areas.
- ETF Flows and Assets: The US metals ETF holds $35.0 billion in assets-NAV is just the daily value per share. In H1 2025, -$2.3 billion flowed out due to caution at peak prices. But H2 saw $1.4 billion pour back in as returns exploded-investors are jumping back on board!
Precious metals swing wildly but shield against stock crashes. Their hot 2025 run proves they shine in tough times!
Balance your investments now-mix in metals to cut risks and grab gains from stocks too. Act fast before volatility hits harder!
Exciting Trends from 2010-2024
The S&P 500 soared 400% from 2010 to 2024 after the financial crisis lows. Gold peaked at $1,900 per ounce in 2011 but averaged just 4% yearly returns during low inflation times (Federal Reserve Economic Data).
The 2010-2019 bull market favored stocks. The S&P 500 returned 13.6% annually, while gold lagged at 1.5% (St. Louis Federal Reserve 2024 analysis).
- 2020 Crash: Gold jumped 25% as a safe haven. The S&P 500 dropped 34%.
- 2022 Bear Market: Stocks fell -19%. Silver declined less at -10%.
Stocks win on risk-adjusted returns. Their Sharpe ratio-measuring bang for your risk buck-is 0.8, beating gold’s 0.4 (using VAR models for potential losses). This makes stocks the go-to for growth.
Picture this: A line graph shows the S&P 500 climbing steadily, peaking in 2019 and 2021. Gold? It spiked in 2011 and recovered in 2020, then leveled off-total opposite paths!
Aim for the best long-term wins: Put 60-70% in stocks, including ESG (environment, social, governance) picks. Keep 5-10% in gold to buffer volatility shakes.
Grab easy access with ETFs like SPY for the S&P 500 or GLD for gold. Start building your powerhouse portfolio today!
Current Economic Conditions
In Q4 2024, US GDP grows at 2.8% (Bureau of Economic Analysis). Inflation sits at 2.6%, with Fed rates at 4.75% before key FOMC meetings.
The economy feels mixed-stocks get a lift from easing money policies. But with a 35% recession chance (New York Fed model), grab precious metals as your safety net now!
Key economic indicators show ongoing challenges. The Consumer Price Index (CPI), which tracks price changes in everyday goods and services, sits at 2.6% year-over-year.
This level from the Bureau of Economic Analysis’s third-quarter 2024 report keeps inflation in check. It opens the door for exciting interest rate cuts ahead.
Unemployment stays steady at 4.1%, showing a strong job market.
The Purchasing Managers’ Index (PMI) for manufacturing, which gauges business activity, is at 48.5. This number below 50 points to contraction and hits industrial areas hard.
The 10-year Treasury yield at 4.2% makes bonds a smart pick for steady income. A strong U.S. dollar, with the Dollar Index at 105, helps importers but challenges exporters.
Diversify your portfolio now to stay ahead! Aim for this exciting mix:
- 60% in equities like S&P 500 ETFs.
- 20% in gold via SPDR Gold Shares (GLD).
- 20% in U.S. Treasuries for rock-solid stability.
Check the New York Federal Reserve’s recession probability model every week to time your moves perfectly.
| Indicator | Current Value | Impact on Assets |
|---|---|---|
| Inflation (CPI) | 2.6% YoY | Favors equities; limits bond rallies |
| Unemployment | 4.1% | Supports consumer stocks; burdens cyclicals |
| Manufacturing PMI | 48.5 | Adversely affects industrial sectors; enhances safe-haven assets |
| 10-Year Treasury Yield | 4.2% | Attracts fixed-income investments; constrains equity appreciation |
| USD (DXY) | 105 | Bolsters U.S. dollar-denominated assets; exerts pressure on commodities |
Factors Favoring Precious Metals in 2025
Get ready for 2025! Precious metals could beat stocks if inflation hits 3.5%, as the International Monetary Fund predicts.
Gold might soar to $2,800 per ounce. It acts as a strong shield against changes in Federal Reserve policies.
Inflation and Interest Rates
The Federal Reserve might cut rates to 3.5% in 2025. The CME FedWatch Tool gives this a 60% chance.
Lower real yields could boost gold by 10% to 12%. Real yields are yields adjusted for inflation. This echoes 2019, when rates dropped 0.75% and gold jumped 18%.
Negative real interest rates fuel this trend. They happen when inflation outpaces yields.
IMF data shows a 0.8 correlation between these rates and gold gains. Tools like RSI (Relative Strength Index, measuring price momentum) and MACD (Moving Average Convergence Divergence, spotting trends) back this up.
Take 2022’s stagflation-high inflation at 8% with yields under 2%. Gold still gained 0.5%, but the S&P 500 plunged 19%, per Bloomberg.
Jump on this now! Put 5% to 10% of your portfolio into SPDR Gold Shares ETF (GLD). It mirrors gold prices with just a 0.40% fee and easy trading on platforms like Vanguard.
Track the CME Group FedWatch Tool for rate updates. Also, watch the IMF’s World Economic Outlook from October 2024 for inflation forecasts.
Factors Favoring Stocks in 2025
Stocks look set to shine in 2025! The S&P 500, Dow Jones, and NASDAQ could see 12% earnings growth, says Goldman Sachs.
AI tech is booming, IPOs are buzzing, and consumer spending will hit $15 trillion per the Bureau of Economic Analysis. Don’t miss this rally!
Key drivers make this outlook thrilling. Consider these:
- High-Frequency Trading (HFT), which uses fast computers for quick trades, boosts market efficiency.
- Other boosts like AI growth and consumer rebound.
- Strong company profits will boost NASDAQ earnings per share by 11%. Tech giants drive this growth using Discounted Cash Flow (DCF) models, which estimate future value based on cash projections.
- The Federal Reserve may cut interest rates soon. This could raise asset values and push the S&P 500 price-to-earnings (P/E) ratio to 22. P/E measures stock price against earnings to gauge value.
- Investors are shifting to value stocks for better deals. The financial sector could gain 15% with fewer regulations boosting profits.
- Economists see less than a 20% chance of recession. This supports ongoing growth, backed by Monte Carlo simulations that model thousands of possible outcomes to predict risks.
Put $10,000 into the VOO ETF, which follows the S&P 500. It has averaged 10% yearly returns over time.
Grab the Goldman Sachs 2025 Equity Outlook report for more insights.
Forecasts and Expert Views
JPMorgan predicts gold hitting $2,500 to $2,900 in 2025. That’s a 10-15% jump-exciting for investors!
Bank of America sees the S&P 500 reaching 6,500, up 15%. Expect 2% GDP growth and easing inflation to fuel this rise.
Diversify to handle S&P 500, Dow Jones, and NASDAQ ups and downs. Try a 60/40 mix: 60% stocks, 40% bonds or gold.
Morningstar recommends this to cut risks amid volatility. The VIX index, which tracks market fear, shows high uncertainty now-act fast!
Goldman Sachs is bullish on commodities. Supply issues and slow GDP growth fuel this view.
Vanguard takes a cautious approach to stocks. Recession risks and high P/E ratios (price-to-earnings) worry them.
Bloomberg’s Q4 2024 survey says stocks will beat other investments 55% of the time.
Add 10-15% of your portfolio to gold ETFs like GLD. These act as a hedge against losses.
ETFs are funds traded like stocks. Check Net Asset Value (NAV), the fund’s per-share worth, to confirm it’s a good buy.
| Source | Forecast | Rationale | Confidence Level |
|---|---|---|---|
| JPMorgan | Gold $2,500-$2,900 | Geopolitical tensions | High |
| BofA | S&P 500 at 6,500 | Tech earnings rebound and strong Initial Public Offering (IPO) market, where companies first sell shares publicly. | Medium-High |
| Morningstar | Hybrid 60/40 | Diversification amid uncertainty | Medium |
| Goldman Sachs | Commodities bullish | Supply disruptions | High |
| Vanguard | Equities tempered | Potential recession | Medium |
(References: JPMorgan Precious Metals Outlook 2025; Bloomberg Survey Q4 2024)
Risks and Investment Strategies
Supply issues hit precious metals hard. Russian sanctions spiked palladium prices 10% (USGS data).
Stocks could drop 20% if unemployment hits 5%. Federal Reserve models, shaped by FOMC (Federal Open Market Committee) meetings, predict this.
Diversify: 60% stocks, 20% metals, 20% bonds. Include ESG (Environmental, Social, Governance) factors for better risk control. Aim for a Sharpe ratio of 0.7, which measures return per unit of risk.
Precious metals offer no income and swing wildly. Gold prices jumped or fell 15% in 2023 alone.
Stocks have a beta of 1.2, meaning they move more than the market. This worsened losses in 2008.
Watch RSI (Relative Strength Index) and MACD (Moving Average Convergence Divergence) for overbought signals-these tools spot momentum shifts.
Use simple strategies with risk tools like Monte Carlo simulations (random scenario modeling) and VAR (Value at Risk, potential loss estimate). Here’s how:
- Rebalance quarterly with Vanguard’s free tools. Monte Carlo paths forecast scenarios; ignore HFT (High-Frequency Trading) noise to keep ratios steady.
- Protect metals with put options on GLD. These give the right to sell at a set price if values drop. Skip complex DCF or Granger tests-focus on basic protection.
- Pick cheap ETFs: VTI for stocks, BND for bonds (both 0.03% fees). Add 5% to IAU for metals, tracking GDP for timing.
Exciting news: Vanguard’s 2024 review shows diversification cut 2022 losses by 15%. USGS data backs this-don’t miss out!