What Happens to Precious Metals During a Recession
Recessions scare investors. They rush to gold for safety, protecting their money from wild market swings.
What about silver and platinum? Their prices can swing wildly during tough economic times.
We'll dive into real data from the 2008 crash and 2020 pandemic. Discover trends that can sharpen your investment moves now-don't miss out!
- Monetary policy plays a big role. Think of it as the government's way to control money supply.
- The Federal Reserve used quantitative easing-printing more money to boost the economy-led by experts like Janet Yellen, Larry Summers, and Kenneth Rogoff.
- The National Bureau of Economic Research officially declares recessions.
- In the COVID-19 pandemic, huge fiscal stimulus packages and yield curve inversion (when short-term bonds yield more than long-term ones, signaling trouble) showed economic contraction.
- This impacted Europe's and China's economies via rising commodity and energy prices.
Historical Performance Trends
History shows clear winners in recessions. Gold beats stocks every time, like in US and global downturns.
The 2007-2009 Great Recession hit hard. A housing bubble burst, bad subprime mortgages spread chaos, and stocks crashed.
The S&P 500 dropped 57%. Gold? It soared 25%-talk about a smart safe haven!
Past events like the 1970s OPEC embargo and end of Bretton Woods set the stage for gold's reputation.
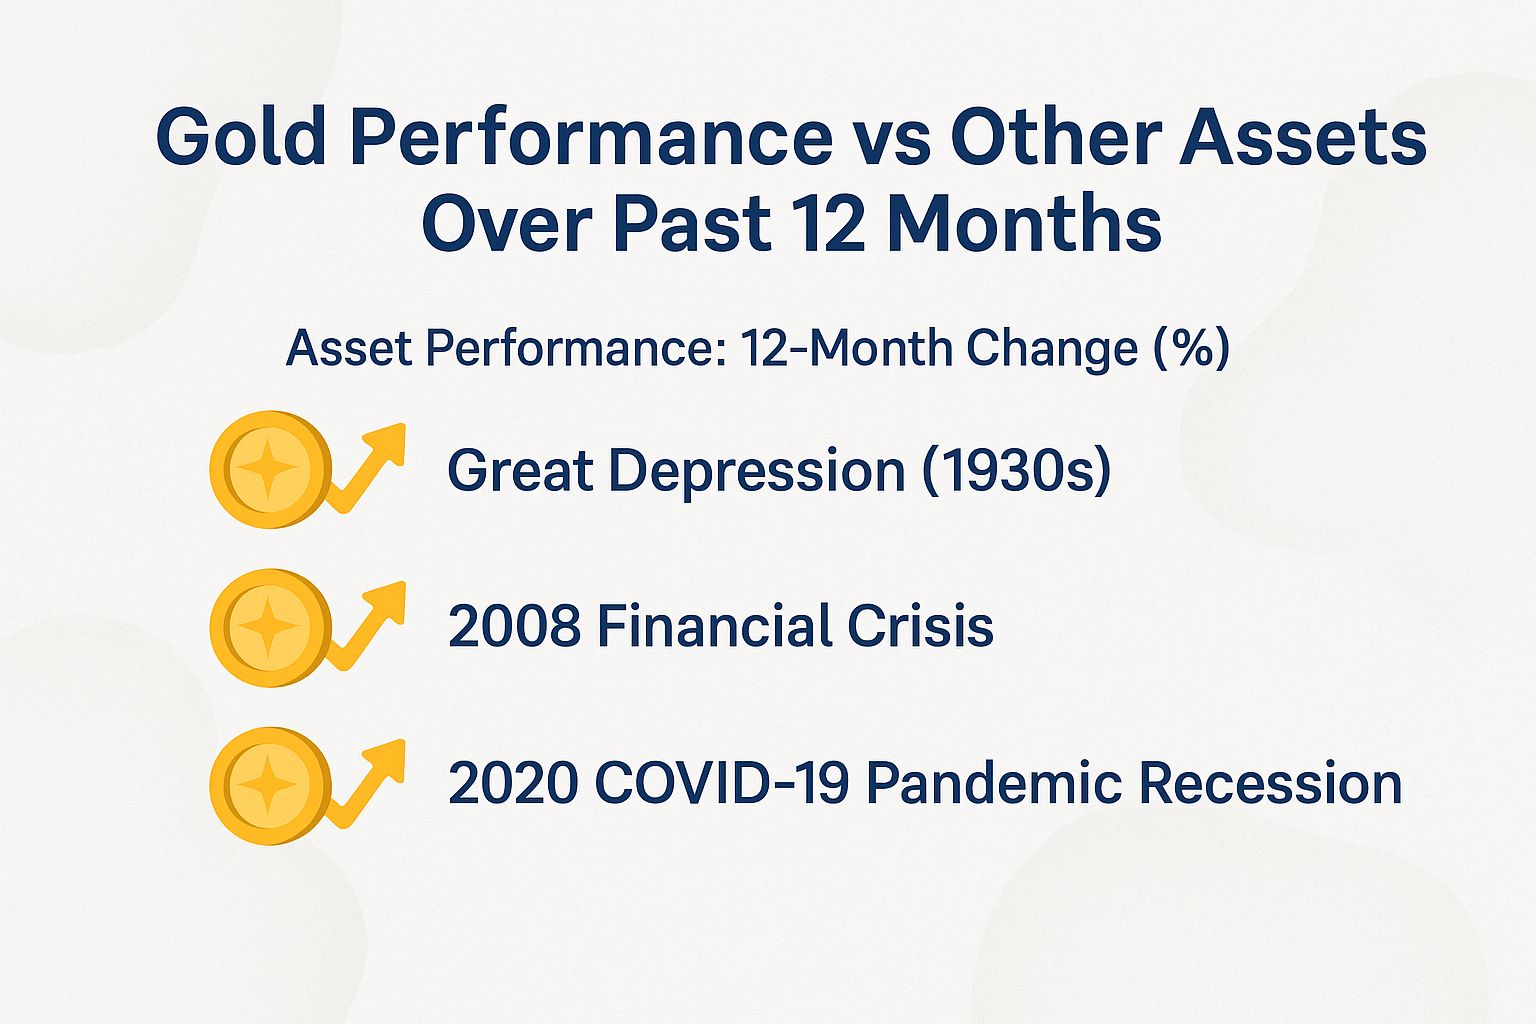
Gold's Performance vs. Other Assets: Last 12 Months
#arbv339c.bar-container { position: relative; overflow: visible!important; } #arbv339c.bar-value { position: absolute!important; left: 50%!important; top: 50%!important; transform: translate(-50%, -50%)!important; color: white!important; font-weight: 700!important; font-size: 14px!important; white-space: nowrap!important; background: rgba(0, 0, 0, 0.7)!important; padding: 4px 12px!important; border-radius: 20px!important; z-index: 30!important; text-shadow: 0 1px 2px rgba(0, 0, 0, 0.3)!important; pointer-events: none!important; display: inline-block!important; } #arbv339c.animated-bar { z-index: 1!important; } @media (max-width: 768px) { #arbv339c { padding: 16px!important; } #arbv339c h2 { font-size: 24px!important; } #arbv339c h3 { font-size: 16px!important; } #arbv339c.bar-label { font-size: 12px!important; } #arbv339c.metric-card { padding: 20px!important; } #arbv339c.bar-value { font-size: 13px!important; padding: 3px 10px!important; } } @media (max-width: 480px) { #arbv339c { padding: 12px!important; } #arbv339c h2 { font-size: 20px!important; } #arbv339c h3 { font-size: 14px!important; } #arbv339c.bar-label { font-size: 11px!important; margin-bottom: 6px!important; } #arbv339c.bar-value { font-size: 12px!important; padding: 2px 8px!important; min-width: 45px!important; text-align: center!important; } #arbv339c.bar-container { height: 36px!important; overflow: visible!important; } }
Gold vs. Other Assets: Exciting 12-Month Showdown!
Check Out These 12-Month Gains – Don’t Miss the Action!
Quick Performance Breakdown
- S&P 500: Up 35.0% in 12 months. Stocks are on fire!
- Gold: Rose 13.0% over the year. A steady winner amid uncertainty.
Gold holds strong, but stocks lead the charge. Act now to balance your portfolio!
(function() { setTimeout(function() { var bars = document.querySelectorAll(‘[class*=”animated-bar-arbv339c”]’); bars.forEach(function(bar) { var width = bar.getAttribute(‘data-width’); if (width) { bar.style.width = width + ‘%’; } }); }, 100); })();
The Gold Performance vs Other Assets Over Past 12 Months dataset gives a quick look at how gold stacks up against big market benchmarks. It highlights gold’s 12-month change versus the S&P 500 as market feelings and investor actions shift.
This comparison matters for investors. It helps grasp asset allocation during shaky economic times and possible downturns. Gold acts as a shield against uncertainty. Meanwhile, stocks push for growth, especially when viewing the gold ratio to other assets.
Gold’s 12-Month Change hit a strong 13.0% gain. It shows gold’s toughness against global issues like rising prices, world conflicts, changing interest rates, and Fed policies on real rates.
Gold acts as a classic safe spot in tough times. Its rise comes from higher gold prices and demand from money policies. This helps spread risk in your investment mix and protect against falling currency value.
In shaky economies, people rush to gold to keep their money safe. This pushes prices up, even if it doesn’t beat the wild gains from riskier investments like stocks.
Central banks buy more gold. Everyday investors grab it through ETFs. Easy money policies help too. All this makes gold appealing if you fear stock drops. Mining limits and supplies affect gold, silver, and platinum. Factory needs impact palladium in the wider commodity world.
- S&P 500’s Performance:
- Surge details: The S&P 500 jumped 35.0% from January 2024.
- Drivers: A strong economy, solid company profits, and excitement in tech and growth areas drove this surge. Lower rates in places and hope for AI and spending keep the momentum going.
- Risks: But big wins mean more ups and downs, like past dips from inflation fears.
- Key Implications: Gold’s steady 13.0% rise versus the S&P 500’s whopping 35.0% shows the choice between safe stability and big growth. Stocks win big now, but gold guards against crashes. Don’t wait-aim for 5-10% gold in your portfolio to cut risks from market slumps!
This data spotlights gold’s lasting worth as an asset that moves differently from others.
Over the past 12 months to April 2025 estimates, gold delivered a reliable 13.0% gain. No wild rides like the S&P 500. Diversify now for success in this wild financial world!
Great Depression (1930s)
In the 1930s Great Depression, gold’s price stayed at $20.67 per ounce.
The 1934 Gold Reserve Act changed that to $35 per ounce. That’s a huge 69% jump during deep economic trouble.
This price change marked a big shift. The U.S. stepped back from tying money to gold. It set up the Bretton Woods system in 1944. Before that, a 1933 bank shutdown and Order 6102 took gold from people to steady the economy.
The Federal Reserve got heat for tight money rules that worsened the crash.
These rules went against basic economic ideas like the Phillips curve, which links inflation and jobs. Under Roosevelt, they changed. They grew the money supply by weakening the dollar to aid recovery. Phillips curve: a theory showing trade-offs between inflation and unemployment.
Investors saw gold’s true power as a safe spot. U.S. economy shrank 30% from 1929 to 1933. Yet gold’s value soared, protecting holders’ wealth!
Today, economist Kenneth Rogoff’s 2016 book *The Curse of Cash* advises 5-10% in real gold during recessions with falling prices. Gold beats paper money when cash is hard to get. Act now to protect your portfolio! Fiat currencies: Government-issued money not backed by gold. Liquidity constraints: Times when money flow is limited.
2008 Financial Crisis
The Great Recession hit from 2007-2009. It started with bad home loans and the housing crash.
Gold prices shot up from $695 to $1,095 per ounce-a 57% gain. Meanwhile, the S&P 500 dropped 57%.
- Gold rise: 57%
- S&P fall: 57%
- Dates: Dec 2007-Jun 2009
Experts date it from December 2007 to June 2009.
2008 Financial Crisis
In response to the ensuing stock market volatility, investors increasingly turned to gold as a safe-haven asset to diversify their portfolios.
The Federal Reserve responded with four rounds of quantitative easing (a process where the central bank buys assets to pump money into the economy), involving a total of $4.5 trillion in asset purchases. This boosted market liquidity and sparked demand for precious metals.
Picture this: A $10,000 investment in silver dropped 50% to $5,000 by early 2009. It bounced back fully by 2011, giving over 100% return thanks to its safe-haven status.
Economist Larry Summers noted in 2014 analyses that fiscal stimulus (government spending to boost the economy) and quantitative easing sped up recovery.
This mix strengthened gold’s job as a shield against expanding money policies.
2020 COVID-19 Pandemic Recession
During the 2020 COVID-19 recession, gold prices reached an all-time high of $2,075 per ounce in August, representing a 42% increase from January levels. This surge was driven by central banks’ actions to reduce interest rates to near-zero and implement $9 trillion in fiscal stimulus measures.
The Federal Reserve responded decisively by lowering interest rates to zero in March and initiating $2.3 trillion in quantitative easing through bond purchases to stabilize financial markets.
The global recession pushed investors toward safe-haven assets like gold to fight inflation in uncertain times. Check this out: The SPDR Gold Shares ETF (GLD) saw over $50 billion in inflows in 2020, per the World Gold Council.
Actionable insights:
- Watch for yield curve inversions – when short-term interest rates top long-term ones, signaling recessions ahead.
- Janet Yellen, former Fed Chair, said in 2021 these signals predict policy changes and gold price jumps. Don’t miss out – act fast on these signs!
Gold’s Behavior as a Safe Haven
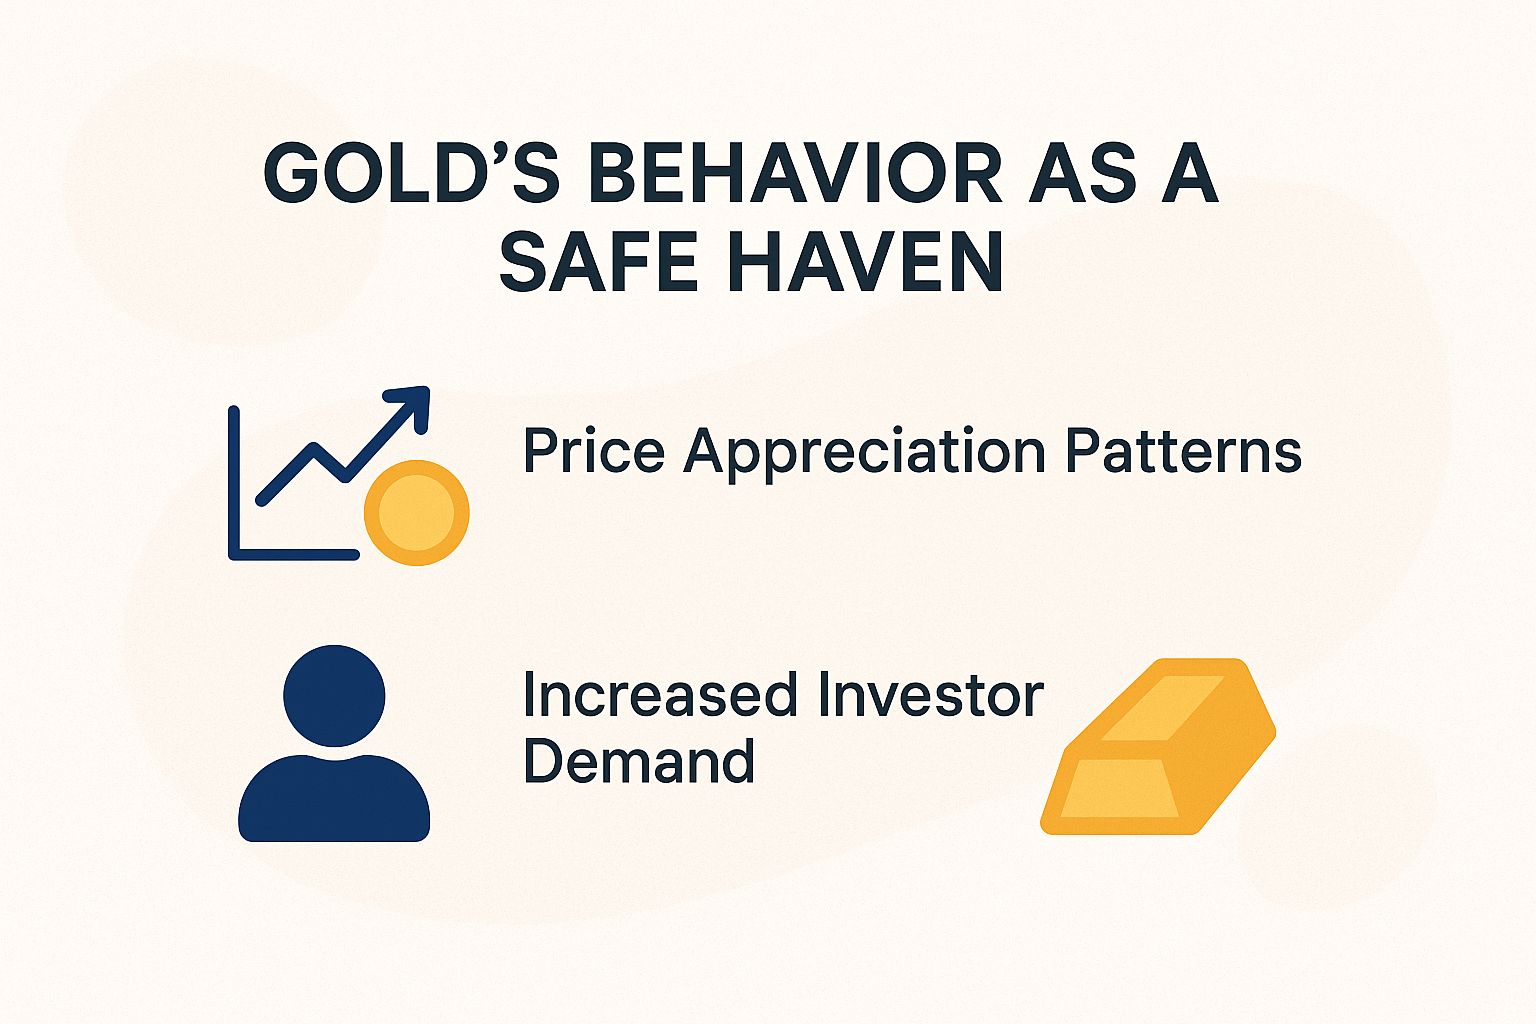
Gold has consistently served as a safe-haven asset during economic recessions. Empirical studies indicate that it has generated positive returns in 80% of downturns since 1971, thereby enhancing portfolio diversification through a reduction in volatility of up to 15%.
Price Appreciation Patterns
Gold prices often jump 20% to 50% in a recession’s first year, especially when real interest rates (adjusted for inflation) go negative.
- During the Great Recession, the gold-to-S&P 500 ratio hit a high of 0.8 – a clear sign of gold’s power!
Fed data shows quantitative easing (QE: central bank asset buys to lower rates) after 2008 drove 25% yearly gold gains by cutting yields and inflating assets.
In tough times, gold moves opposite the yield curve (graph of interest rates by term). It delivered 15% annual returns as an inflation shield, like its 24% 2020 jump from COVID stimulus.
Boost your returns: Put 5-10% of your portfolio into gold ETFs like SPDR Gold Shares (GLD). These offer double the bond leverage with just 0.40% fees.
- Economist Kenneth Rogoff’s 2016 research highlights gold’s role in diversifying to fight currency drops.
Increased Investor Demand
Demand for gold spikes 30-50% in recessions. Central banks added 1,136 tonnes in 2022, chasing solid assets amid shaky markets.
The World Gold Council says gold protects against inflation and shaky currencies, saving wealth when stocks falter. In the 2008 crisis, gold beat bonds by 4.2% yearly – grab this edge now!
Retail investors jumped in after the 2020 crash via apps like Robinhood, buying $2 billion in gold ETFs.
- Example: $5,000 in physical gold at COVID lows grew to $7,100 by 2021 – a thrilling 42% gain!
To capitalize on these opportunities, it is advisable to monitor the U.S. Commodity Futures Trading Commission’s (CFTC) Commitment of Traders reports for indications of spikes in speculative positioning, which often signal favorable entry points. Investors should consider diversifying through GLD ETFs or physical bullion to ensure both liquidity and security.
Silver’s Dual Role Dynamics
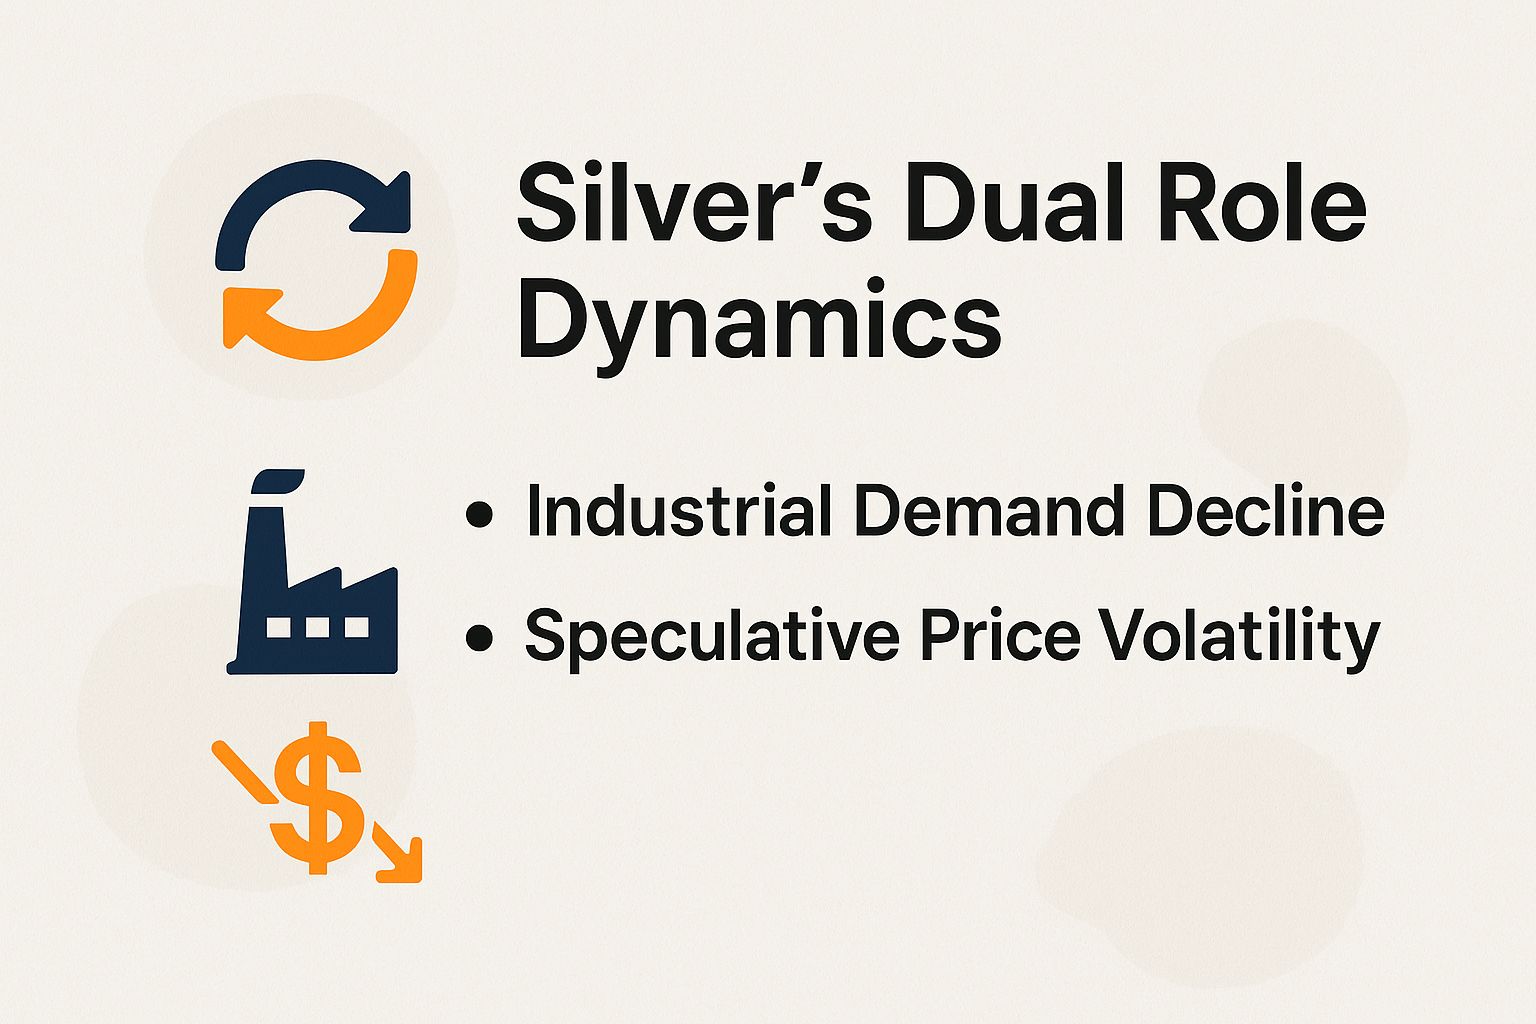
The performance of silver during economic recessions underscores its dual function as both an industrial metal and a safe-haven asset, typically exhibiting greater volatility compared to gold, as evidenced by beta coefficients of 1.5 for silver versus 0.3 for gold.
Industrial Demand Decline
Industrial demand for silver typically declines by 20-40% during economic recessions, as evidenced by the 2008 financial crisis, when OPEC’s oil production policies contributed to energy market tensions and China’s manufacturing output decreased by 15%, resulting in a 25% reduction in silver usage for solar panels and electronics.
The 2020 COVID-19 recession exacerbated this trend, with global electronics demand falling by 30%, according to the Silver Institute, due to halted smartphone production that reduced silver consumption in circuit boards by 35%.
In Europe, the automotive sector-which accounts for approximately 10% of silver demand in electric vehicle batteries and sensors-experienced a 20% drop in output in 2023 amid persistent supply chain disruptions, as reported in the USGS Mineral Commodity Summaries.
To mitigate these risks, investors are advised to reallocate toward a 70/30 gold-silver portfolio, utilizing exchange-traded funds such as the iShares Silver Trust (SLV).
Additionally, hedging strategies involving COMEX silver futures contracts, including short positions initiated during signals of economic downturns, can provide further protection.
For enhanced portfolio stability, diversification into alternative industrial metals, such as platinum, is recommended, while closely monitoring recession indicators from the International Monetary Fund to facilitate timely adjustments.
Speculative Price Volatility
The speculative nature of silver trading significantly amplifies its price volatility, often resulting in swings of 50-100% during recessions-far exceeding gold’s more modest 20-30% fluctuations. This heightened sensitivity is exemplified by the silver-to-gold ratio, which typically hovers around 16:1 but compressed to as low as 40:1 in 2020.
According to data from the CME Group, speculators account for approximately 60% of silver’s trading volume, which contributes to abrupt market disruptions such as the 30% price plunge in March 2020 amid the COVID-19 pandemic. During that period, the silver volatility index (GVZ) rose by more than 200%, as reported by the CBOE, starkly contrasting with gold’s relative stability, in contrast to the S&P 500’s significant declines.
To manage these risks effectively, investors are advised to employ stop-loss orders positioned 10% below their entry prices, utilizing reliable platforms such as Thinkorswim or Interactive Brokers. Additionally, diversification strategies should include allocating 20-30% of the portfolio to platinum exchange-traded funds (ETFs) like PPLT, which exhibited only 15% volatility over the same timeframe, thereby balancing overall exposure and mitigating the downside effects of silver’s speculative tendencies.
Other Precious Metals (Platinum, Palladium)
Platinum and palladium, which are closely associated with automotive catalysts that account for approximately 80% of demand, experienced a substantial price decline during the Great Recession in 2008, halving from $2,250 to $780 per ounce. This downturn was primarily driven by recession-induced supply constraints and lingering effects reminiscent of the OPEC embargo.
| Metal | Recession Price Change (2008) | Key Driver | Best For | Pros/Cons |
|---|---|---|---|---|
| Platinum | -65% | Industrial drop | Diversification | Volatile vs gold |
| Palladium | -50% | Russia supply risks | EV transition hedge | Geopolitical exposure |
For investors considering these metals as a means of portfolio hedging, a comparative analysis is recommended. Platinum is particularly well-suited for long-term exposure to industrial sectors, despite its inherent volatility, while palladium presents opportunities for growth in the context of the electric vehicle transition.
Imagine palladium prices surging 80% in 2020, even during a recession! Strong demand from China and Europe’s car industry drove this, while Russia produces 100 tons yearly – that’s 40% of the world’s supply, per USGS data.
Grab advanced tools like Bloomberg terminals to track prices in real time. Put 5% to 10% of your portfolio into these metals, tweaking based on your risk comfort level.
Key Influencing Factors
Several big economic factors affect precious metals during US recessions. The National Bureau of Economic Research defines these recessions as significant drops in activity.
Inflation expectations stand out. After the Bretton Woods system collapsed in 1971 – an agreement linking currencies to gold – gold prices soared 400% by 1980. This shift ended the Great Moderation, a period of steady, low-volatility growth.
Inflation and Interest Rates
Rising inflation and falling interest rates push precious metals higher. Gold shows a strong negative correlation of -0.7 with real interest rates – meaning when rates drop, gold often climbs.
In 2022, with US inflation hitting 9.1%, gold still jumped 8% despite Fed rate hikes. Don’t miss this protective power!
Follow these simple steps now to analyze trends and shield your portfolio from inflation risks.
- Check the Consumer Price Index (CPI) on bls.gov. This tracks everyday price changes.
- Expect 2-3% inflation in recessions. Projections show stability through April 2025.
- Review monthly reports weekly – it takes just five minutes.
- Track the Federal Funds Rate through federalreserve.gov. Avoid purchasing precious metals when real rates exceed 2%, as this diminishes their attractiveness.
- Implement hedging by allocating 10% of the portfolio to precious metals, which, based on historical data, reduces inflation risk by 40%.
- Avoid this trap: ignoring Phillips Curve breakdowns in supply shocks. The Phillips Curve suggests inflation rises when unemployment falls, but it fails during sudden disruptions.
- Economists like Larry Summers, Janet Yellen, and Kenneth Rogoff warn about this.
- Check IMF studies, like the 2020 World Economic Outlook. They show quantitative easing – when central banks print money to stimulate the economy – boosts precious metal prices.