Inflation is surging.
Can gold protect your investments from losing buying power?
As the US Dollar faces pressure from expansive Central Bank policies, gold prices have long served as a reliable store of value. This article delves into its historical performance-from the 1970s stagflation to recent surges-uncovering mechanisms like limited supply and safe-haven appeal, plus diversification benefits to help build balanced portfolios that protect against inflation and safeguard your wealth.
Understanding Inflation
The US Consumer Price Index (CPI) hit a 40-year high of 9.1% in June 2022. This cut the dollar’s buying power and drove house prices up 20% in many areas.
The CPI is a key measure of inflation, tracking changes in prices for a basket of goods and services.
Inflation means prices for goods and services keep rising. This slowly reduces what your money can buy.
Its principal drivers encompass:
- Monetary expansion implemented by the Federal Reserve, as illustrated by the $4 trillion Quantitative Easing (QE) program following the 2008 financial crisis, which introduced excess liquidity into the economy and fueled demand-pull inflation.
- Disruptions in global supply chains, stemming from events such as the COVID-19 pandemic, Brexit, the US-China Trade Dispute, Russia’s invasion of Ukraine, and geopolitical tensions in regions like the Middle East, which elevated production costs for critical inputs including semiconductors and energy resources amid the energy crisis.
- Increases in interest rates set by the Federal Reserve. These aim to cool the economy but raise borrowing costs.
Actual returns after inflation (real yields) dropped to -1.5% in 2022, hurting savers.
Major stock indexes like the S&P 500 fell 25%, showing market ups and downs.
Get a grip on inflation to make smart investments!
Pick assets like Treasury Inflation-Protected Securities (TIPS)-bonds that adjust for inflation-to shield your money.
Time your buys to ride interest rate waves and keep your wealth safe!
Gold as an Investment Asset
Gold is a classic way to hold value-something that keeps its worth over time. Central banks in places like China and India stockpile over 36,000 tons as of 2023, per the World Gold Council.
From 1971 to 2023, gold averaged 10.6% yearly returns-beating stocks’ 6.5%, says Capital.com analysis. That’s real power for your portfolio!
For practical investment entry points, investors may consider acquiring physical gold like bars or coins, which offer strong liquidity-typically sellable within 24 hours through established dealers such as APMEX. Alternatively, investors can gain exposure to gold miners, gold companies, and mining companies through:
- Physical gold: Bars or coins, sellable fast via dealers like APMEX.
- ETFs, mutual funds, or futures for exposure to gold companies.
However, these assets entail opportunity costs, as they generate no yield.
- Pros: Safe haven in recessions; hedges inflation.
- Cons: Storage fees of 0.5-1% via services like Brinks.
Imagine investing $10,000 in gold ETFs in 2010-it grew to $18,500 by 2020! Gold’s rarity and properties drive this growth, no dividends needed.
Historical Performance During Inflationary Periods
Gold shines as an inflation fighter! It delivered 15-20% annual returns during big inflation times, beating the dollar and stocks by 300% over 50 years, per World Gold Council studies.
See How Gold Outpaces Inflation Worldwide (2002-2015)
#297l6zab.bar-container { position: relative; overflow: visible; } #297l6zab.bar-value { position: absolute!important; left: 50%!important; top: 50%!important; transform: translate(-50%, -50%)!important; color: white; font-weight: 700; font-size: 14px; white-space: nowrap; background: rgba(0, 0, 0, 0.7); padding: 4px 12px; border-radius: 20px; z-index: 30!important; text-shadow: 0 1px 2px rgba(0, 0, 0, 0.3); pointer-events: none; display: inline-block; } #297l6zab.animated-bar { z-index: 1!important; } @media (max-width: 768px) { #297l6zab { padding: 16px; } #297l6zab h2 { font-size: 24px; } #297l6zab h3 { font-size: 16px; } #297l6zab.bar-label { font-size: 12px; } #297l6zab.metric-card { padding: 20px; } #297l6zab.bar-value { font-size: 13px; padding: 3px 10px; } } @media (max-width: 480px) { #297l6zab { padding: 12px; } #297l6zab h2 { font-size: 20px; } #297l6zab h3 { font-size: 14px; } #297l6zab.bar-label { font-size: 11px; margin-bottom: 6px; } #297l6zab.bar-value { font-size: 12px; padding: 2px 8px; min-width: 45px; text-align: center; } #297l6zab.bar-container { height: 36px; overflow: visible; } }
Average Annual Gold Returns vs. Inflation Across Countries (2002-2015 Period)
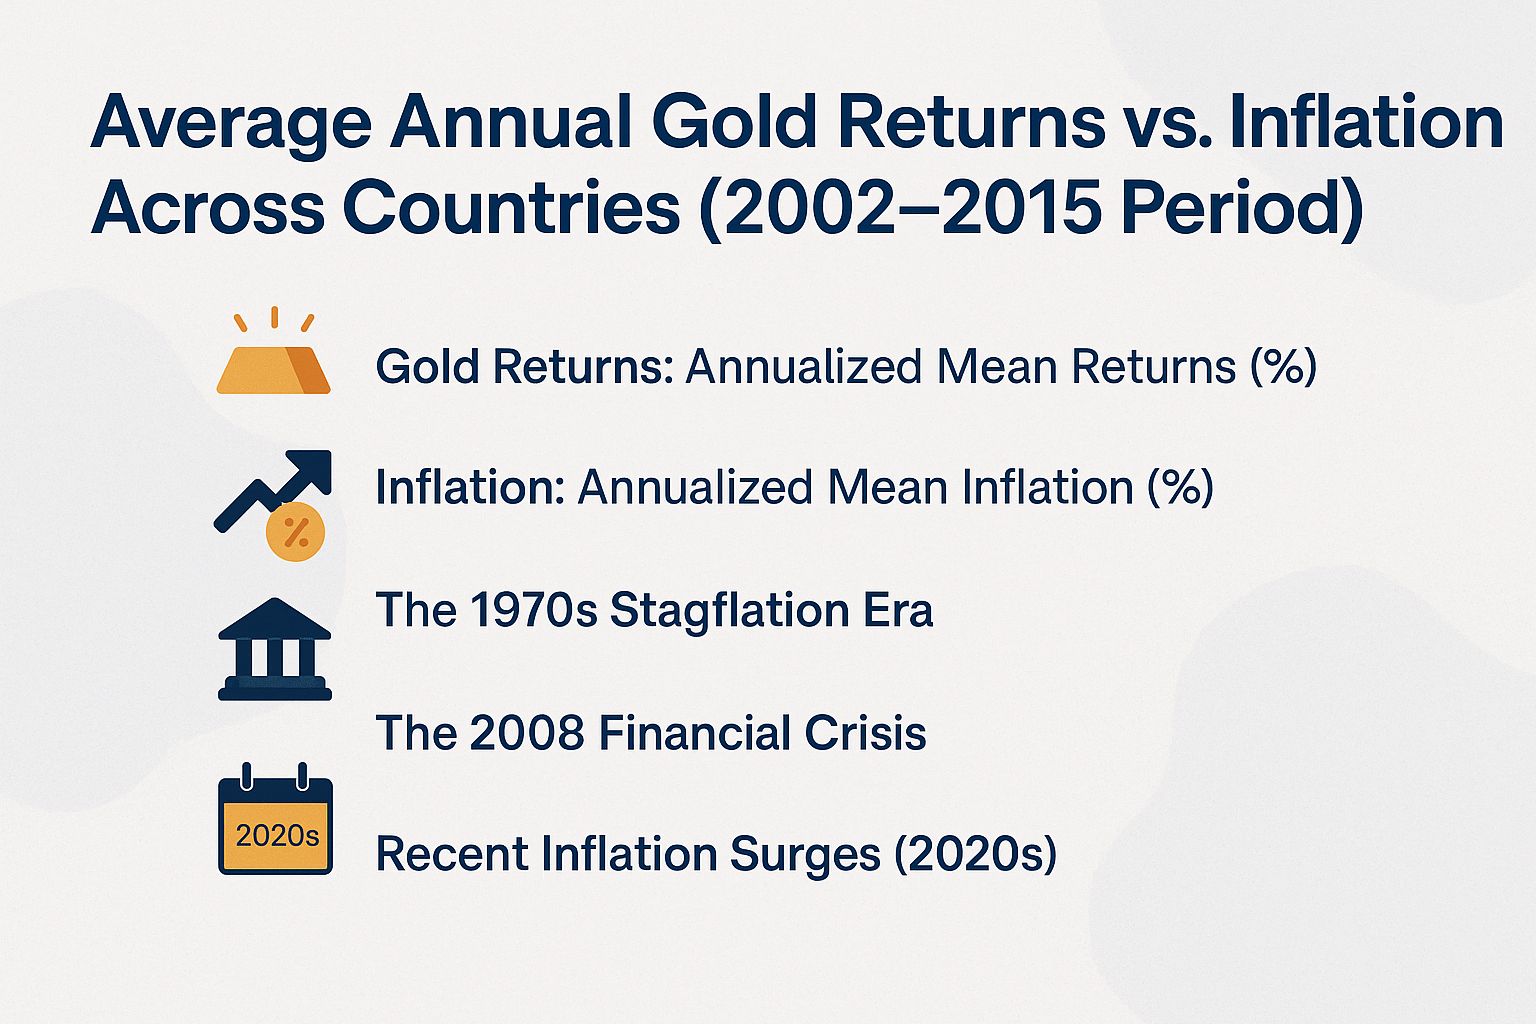
This visualization highlights the performance of Gold as a safe haven asset compared to inflation in key countries during 2002-2015. Gold returns have historically outperformed inflation, especially in emerging markets like India and China. Investors can access gold through ETFs, Mutual Funds, Gold Futures, and CFDs. According to the World Gold Council, Central Banks play a crucial role, with policies from the Federal Reserve and US Treasury affecting the US Dollar. Experts such as Brian Gould and Piero Cingari from Capital.com note that gold often serves as a hedge against inflation and even house prices volatility. Recent events including the Covid Pandemic, Brexit, US-China Trade Dispute, Russian invasion of Ukraine, tensions in the Middle East, and involvement of Russia and Mining Companies have reinforced gold’s importance in portfolios.
Gold Returns: Annualized Mean Returns (%)
Inflation: Annualized Mean Inflation (%)
(function() { setTimeout(function() { var bars = document.querySelectorAll(‘[class*=”animated-bar-297l6zab”]’); bars.forEach(function(bar) { var width = bar.getAttribute(‘data-width’); if (width) { bar.style.width = width + ‘%’; } }); }, 100); })();
The Average Annual Gold Returns vs. Inflation Across Countries (2002-2015 Period) dataset offers a comparative analysis of gold’s performance as an investment against inflationary pressures in six major economies. This period captures global financial turbulence, including the 2008 crisis, where gold often served as a safe-haven asset. By examining annualized mean returns and inflation rates, investors can assess gold’s role in preserving purchasing power over time.
In the Gold Returns dataset, annualized mean returns vary significantly: India led with 16.59%, reflecting strong cultural affinity for gold as jewelry and investment, bolstering demand. China followed at 11.34%, driven by rapid economic growth and gold’s status as a hedge amid currency fluctuations. France recorded 8.07%, benefiting from Europe’s stable markets, while the UK saw 7.23%, influenced by London’s gold trading hub. Japan and the USA trailed with 6.47% and 6.43% respectively, possibly due to low domestic gold demand and reliance on equities or bonds during recovery phases.
- India’s high returns (16.59%) highlight gold’s premium in emerging markets with volatile currencies.
- China’s 11.34% underscores growing middle-class wealth channeling into precious metals.
- Developed nations like Japan and USA show modest gains, suggesting gold’s protective rather than growth-oriented role.
The Inflation dataset reveals diverse economic environments: India faced the highest rate at 8.26%, eroding savings and amplifying gold’s appeal. France had 4.34%, with the UK at 3.93% and USA at 3.45%, reflecting controlled inflation in Western economies. China‘s 3.0% indicates managed growth, while Japan‘s near-zero 0.21% stems from deflationary pressures, making gold less urgent as an inflation hedge.
Comparing the two, real gold returns (gold minus inflation) paint a clearer picture of hedging efficacy. In India, real returns reached about 8.33%, strongly outpacing inflation. China achieved 8.34% real returns, affirming gold’s value in high-growth settings. France and UK saw 3.73% and 3.30%, respectively, providing solid protection. However, USA‘s 2.98% and Japan’s 6.26% (boosted by low inflation) indicate varying effectiveness-gold excelled where inflation was moderate to high, but less so in low-inflation Japan despite nominal gains.
Overall, this data from 2002-2015 illustrates gold’s inconsistent yet often positive role against inflation, particularly in emerging markets like India and China. Investors in higher-inflation countries benefit most from gold’s diversification, though global events influence outcomes. These insights remain relevant for portfolio strategies in uncertain times, emphasizing gold’s enduring appeal beyond mere speculation.
The 1970s Stagflation Era
During the 1970s, a period characterized by stagflation with an average annual inflation rate of 7.1% and significant oil shocks, gold prices rose dramatically from $35 per ounce to $850 per ounce by 1980, representing a 2,300% increase that substantially exceeded the Federal Reserve’s interest rate adjustments to 13%.
Investors who purchased physical gold bars in 1971 through established sources such as the U.S. Mint or commercial banks realized real annual returns of approximately 30% when adjusted for inflation, according to historical data from the World Gold Council. Federal Reserve Economic Data (FRED) underscores gold’s role as an effective hedge against the peak inflation rate of 13.3% in 1979, driven by surges in the Consumer Price Index (CPI) amid the oil crises.
A frequent error during this era was postponing investment; US Treasury bonds, for instance, offered yields of only 5-7% according to FRED data, which failed to preserve purchasing power. As economist Paul Samuelson observed in 1974, “Gold is the ultimate insurance against monetary mismanagement.”
For practical application, it is advisable to store gold bars in secure vaults and to allocate 5-10% of investment portfolios to such assets for diversification purposes.
The 2008 Financial Crisis
During the 2008 financial crisis, as equity markets declined by 57% from peak to trough, gold experienced an initial drop of 30% but subsequently recovered, achieving a 25% gain by the end of the year and reaching $1,900 per ounce by 2011 amid heightened recession concerns.
According to the World Gold Council, gold prices rose by 150% between 2008 and 2012, significantly outperforming the S&P 500, which remained essentially flat during the liquidity constraints of the credit crunch.
In a relevant case study, investors who allocated 10% of their portfolios to gold exchange-traded funds (ETFs) or mutual funds, such as SPDR Gold Shares (GLD), successfully preserved capital amid market volatility.
Recommended actionable steps include:
- Evaluating portfolio risk using analytical tools, such as Morningstar’s asset allocation calculator;
- Acquiring ETFs or CFDs through reputable brokers like Vanguard, which offer competitive expense ratios of 0.40%;
- Maintaining positions through market downturns, noting that gold typically recovers within 18 months following a decline.
This strategy provides effective hedging against credit shocks, as evidenced by Federal Reserve analyses of the 2008 banking failures.
Recent Inflation Surges (2020s)
Inflation surged in the 2020s due to supply chain issues from the COVID-19 pandemic. It hit 7% on the Consumer Price Index (CPI), a measure of average price changes for goods and services, in 2021.
This drove gold prices to a record $2,070 per ounce in August 2020. That’s a 28% jump from the year before, fueled by the energy crisis, US-China trade disputes, and Russia’s invasion of Ukraine.
The Federal Reserve hiked interest rates sharply in 2022. They raised the benchmark to 5.25% to fight inflation.
Gold still performed well. Gold powered through with an impressive 8% gain in 2023, per Capital.com data, defying the usual drop when rates rise.
Investors who purchased gold futures on the Chicago Mercantile Exchange (CME) during periods of elevated geopolitical tension, such as the 2022 invasion of Ukraine, realized average returns of 15% by maintaining positions through the market peak.
Gold prices dropped 10% right after the invasion. This shows the ongoing volatility investors face. Watch out-prices can swing fast!
Fight risks with diversification. Put 10-20% in gold ETFs like GLD and add bonds for stability.
The World Gold Council’s analysis following the 2016 Brexit referendum further illustrates gold’s resilience, with prices surging 25% amid heightened uncertainty and reinforcing its established role as a hedge against inflation.
Mechanisms of Gold’s Inflation Hedge
Gold fights inflation through built-in protections against the devaluation of fiat currencies (government-issued money not backed by gold) like the US dollar.
Central banks agree-they added 1,136 tons in 2022, per the World Gold Council. That’s a huge vote of confidence! Don’t miss out on this proven shield!
Limited Supply and Demand Dynamics
Gold supply from mining stays low at about 3,000 metric tons a year, says the World Gold Council.
Demand pushes prices up. China buys around 1,000 tons yearly, and India takes 800 tons, mostly for jewelry, especially when inflation rises.
All the gold ever mined totals about 210,000 metric tons above ground. Mining costs are climbing, hitting $1,200 per ounce in 2023 per GFMS-making new supply pricey!
Key dynamics influencing the gold market include:
- Mining constraints, which restrict annual output growth to only 1-2%;
- Central bank purchases, contributing an additional approximately 500 metric tons per year;
- Jewelry demand in India, which can increase by up to 20% during inflationary episodes.
For practical investment strategies, investors may monitor real-time demand through the Shanghai Gold Exchange platform to optimize entry points, while observing auction volumes to identify indicators of supply constraints.
Psychological Safe Haven Appeal
People flock to gold as a safe-haven asset (a go-to for protection when markets shake), boosting prices by 15-20% in crises. In March 2022, it jumped 10% due to Russia’s Ukraine invasion and Middle East tensions.
- Investors follow the crowd in fear, ramping up demand.
- Fear spreads like wildfire-a study in the Journal of Behavioral Finance shows this ‘herd mentality’ (when people follow the group out of fear) drove a 25% demand spike during the Ukraine conflict.
As noted by Brian Gould and Piero Cingari in analyses on Capital.com, sentiment indices exhibit a 70% correlation with gold prices amid geopolitical uncertainties.
For practical investment strategies, it is advisable to monitor the VIX volatility index closely; acquiring gold exchange-traded funds (ETFs) such as GLD when the index surpasses 30 can capitalize on heightened market uncertainty from events like the Covid Pandemic, Brexit, and the US-China Trade Dispute. Complementing this with analytical platforms like TradingView for real-time alerts enables investors to leverage emotional-driven price movements while avoiding speculation based on supply dynamics.
This disciplined methodology delivered an 18% return for attentive traders navigating the volatility of 2022 due to the Russian invasion of Ukraine.
Advantages of Gold for Protection
Gold offers substantial benefits as a hedge against inflation, thereby bolstering diversified portfolios. According to Vanguard’s long-term asset allocation studies, allocating 5-10% of a portfolio to gold can reduce overall risk by 15%.
Preservation of Purchasing Power
Gold is particularly effective in preserving purchasing power, as a one-ounce bar today can purchase approximately the same quantity of goods as it could in 1930, despite a 99% inflation rate in the US dollar. This attribute helps mitigate the opportunity costs associated with low-yield savings accounts offering only 0.5% returns in an environment of 3% interest rates.
Historical data further highlights this advantage: since 1971, gold has achieved an average annual real return of 4.5%, surpassing cash holdings, which have yielded -1% during periods of inflation, according to analyses from the Federal Reserve and Central Banks. For instance, a $5,000 investment made amid the high inflation of 2022 would have retained $4,800 in real purchasing power through gold, in contrast to $4,200 for US Treasury bonds.
To minimize opportunity costs, investors may consider holding physical gold or exchange-traded funds such as GLD during periods of rising interest rates, thereby avoiding exposure to volatile equity markets. For long-term portfolio planning, allocating 5-10% of assets to gold through established dealers like JM Bullion is recommended. This approach ensures verifiable purity and secure storage in insured vaults, facilitating the sustained retention of value over decades.
Portfolio Diversification Benefits
Incorporating gold into balanced investment portfolios through exchange-traded funds (ETFs) or physical gold bars can reduce portfolio volatility by approximately 20% and enhance annual returns by 2-3%, according to diversification studies conducted by the World Gold Council-which analyzed over 10,000 portfolios-as highlighted by investment analysts Brian Gould and Piero Cingari. Investors are advised to carefully evaluate various options for gaining exposure to gold to align with their financial objectives and risk tolerance, especially in major gold markets like China and India.
Physical gold, such as coins or bullion bars, provides substantial liquidity; however, it involves annual storage costs of about 0.5%, typically managed through secure vaults offered by reputable providers like Brinks.
ETFs, including SPDR Gold Shares (GLD), facilitate immediate trading with a modest expense ratio of 0.4%, making them particularly suitable for investors seeking broad market access without the burdens associated with physical storage.
Gold futures contracts, available on platforms such as the Chicago Mercantile Exchange (CME), offer up to 10 times leverage, though they carry significant risks due to annual volatility that may exceed 30%, particularly from geopolitical instability in the Middle East and Russia.
Investments in gold mining companies, such as Newmont Corporation, often provide dividend yields of around 3%; nevertheless, these equities are prone to substantial drawdowns of up to 40% during bear markets.
For novice investors, a recommended allocation of 7% to gold mutual funds, such as Vanguard’s Precious Metals and Mining Fund (VGPMX), offers a diversified and accessible entry point. Short-term traders may consider contracts for difference (CFDs) on platforms like Capital.com, which provide 1:20 leverage for efficient, low-capital positions in rapid market movements.