Silver, a precious metal like gold and platinum, has jumped from low prices to over $50 an ounce in recent years. This rise sparks hot debates about its future and market predictions.
Industrial demand is booming, and economic worries are growing. Investors wonder: can silver hit $150 an ounce? This analysis explores history, supply issues, inflation, global risks, speculation, expert views, and big challenges. Get ready to see if silver’s hot streak can smash records!
Historical Price Trends
Silver prices have swung wildly over the years. They ranged from $1.29 per ounce in 1970 to a peak of $49.45 in January 1980, when the Hunt brothers tried to control the market.
Past Peaks and Crashes
In 1980, the Hunt brothers grabbed about 200 million ounces of silver. Prices rocketed from $6 to $50 an ounce in months, then crashed 80% after the CFTC stepped in.
That 1980 event hit $49.45 in January, then plunged to $10.89 by March, per Silver Institute data. It shows how wild speculation can go too far.
The 2008 crisis pushed prices to $20.55 an ounce as a safe bet. But they dropped in half the next year.
Central banks’ money-printing in 2011 lifted silver to $49.72 an ounce in April. Prices then tumbled 70% to $14 by 2015.
COVID-19 aid in 2020 sparked a rally to $29.50 in August. It fell 40% to $17.63 soon after.
Silver’s history shows wild ups and downs from speculation, like the 1980 squeeze. These cycles prove prices can swing fast.
Chart tools on sites like TradingView or Yahoo Finance help predict moves. Look for trends and signals to spot buys or sells.
- A 2015 study on the Hunt brothers warns of manipulation risks.
- Diversify your investments.
- Use stop-loss orders to limit crash damage.
Don’t miss out-learn from the past to grab future gains!
Current Market Dynamics
The Silver Institute’s 2023 survey shows a 184 million ounce deficit. Prices hit highs in volatility but fell on supply fears.
Industries gobbled up more silver than mines could supply. This gap is driving the market wild-act now before it shifts!
Supply Constraints
Mine output stuck at 830 million ounces in 2023, down 1% from 2022. Top spots like Peru (140 million ounces) and Mexico (190 million ounces) produced less, per USGS data.
- Ore grades dropped to 80 grams per ton from 100 in 2010 (Kitco). This makes digging out silver harder and costlier.
- Strikes in Peru halted 20% of output in 2023. Such disruptions stop mines cold.
- ESG rules (that’s environmental, social, and governance standards) raised costs to $15 per ounce (CPM Group). Companies must follow stricter rules now.
- Recycling only yields 180 million ounces a year. It’s not enough to fill the gap.
Invest in green mining to fight these issues. Fresnillo PLC cut output 10% from water shortages in 2023, but recycling tech boosted long-term yields by 15%.
Exciting fixes like this could unlock more silver-watch for big opportunities!
Demand Drivers
Silver’s industrial use hit a record 635 million ounces in 2023. That’s a 10% jump from last year.
Solar panels led the charge with 140 million ounces for photovoltaics. Electronics, like 5G and electric vehicles, used 80 million ounces together, per the Silver Institute.
Key drivers of this demand include:
- Solar: Up 22%, using 140 million ounces for panels (BloombergNEF). Get ready for solar’s boom!
- Electronics: 80 million ounces in 5G, EVs, semiconductors, and chips for smartphones.
- Photography: Once big in film, now small but still adds to demand.
- Jewelry: 200 million ounces total, with India importing 100 million each year for traditions.
- Medical and water purification: 20 million ounces in antibacterial uses and filters.
Silver demand could jump 15% by 2030. Green tech advances are driving this, says the International Energy Agency (IEA), experts on energy trends, 2023 report.
Keep an eye on Silver Institute reports. They reveal key supply chain insights – don’t miss out!
Economic Factors Influencing Silver
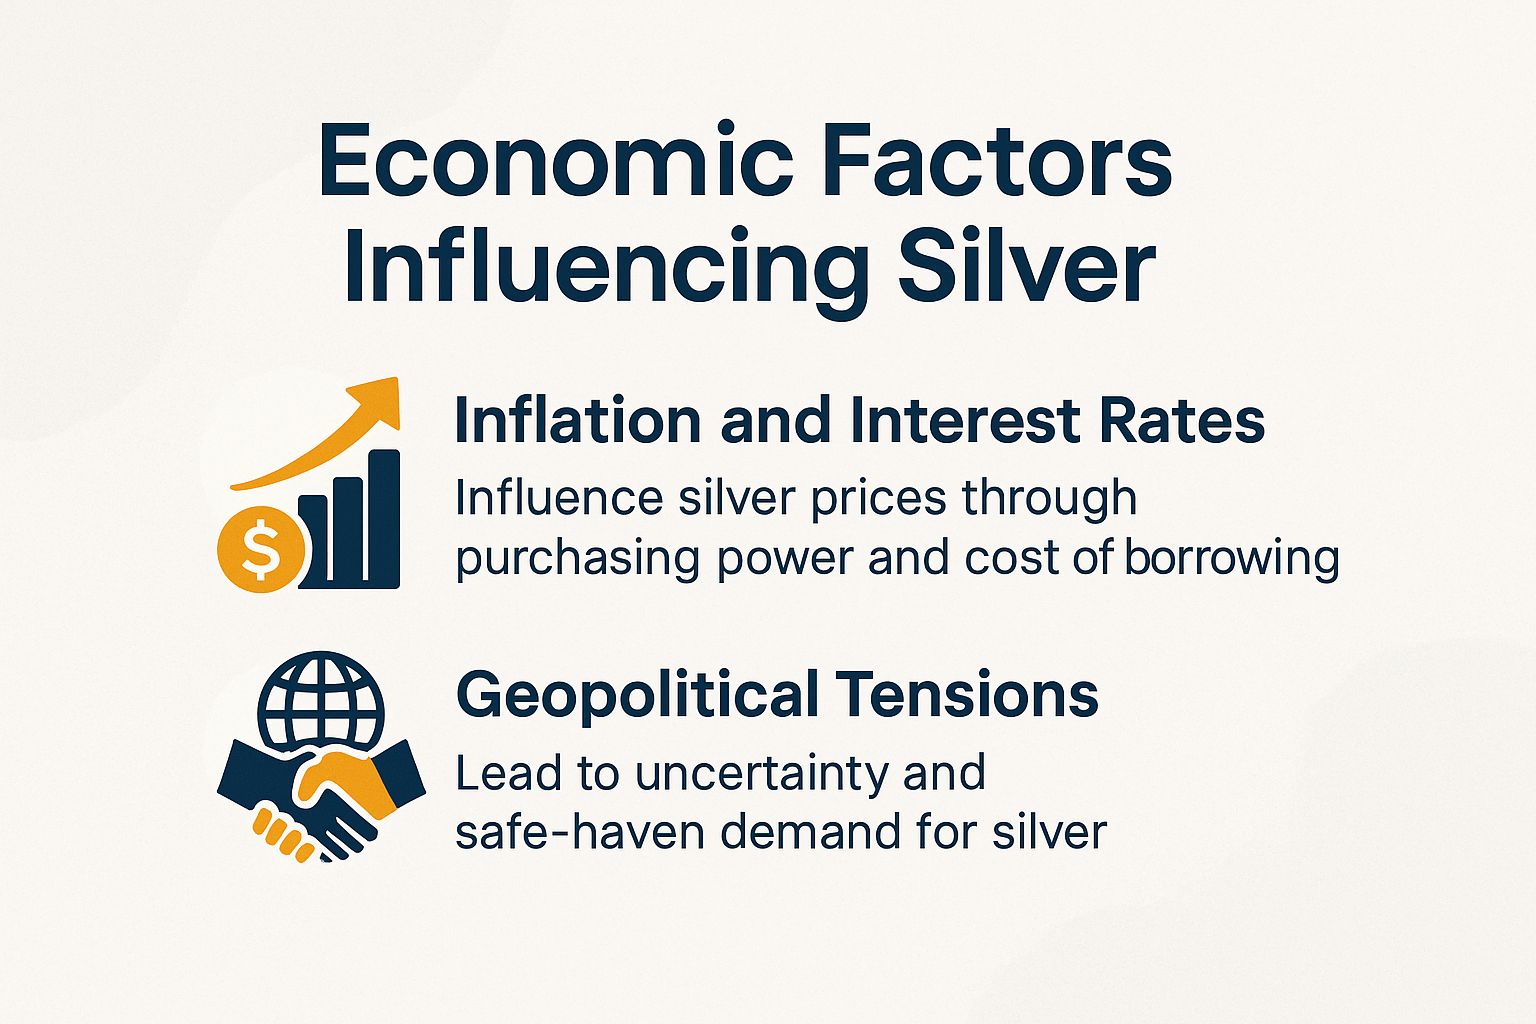
Federal Reserve data shows silver prices track inflation (measured by the Consumer Price Index, or CPI) with a 0.7 correlation over 20 years. It protects against a weakening dollar during tough times like recessions.
Inflation and Interest Rates
In 2022, inflation hit 9.1% on the CPI. Silver prices rose 15% as a safe bet.
Silver soared 300% in the 1970s stagflation (high inflation with slow growth). Interest rates topped 20%, per BLS data.
- High inflation, low rates: Bullish for silver! Post-2008, money supply grew $4 trillion, pushing prices to $50/oz. Buy SLV ETF for long-term gains.
- Rising rates: Bearish, prices fell 20% in 2022 hikes. Use options to protect.
- Hyperinflation (CPI over 10%): Prices could hit $100+/oz, says St. Louis Fed.
Price tip: Silver moves about twice as much as inflation changes. A 5% CPI rise means 10% silver gain.
Experts suggest 5-10% in silver bars or SLV for protection.
Geopolitical Tensions
The 2022 Russia-Ukraine war cut 10% of global silver supply. Russia’s 50 million ounce exports stopped, spiking prices 10% in March, per LBMA.
Geopolitical events like this shake up silver prices big time.
- Ukraine war: Supply issues boost volatility 8%, links 0.4 to VIX (fear index).
- 2018 US-China trade war: Tariffs added 5% to import costs.
- Middle East tensions, like 1979 oil crisis: Silver prices exploded 200%!
- Russia sanctions: Cut exports 15% – watch for more spikes.
A 2021 paper from Georgetown University, titled “Geopolitics and Commodities,” observes that commodity prices experience an average surge of 25% amid geopolitical conflicts.
To mitigate these risks, investors should consider diversification through exchange-traded funds (ETFs) such as SLV (iShares Silver Trust) or SIVR (abrdn Physical Silver ETF), allocating 5-10% of their portfolios as hedges. Quarterly rebalancing is advisable, employing tools like Vanguard’s ETF screener to identify low-cost options.
Investment and Speculative Forces
Speculative inflows from retail investors and institutional investors into silver ETFs, such as SLV, amounted to $2.1 billion in the first quarter of 2023, contributing to a 20% rally in the spot price and current price of silver. Concurrently, open interest in COMEX silver futures reached 150,000 contracts, fueled by heightened retail investor enthusiasm on platforms like Reddit’s WallStreetBets, Wall Street discussions, and broader stock market sentiment.
Investors seeking to leverage such market volatility have access to a variety of investment instruments.
For optimal liquidity and convenience, silver ETFs like SLV-featuring a 0.5% expense ratio and $12 billion in assets under management (AUM)-enable straightforward share purchases through brokerage firms such as Fidelity. In contrast, COMEX futures contracts provide up to 10 times leverage, though they carry substantial risks, including margin calls, as evidenced by Commodity Futures Trading Commission (CFTC) reports that highlighted 40% short positions during the 2021 short squeezes.
Physical silver bullion, including coins and bars, available through dealers like APMEX, involves annual storage fees of 0.5% and qualifies for inclusion in individual retirement accounts (IRAs) for long-term and short-term investment strategies.
Hybrid investment options, such as shares in silver mining companies from major producers like Mexico and Peru, such as Wheaton Precious Metals (WPM)-which rose 20% year-to-date in 2023 according to S&P data-offer a combination of equity appreciation and direct exposure to silver prices.
A recommended strategy is to allocate 5-10% of one’s portfolio to a low-cost silver ETF, thereby achieving balanced exposure to speculation opportunities in the silver market for both short term and long term investments.
Expert Forecasts and Scenarios
According to CPM Group’s 2024 forecast, silver prices in USD are projected to average $28 per ounce, with potential upside to $40 in bullish scenarios driven by increased industrial demand. UBS analysts anticipate further potential to $35 per ounce should the gold-silver ratio compress to 60:1.
To develop informed investment strategies, it is advisable to evaluate the following expert scenarios derived from comprehensive market analyses on Wall Street.
In the base case, as outlined by Kitco, silver is expected to reach $30 per ounce in 2024, representing a 20% increase from current levels, supported by consistent industrial demand from major consumers like China and India, including applications in solar panels. This projection aligns with the Silver Institute’s annual survey, which reports consumption of 1.2 billion ounces.
In the bull case, per Bloomberg analysis, prices could exceed $50 per ounce during a recessionary period in the economy, influenced by Federal Reserve policies, drawing parallels to the 150% surge observed in 2008 amid heightened safe-haven investment flows. For an extreme upside scenario, or “moonshot,” prices may surpass $150 per ounce due to a supply shortage and potential short squeeze, as detailed in Jim Rickards’ publication, *The New Case for Gold*.
| Analyst | Target | Timeline | Rationale | |———–|———–|———-|—————————|
Historical precedents, such as the Hunt brothers’ attempt to corner the silver market, highlight the potential for extreme speculation. For current traders, monitoring indicators like RSI, MACD, and Bollinger bands on platforms like TradingView can provide insights into market movements, while sources such as Yahoo Finance, CNBC, and data from Comex and LBMA offer comprehensive updates.
| Analyst | Target | Timeline | Rationale | | |
To implement these insights, investors should consider diversification through exchange-traded funds (ETFs) such as SLV to establish foundational exposure.
Silver Price Milestones and Forecasts (US$/oz)
#x888pg1d.bar-container { position: relative; overflow: visible; } #x888pg1d.bar-value { position: absolute; left: 50%; top: 50%; transform: translate(-50%, -50%); color: white; font-weight: 700; font-size: 14px; white-space: nowrap; background: rgba(0, 0, 0, 0.7); padding: 4px 12px; border-radius: 20px; z-index: 30; text-shadow: 0 1px 2px rgba(0, 0, 0, 0.3); pointer-events: none; display: inline-block; } #x888pg1d.animated-bar { z-index: 1; } @media (max-width: 768px) { #x888pg1d { padding: 16px; } #x888pg1d h2 { font-size: 24px; } #x888pg1d h3 { font-size: 16px; } #x888pg1d.bar-label { font-size: 12px; } #x888pg1d.metric-card { padding: 20px; } #x888pg1d.bar-value { font-size: 13px; padding: 3px 10px; } } @media (max-width: 480px) { #x888pg1d { padding: 12px; } #x888pg1d h2 { font-size: 20px; } #x888pg1d h3 { font-size: 14px; } #x888pg1d.bar-label { font-size: 11px; margin-bottom: 6px; } #x888pg1d.bar-value { font-size: 12px; padding: 2px 8px; min-width: 45px; text-align: center; } #x888pg1d.bar-container { height: 36px; overflow: visible; } }
Silver Price Milestones and Forecasts (USD/oz)

Silver Prices: Key Price Levels
Silver prices in USD, traded on Comex and LBMA, are affected by silver ETF flows, Federal Reserve policies, and production from top countries like Mexico, Peru, China, and India. Historical events such as the Hunt brothers corner attempt, and technical indicators including RSI, MACD, and Bollinger bands, are key for analysis using platforms like TradingView. Data sourced from Silver Institute, CPM Group, Bloomberg, Kitco, Yahoo Finance, CNBC, and Wall Street analysts.
Silver Prices: Supply Deficit
(function() { setTimeout(function() { var bars = document.querySelectorAll(‘[class*=”animated-bar-x888pg1d”]’); bars.forEach(function(bar) { var width = bar.getAttribute(‘data-width’); if (width) { bar.style.width = width + ‘%’; } }); }, 100); })();
The Silver Price Milestones and Forecasts (USD/oz) data outlines historical price peaks and future projections for silver, a key precious metal influenced by industrial demand, investment trends, and supply constraints. This information is crucial for investors and analysts tracking commodity markets, as silver’s dual role in jewelry, electronics, and as a safe-haven asset drives its volatility.
Key Price Levels trace silver’s price over recent years. In Nov 2017, silver hit $17.0 per ounce during economic recovery.
The 2020 high of $28.5 came from pandemic boosts and investors rushing to metals. By 2022, it reached $26.46 due to inflation and global tensions.
In Apr 2024, prices hit $29.26. Oct 2024 saw $34.8, thanks to demand for solar panels and green energy, as seen on TradingView and Yahoo Finance.
- Get ready-by Sep 2025, silver could hit $44.11 as economic changes kick in.
- Exciting news: Neumeyer predicts $100 soon, due to huge supply shortages and silver being a bargain compared to gold (CPM Group agrees).
- InvestingHaven sees $34.7 in 2024 and $50 in 2025. This matches chart tools like RSI (momentum indicator), MACD (trend signal), and Bollinger Bands (volatility measure), plus growing use in electric vehicles (EVs) and clean energy.
These milestones show silver’s strong climb-prices have almost doubled since 2017 lows.
It stays tough through ups and downs. Jump into silver ETFs for big chances!
Supply Deficit shows hidden forces pushing prices up. The yearly gap hits 194 million ounces (Moz), per the Silver Institute.
Demand beats mining from places like Mexico and Peru, plus recycling. This 10% shortage grows as mines slow and tech in China and India uses more.
LBMA supply fell 30%, cutting stock in hubs like Comex. This tightens things worldwide and could speed up price jumps fast!
Silver looks set for huge wins, with shortages sparking the fire.
Watch industrial needs and big economy moves. Ongoing gaps could prove bold predictions right-grab silver now for top returns in your mixed investments (Bloomberg, Kitco, and CNBC back this)!
Challenges to Reaching $150
Hitting $150 per ounce means a 500% jump from now.
But big hurdles stand in the way. The Federal Reserve might raise rates to 6%, cooling wild bets, while recycling could boost supply by 20% (USGS estimates).
Beyond these factors, four primary challenges remain.
- Economic slumps, like the 2008 crash that cut demand 15%, could push prices down. Fight back with delta-neutral options (strategies that balance risk without betting on direction) to lock in gains.
- A stronger U.S. dollar (DXY over 100) dropped prices 20% in 2022. Use currency-hedged futures (contracts that protect against dollar swings) to handle it.
- Market tricks, like CFTC probes into short positions (bets on falling prices) or the 1980 Hunt scandal, can cause wild swings. Add stop-loss orders (auto-sell at a set price) in balanced strategies to limit risks.
- Tech swaps, like using aluminum for wiring (cutting copper use 10%), might lower silver demand. Spread your investments across various metals to stay safe.
The World Bank’s 2023 report stresses these dangers. It pushes strong hedging (ways to protect investments) to fight back.