How Rising Interest Rates Affect Gold Prices
Economic uncertainty makes rising interest rates a big challenge for gold prices. They question gold’s role as a safe investment.
The Federal Reserve raises rates to fight inflation. This strengthens the U.S. Dollar and raises costs for holding gold.
This guide explains how it works, with history and economic factors. Get ready for gold’s moves in shaky markets as of October 2024!
Fundamentals of Interest Rates

Interest rates, established by the Federal Reserve and other central banks, function as a primary instrument for regulating economic activity. They directly impact borrowing costs and investment decisions across global financial markets.
What Drives Rising Rates?
Central banks raise interest rates to fight inflation. For example, this happened in the 1970s during high inflation and slow growth.
From 2022 to 2023, the Federal Reserve hiked rates by 5.25% (that’s 525 basis points, or 0.01% each). They did this because the Consumer Price Index (CPI), a measure of price changes, hit 9.1%.
The principal drivers encompass the following:
- **Inflationary Pressures**: Inflation from supply chain issues added 2-3% to prices, per IMF’s 2023 report. Governments can help with subsidies on basics.
- **Economic Overheating**: Strong GDP growth over 3% often leads to rate hikes. The U.S. saw 4.9% growth in Q3 2023, so the Fed stepped in to cool things down.
- **Labor Market Constraints**: Low unemployment under 4% can push up wages and inflation. Central banks tighten policy to avoid stagflation. But too much tightening risks recession, like in 2008.
Changes from monetary policy show up 3-6 months later. Stay alert and watch closely.
People often ignore global factors, like oil supply changes from BRICS countries (that’s Brazil, Russia, India, China, South Africa, and others like Turkey). These worsened U.S. inflation in 2022.
Economic Implications
Higher rates slow the economy by 1-2% each year and tame inflation. But watch out-they can lead to falling prices, like Japan’s tough 1990s era.
A 2024 OECD study shows clear numbers from growth predictions. Every 1% rate hike (100 basis points, or 0.01% each) cuts GDP, the total value of goods and services, by 0.5%.
The principal implications encompass:
- Diminished consumer spending, evidenced by mortgage rates reaching 7%, which reduce housing starts by 20% (U.S. Census Bureau data).
- A deceleration in corporate investment, with capital expenditures declining by 15% due to elevated borrowing costs (McKinsey Global Institute).
- Elevated risks of recession, as inverted yield curves have historically anticipated major downturns, including the 2008 financial crisis and the 2020 economic contraction (Federal Reserve analysis).
Track the ISM Manufacturing Index now for signs of slowdown. Diversified portfolios have earned 8% returns in tough times, per Vanguard-don’t miss out!
Gold as a Safe-Haven Asset
Gold has historically been regarded as a safe-haven asset.
The World Gold Council says gold kept 90% of its value over 50 years. It shines during wild markets and global tensions!
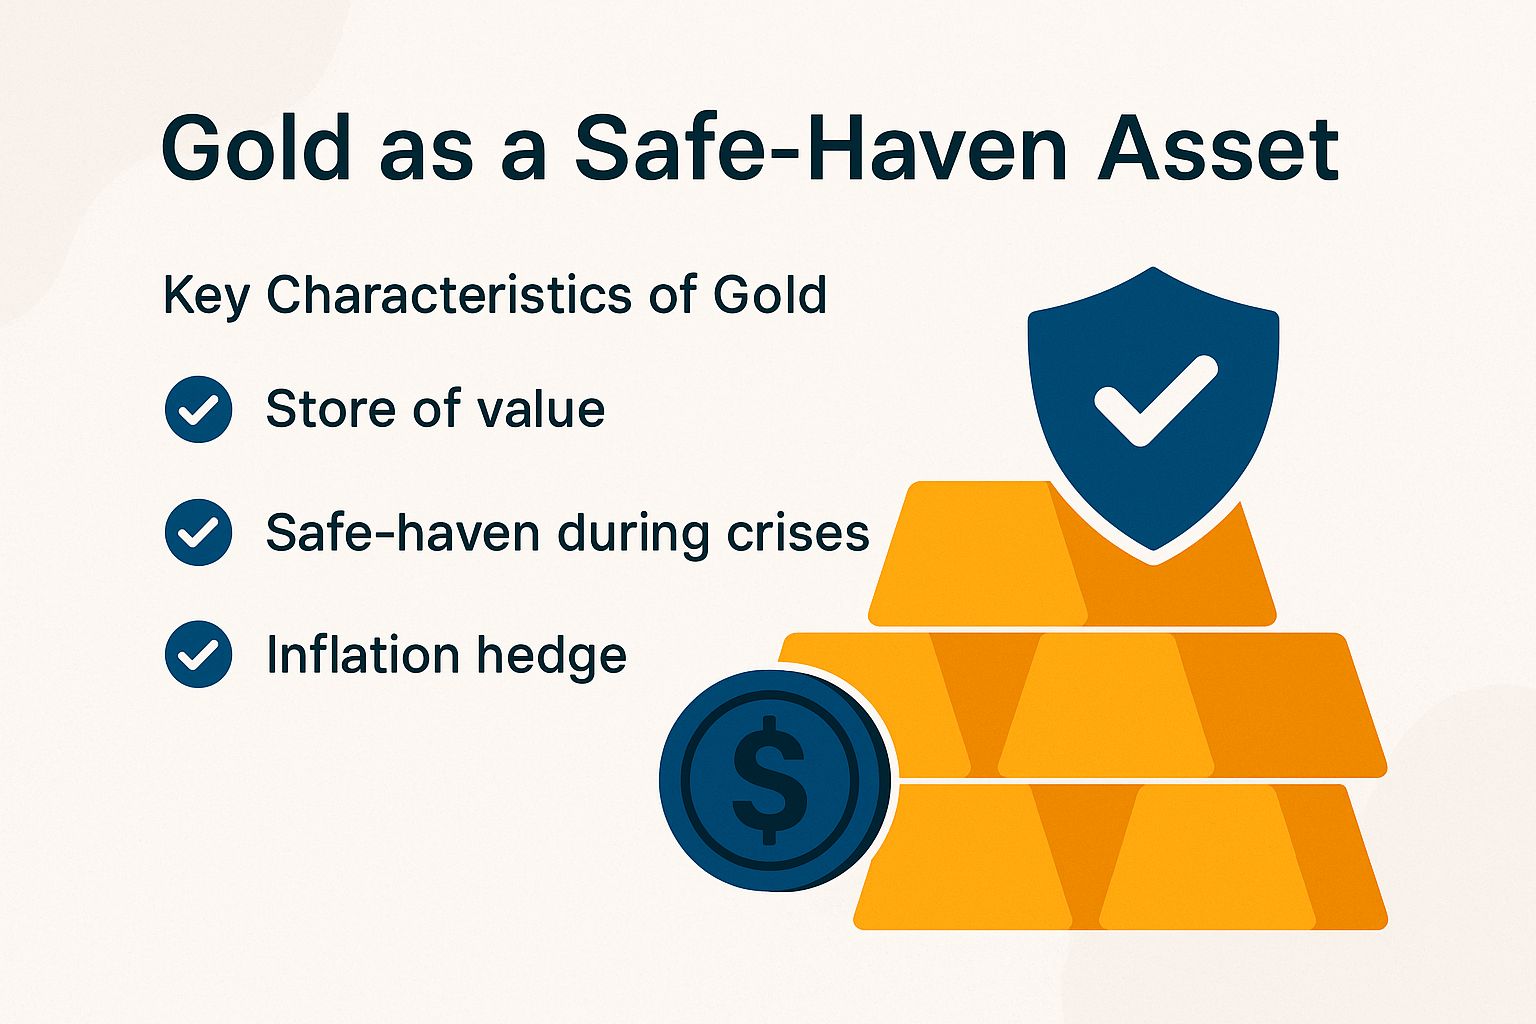
Key Characteristics of Gold
Gold stands out as a precious metal, much like silver. Its history dates back to Lydian electrum coins in the 7th century BC.
Gold’s value comes from its scarcity-only about 3,000 metric tons produced yearly worldwide-and its resistance to corrosion. These traits make it ideal for jewelry, which takes up half of all demand, especially in China and India. It also shines in electronics, using around 7% of total supply.
As an investment, gold delivers real value. Prices use troy ounces since 1828 for smooth global trades. You can trade it 24/7 on spots like COMEX, making buys and sells super easy.
Gold helps diversify your portfolio. It shows low ties to stocks-around 0.1 correlation per Vanguard-acting as a shield in market drops. You can hold it physically as bullion, unlike digital or paper assets.
Gold protects against inflation. Its price jumped 400% since 2000, says the World Gold Council. In shaky times like 2022, gold ETFs pulled in over $10 billion, proving it’s a top safe haven. Don’t miss this powerhouse!
Experts suggest putting 5-10% of your portfolio into gold. Use easy options like GLD ETFs with just 0.4% fees. Skip storage hassles-$50 per ounce a year-and save big! Start now to beat those costs!
Why Interest Rates and Gold Move Oppositely
Interest rates and gold prices often move in opposite directions. Gold earns no interest, unlike bonds. Data shows a -0.65 correlation-meaning strong negative link-from 1971 to 2024, per World Gold Council.
Think of it this way: Gold’s draw = 1 divided by (real interest rates plus inflation extra). Higher rates or inflation make bonds look better since they pay you back.
Charts show this clearly: Federal rates up, gold down. In 2018, rates rose 2%, gold fell 5%. But in COVID-19, negative yields of -1.5% boosted gold by 25%!
Track real yields on sites like St. Louis Fed’s database. Buy gold when they go negative for the best timing.
Uncertainty amps this up. A 2022 study by Diba and Gross shows it clearly in volatile markets.
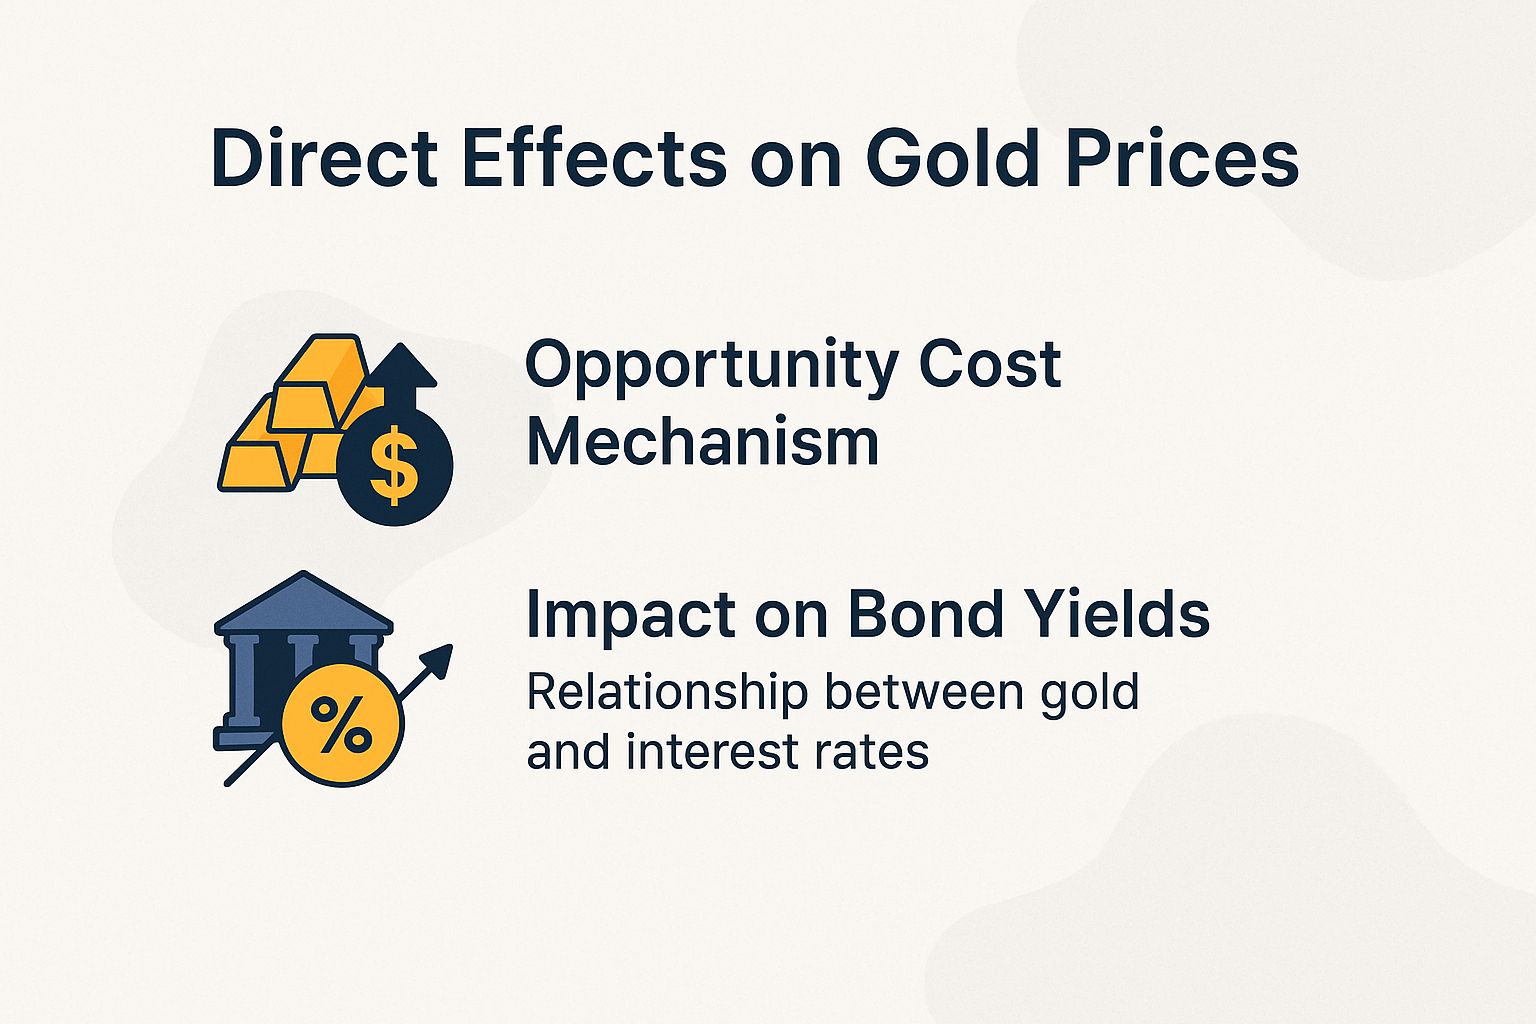
Direct Effects on Gold Prices
Rising rates push gold prices down. They make paying assets like bonds more appealing. Past trends: 1% rate hike means 5-10% gold drop.
How Opportunity Cost Hits Gold
When rates rise, gold loses shine. Investors pick bonds paying 4-5% over gold that pays nothing.
From 2015-2018, gold dropped 15% as rates normalized.
To quantify this opportunity cost, adhere to the following methodology:
- Calculate real yield: Subtract inflation from nominal rate. Example: 5% rate minus 2% inflation = 3% real yield.
- Compare to gold’s average 7% long-term return. Bonds might beat it in calm markets.
- Add gold’s storage costs-about 0.5% yearly for vaults.
Many investors ignore how inflation eats away at returns. A 2021 Journal of Finance study shows it can cut them by 8% each year.
Fight back by comparing gold to Treasury Inflation-Protected Securities (TIPS). TIPS are bonds that rise with inflation to shield against rising prices and offer 1-2% real yields, protecting your money better than gold alone.
Impact on Bond Yields
Rising bond yields, like the U.S. 10-year Treasury hitting 5% in 2023, steal the spotlight from gold. They pull money away, causing gold prices to drop up to 12% in similar past periods – act fast to protect your investments!
An inverted yield curve happens when short-term rates beat long-term ones, signaling economic trouble. This boosts gold’s role as a safe haven – get excited, it’s your chance to shine in uncertain times!
Look at 2019: The yield curve inverted, and gold prices jumped 25% by mid-2020, per Federal Reserve data. Track the yield spread on tools like TradingView to stay ahead – don’t miss the next rally!
Gold exchange-traded funds (ETFs) are funds that track gold prices without buying physical gold.
- Put 5-10% of your portfolio into gold ETFs to fight rising yields.
- The SPDR Gold Shares (GLD) ETF climbed 18% in 2023 despite early dips, says a 2024 Bloomberg report – jump in now!
Adjust your portfolio based on how deep the yield curve inverts. Position yourself now for the best gains!
| Scenario | Yield Change | Gold Price Reaction | Example |
|---|---|---|---|
| Rising Yields | +200bps | -20% | 2004-2006 |
| Inverted Curve | -50bps spread | +25% | 2019-2020 |
| Yield Spike | +150bps | -12% | 2023 |
Indirect Effects Through the Economy

Interest rates affect gold prices indirectly through the economy.
They influence currency values and inflation outlooks, ramping up market ups and downs. Stay alert – volatility means big opportunities!
Currency Strength and USD
High interest rates strengthen the U.S. dollar, pushing gold prices down since gold is priced in dollars. The DXY index (a measure of dollar strength) rose 10% in 2022, and gold fell 5% – watch this closely!
This relationship is driven by several critical factors:
- Fed rate hikes pull in foreign money – $500 billion to U.S. assets in 2023, per IMF – boosting the dollar.
- This cuts demand elsewhere; China and India imported 15% less gold when the dollar strengthened (World Gold Council).
- International buyers face higher hedging costs, making gold pricier in their currencies.
A 2023 Bank for International Settlements survey shows dollar-tied portfolios lost 8% returns. Diversify to gain 12% instead – diversify now for better results!
Influence on Inflation Expectations
Rate hikes cool inflation expectations, weakening gold’s hedge appeal.
But uncertainty keeps demand alive. October 2024 forecasts see CPI (a key inflation measure) at 2.5-3%, especially in BRICS countries like Brazil and India.
University of Michigan surveys show inflation expectations dropped from 5.4% to 2.7% after rate hikes. This steadies views but makes gold less appealing – shift strategies quickly!
Key factors influencing this dynamic include:
- Stable inflation expectations cut gold’s premium, unlike the 1970s when 10% inflation skyrocketed gold 400% – learn from history!
- Disinflation risks push investors to bonds for yields, not gold.
A 2022 study from the European Central Bank shows gold’s beta at 0.8 against unexpected inflation jumps. This means gold moves with inflation but stays volatile.
Investors, keep an eye on the Breakeven Inflation Rate. You can find it using Treasury Inflation-Protected Securities (TIPS) yields on Treasury.gov.
Check the Federal Reserve’s Dot Plot for future trends. It helps spot policy shifts early.
Historical Case Studies
Gold’s story starts in the 7th century BC with Lydian electrum coins as early money.
Key events like the 1971 end of the Bretton Woods system show how interest rates affect gold in tough times.
- 1970s Stagflation: Oil shocks pushed Fed rates to 20%. Gold rocketed 2,300% as banks bought in.
- 2008 Crisis: Rates hit 0%. Gold gained 25% in 2009 with $200B in ETF inflows.
- COVID-19: Negative yields sent gold to $2,070, up 40%. Central bank purchases doubled.
Add gold to your portfolio now as an inflation shield before crises hit.
Aim for 5-10% allocation. Watch Fed signals closely to jump in at the right time-act fast!
Gold Price Performance During Interest Rate Cycles
#wo3cjij9.bar-container { position: relative; overflow: visible!important; } #wo3cjij9.bar-value { position: absolute!important; left: 50%!important; top: 50%!important; transform: translate(-50%, -50%)!important; color: white!important; font-weight: 700!important; font-size: 14px!important; white-space: nowrap!important; background: rgba(0, 0, 0, 0.7)!important; padding: 4px 12px!important; border-radius: 20px!important; z-index: 30!important; text-shadow: 0 1px 2px rgba(0, 0, 0, 0.3)!important; pointer-events: none!important; display: inline-block!important; } #wo3cjij9.animated-bar { z-index: 1!important; } @media (max-width: 768px) { #wo3cjij9 { padding: 16px!important; } #wo3cjij9 h2 { font-size: 24px!important; } #wo3cjij9 h3 { font-size: 16px!important; } #wo3cjij9.bar-label { font-size: 12px!important; } #wo3cjij9.metric-card { padding: 20px!important; } #wo3cjij9.bar-value { font-size: 13px!important; padding: 3px 10px!important; } } @media (max-width: 480px) { #wo3cjij9 { padding: 12px!important; } #wo3cjij9 h2 { font-size: 20px!important; } #wo3cjij9 h3 { font-size: 14px!important; } #wo3cjij9.bar-label { font-size: 11px!important; margin-bottom: 6px!important; } #wo3cjij9.bar-value { font-size: 12px!important; padding: 2px 8px!important; min-width: 45px!important; text-align: center!important; } #wo3cjij9.bar-container { height: 36px!important; overflow: visible!important; } }
Gold Price Performance During Federal Reserve Interest Rate Cycles and U.S. Dollar Fluctuations
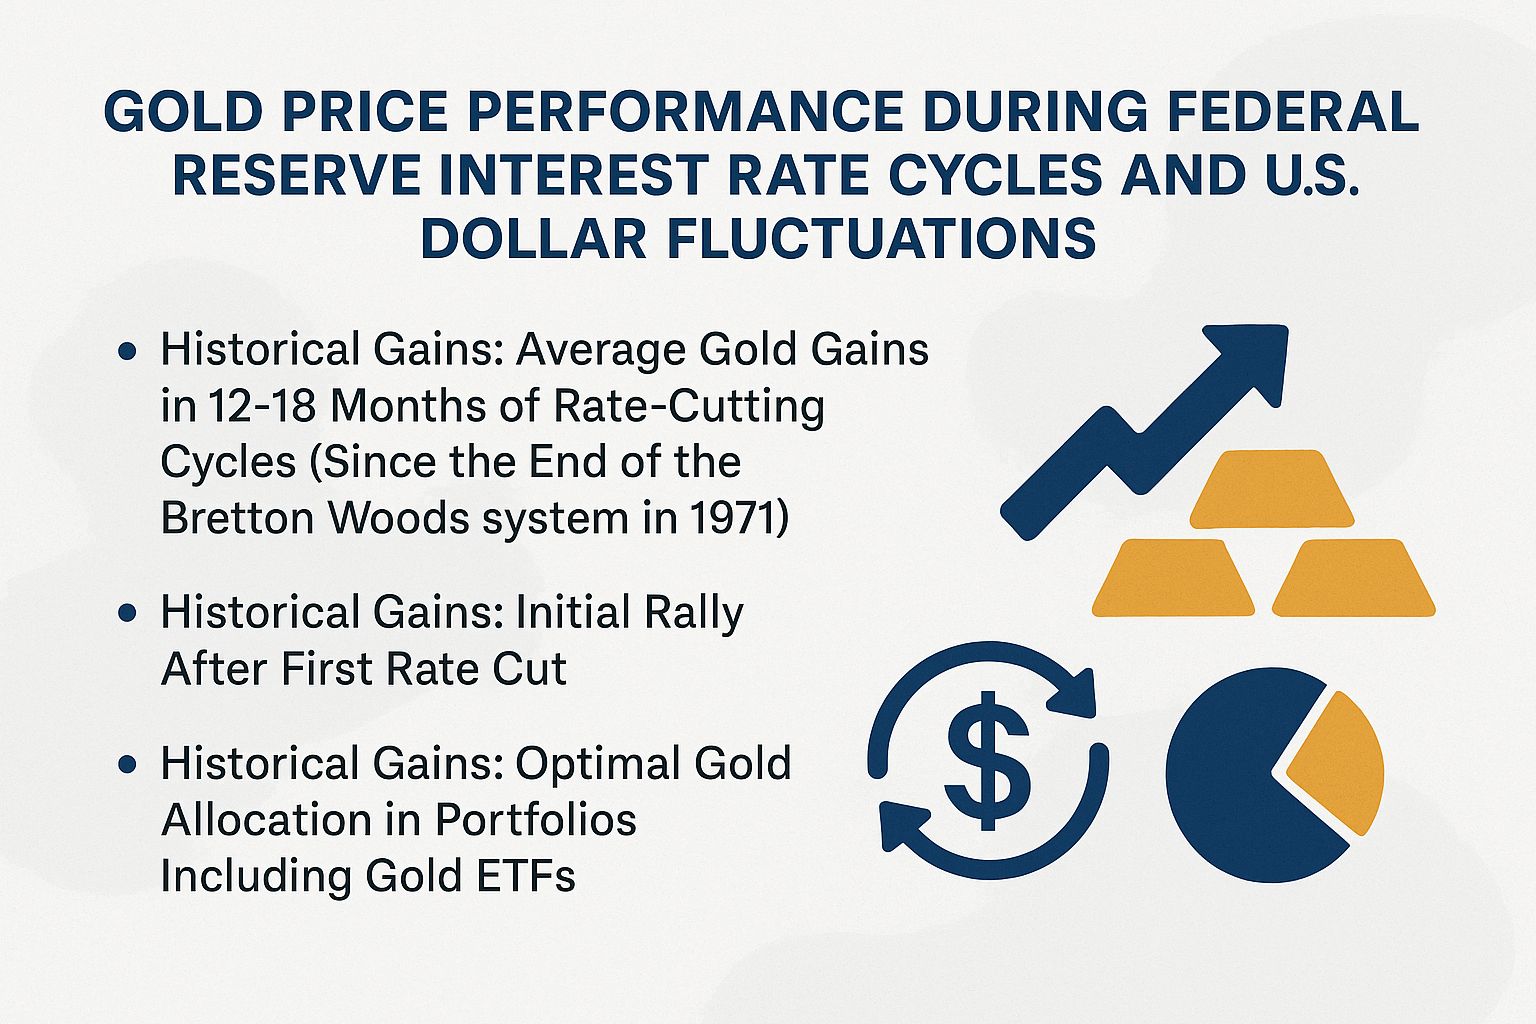
As central banks, including the Federal Reserve, adjust policies, gold acts as a hedge against the U.S. Dollar. Major purchasers such as China, India, Russia, and Turkey-key BRICS nations-have boosted reserves, per the World Gold Council, especially amid the Covid-19 pandemic.
Historical Gains: Average Gold Gains in 12-18 Months of Rate-Cutting Cycles (Since the End of the Bretton Woods system in 1971)
Historical Gains: Initial Rally After First Rate Cut
Historical Gains: Optimal Gold Allocation in Portfolios Including Gold ETFs
(function() { setTimeout(function() { var bars = document.querySelectorAll(‘[class*=”animated-bar-wo3cjij9″]’); bars.forEach(function(bar) { var width = bar.getAttribute(‘data-width’); if (width) { bar.style.width = width + ‘%’; } }); }, 100); })();
Gold has a long history. People first used it as currency in Lydian electrum coins during the 7th century BC.
The Gold Price Performance During Interest Rate Cycles dataset gives key insights. It shows how gold prices react when central banks cut rates to fight economic slowdowns.
Since 1970, after the end of the Bretton Woods system-an old international money agreement that fixed currencies to the dollar and gold-gold has acted as a solid hedge against uncertainty. Lower interest rates cut the appeal of bonds or savings, so gold often rises as the U.S. Dollar weakens.
Historical Gains show steady upward trends in rate-cutting cycles. Gold averages 20% to 30% gains in the 12-18 months after cuts.
This range varies based on inflation, geopolitical tensions, and global economy. In big easing periods like after the 2008 crisis or the Covid-19 pandemic, gold can hit the high end. It protects against inflation and diversifies when stocks drop. Imagine your portfolio boosting by up to 30%-gold delivers in tough times!
- Initial Rally After First Rate Cut: Gold prices jump fast! Per troy ounce-a unit for precious metals-expect a 5% to 10% surge right after. This shows investors trust gold as a safe haven when easing starts, shifting money from interest-bearing assets.
- Optimal Gold Allocation in Portfolios: Add 5% to 10% gold now for these cycles. Conservative folks go low for stability; aggressive ones aim higher for big returns in chaos. Gold’s opposite move to stocks cuts your overall risk-don’t miss this diversification edge!
These metrics highlight gold’s key role in strategies during rate changes. Watch Fed signals to position smartly and grab those decade-proven patterns.
Remember, past results don’t promise future wins. Mix gold with full market analysis for smart choices in fast-changing scenes.
Other Influencing Factors
Interest rates matter, but other forces drive gold too. Geopolitical instability and central bank buys-especially from China, Russia, and Turkey, who added 1,000 tons in 2023-boost demand and counter rising rate pressures.
The principal factors influencing gold prices are as follows:
- Geopolitical risks: Ukraine’s crisis spiked prices 10%. Stay alert with Reuters for the next jump!
- Central bank reserves: BRICS nations grew holdings 20%, per World Gold Council.
- Supply constraints: Mine output stays flat at 3,500 tons yearly, says USGS. Tight supply means higher prices!
- Gold ETF flows: SPDR Gold Shares (GLD) hit $60 billion in October 2024.
- Jewelry and industrial demand: India takes 25% of the world market.
- Correlation with silver: Silver often climbs 15% with gold. Use it as your quick check!
Track live prices on Kitco and use GFMS reports to predict moves. Geopolitical hedges brought 18% returns in 2022-act now to capture similar wins!