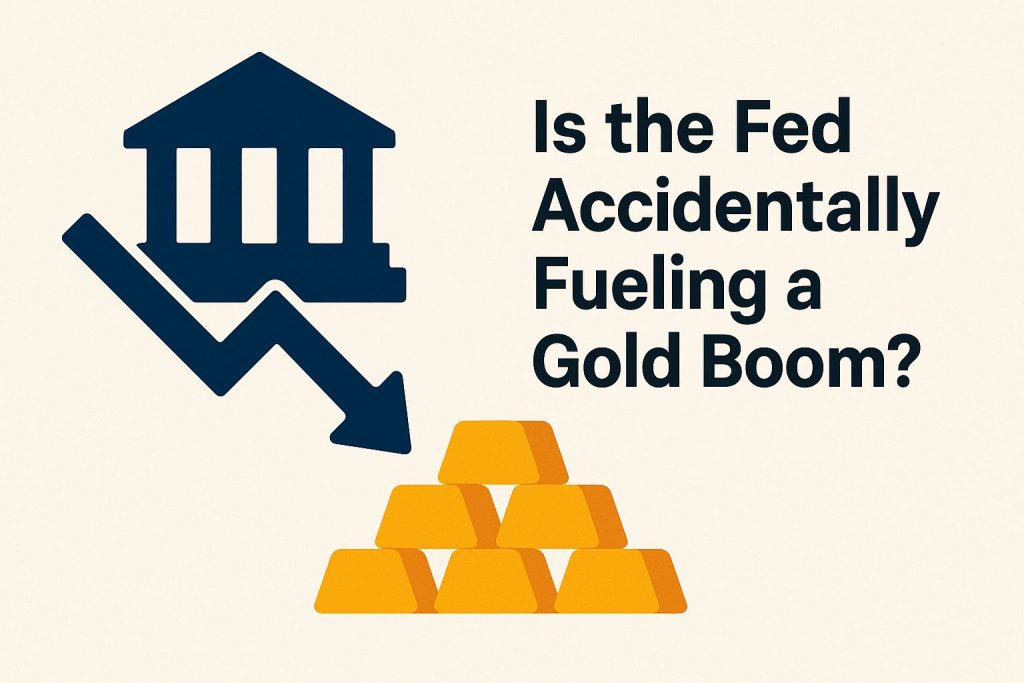
As gold prices shatter records amid economic uncertainty, a provocative question emerges: Is the Federal Reserve unwittingly igniting this bull run?
Gold prices are breaking records in this shaky economy. Is the Federal Reserve accidentally sparking this gold rush?
The Fed’s bold moves to boost growth are weakening the dollar and raising inflation worries. This makes gold the go-to safe bet.
Let’s dive into how interest rates work and how quantitative easing (QE, a tool where the Fed buys bonds to pump money into the economy) might be accidentally boosting gold.
We’ll look at history, like the 1970s gold boom, today’s market signs, what experts say, and what it means for you. Get ready-big opportunities or risks could be ahead!
Overview of Federal Reserve Policies
The Federal Reserve started in 1913. It uses tools like changing interest rates and quantitative easing (QE)-buying bonds to add money to the economy-to keep things stable.
Chair Jerome Powell led the Federal Open Market Committee (FOMC, the Fed’s key decision group) in 2022. They aimed for 2% inflation using the Personal Consumption Expenditures (PCE) index, a measure of price changes.
The Fed has two main jobs: full employment and steady prices. They target 2% inflation over the long haul, as stated on federalreserve.gov.
The Fed uses open market operations to meet its goals.
They bought $80 billion in Treasury securities monthly in 2021. This cut long-term rates and boosted cash flow.
- Discount rate: Dropped to 0.25% in March 2020 to help banks lend during COVID-19.
The M2 money supply jumped 25% in 2020, per St. Louis Fed data. This fueled recovery. Past actions, like QE after 2008, sparked a thrilling 3.4% GDP rebound-proving these tools pack a punch!
Gold’s Role in Modern Portfolios
Gold acts as a safe haven in tough times. Experts at Vanguard suggest holding 5-10% of your portfolio in gold for balance.
During the 2008 crisis, gold beat stocks by 8%, says Morningstar. The VIX (a fear gauge for markets) hit 80-gold shone when stocks tanked!
Try a classic 60% stocks, 40% bonds mix. Add 7% gold via the SPDR Gold Shares ETF (GLD) to spread risk.
This setup cuts losses and grabs gold’s perks as a diversifier.
Ray Dalio’s team at Bridgewater made 12% in volatile 2022 by adding gold. Smart move!
CFA research shows gold barely moves with stocks (correlation of -0.3). It can slash losses by 15% in downturns.
Ready to add gold? Follow these easy steps:
- Check your risk level with FINRA’s free tools.
- Buy GLD ETF shares or physical gold-at about $1,900 per ounce in 2023.
- Rebalance every quarter to stay on track. Don’t miss out!
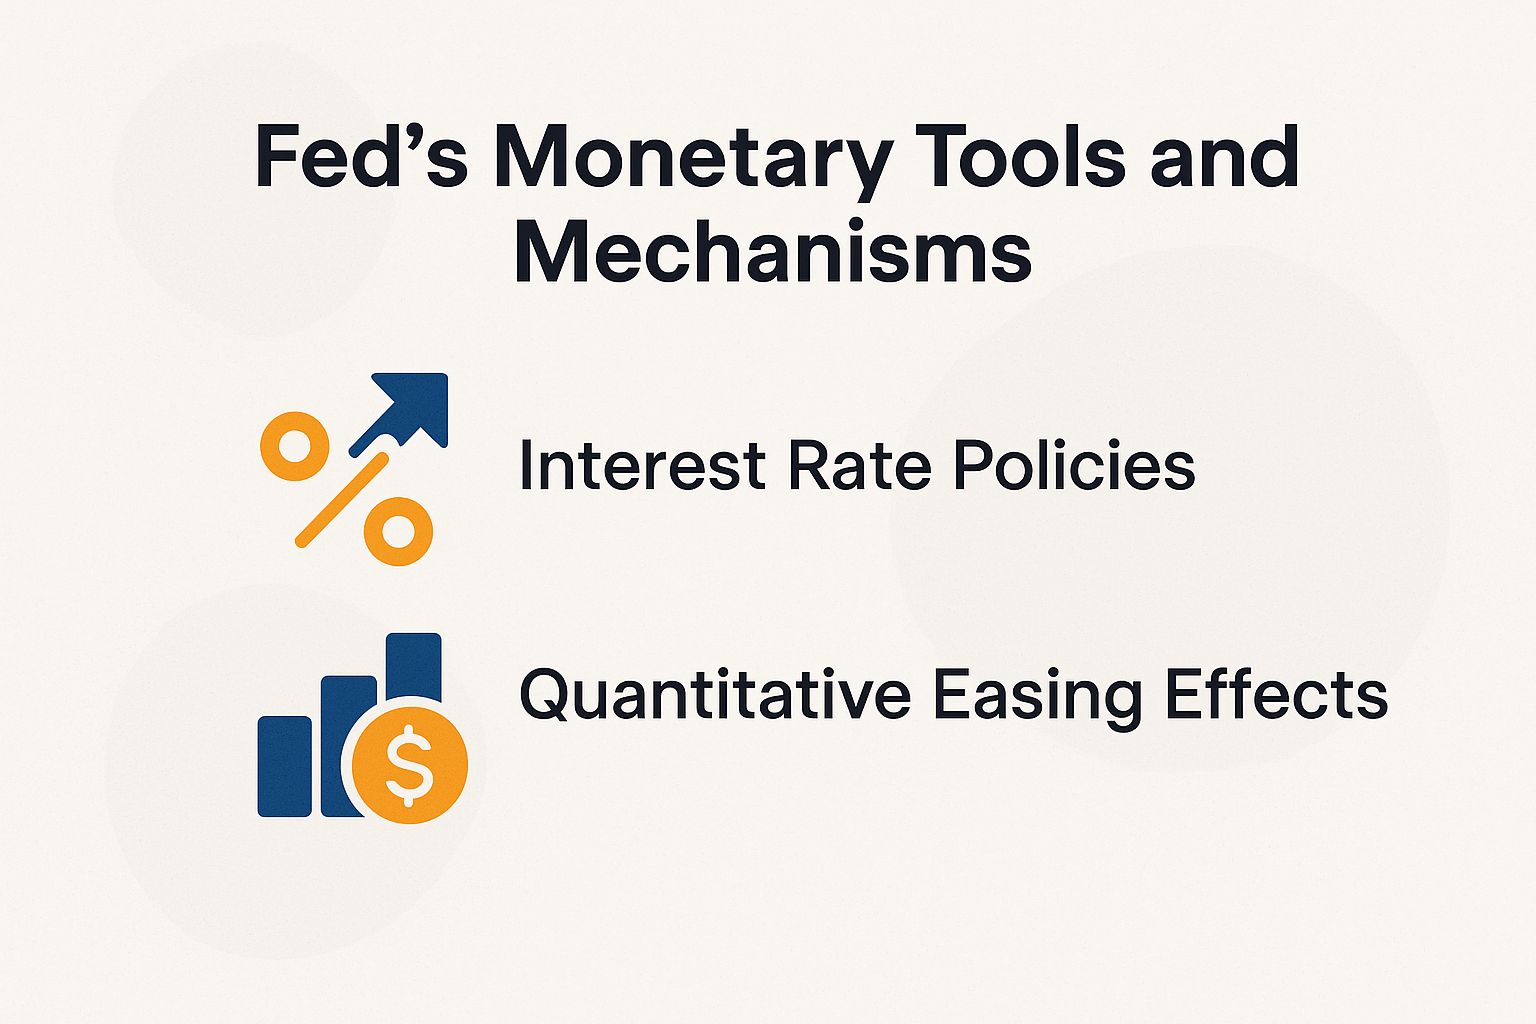
Fed’s Monetary Tools and Mechanisms
Post-2008, the Fed supercharged its tools: interest rates and QE. Their balance sheet ballooned from $900 billion to $8.9 trillion by 2022.
This flooded the economy with cash, per IMF reports. It shook up liquidity and prices-gold lovers, take note!
Interest Rate Policies
In March 2020, the Fed slashed the federal funds rate to 0-0.25%. This sparked huge stimulus.
Treasury yields dropped to 0.5%, boosting borrowing fast-check the U.S. Treasury data!
The FOMC (Fed’s key decision group) slashed rates in emergency meetings during the COVID-19 crisis. They used open market operations (buying/selling bonds) through the New York Fed to lower the federal funds rate (what banks charge each other).
This sparked a drop in 30-year mortgage rates from 3.7% to 2.65% by August 2020, per Freddie Mac. It fueled $1.7 trillion in new home loans, says the Mortgage Bankers Association-homebuyers, what a game-changer!
Keep a close eye on Fed policies with tools like the Bloomberg Terminal. Watch 10-year Treasury yields-if they top 4%, rate hikes could be coming fast, so adjust your strategy now!
In speeches delivered in 2023, Federal Reserve Chair Jerome Powell provided forward guidance that underscored the importance of maintaining low interest rates to support economic recovery, a strategy distinct from the balance sheet expansion associated with quantitative easing.
Quantitative Easing Effects
Get ready to dive into Quantitative Easing (QE)-the Fed’s bold move from 2008 to 2014. They snapped up $4.5 trillion in assets to pump cash into the economy.
This flood of money supercharged markets but also puffed up asset bubbles. Check out how the S&P 500 index skyrocketed 200%, per Federal Reserve Economic Data (FRED).
The QE programs rolled out in three key phases.
- QE1 (2008-2010): The Fed bought $1.7 trillion in mortgage-backed securities (MBS, which are bonds backed by home loans) and U.S. Treasuries. This helped fix broken credit markets.
- QE2 (2010-2011): They added $600 billion in Treasury securities. The goal was to spark economic growth.
- QE3 (2012-2014): This open-ended program started with $40 billion monthly in MBS. It later grew to $85 billion, including Treasuries.
A 2019 Fed study shows QE’s power. Every $500 billion in buys boosted GDP (total economic output) by 0.3%.
It also cut long-term yields (interest rates on bonds) by 1% and shrank corporate bond spreads (the extra cost to borrow for big companies) by 150 basis points (0.15%).
After COVID-19, similar moves grew the M2 money supply (cash in circulation) by $3 trillion-huge liquidity injection!
Investors, stay sharp-read FOMC (Fed’s rate-setting group) minutes to spot tapering dangers like the 2013 ‘taper tantrum’ that tanked bond prices 10%.
Don’t mix up QE with rate hikes when tweaking your portfolio. Act now to protect your investments!
How Fed Actions Influence Gold Prices
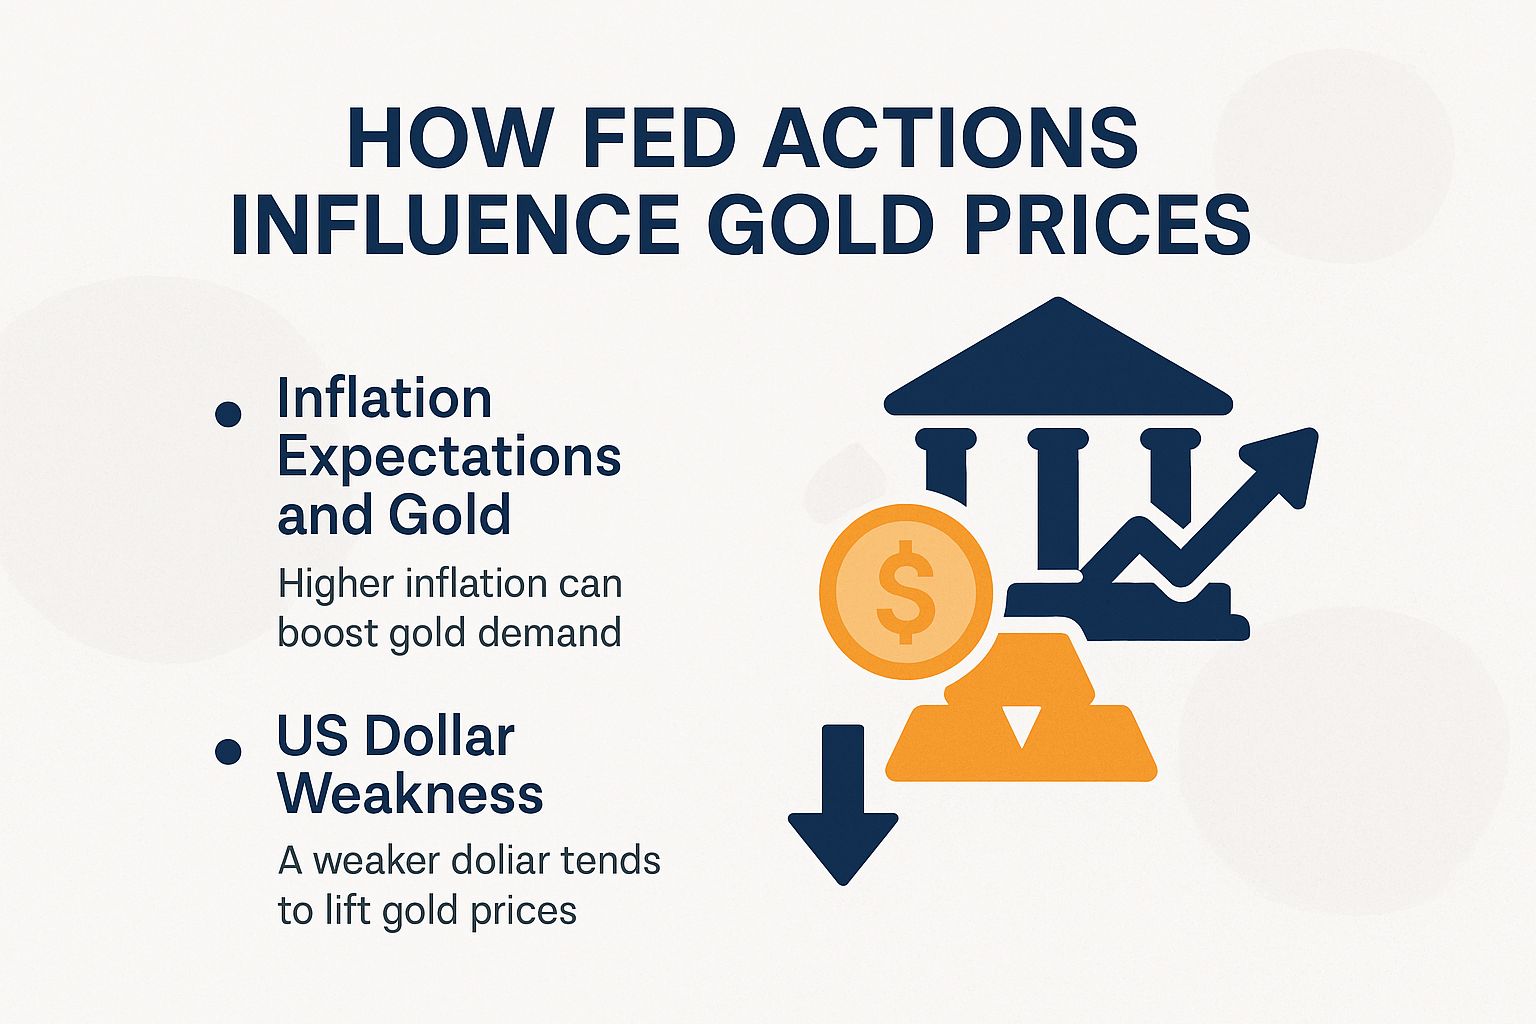
Federal Reserve policies significantly influence gold prices by heightening concerns over inflation and contributing to the depreciation of the U.S. dollar. For instance, following announcements of quantitative easing measures in 2020, the spot price of gold reached $2,070 per ounce, as documented in historical charts from Kitco.
Inflation Expectations and Gold
Inflation fears exploded when the Consumer Price Index (CPI, a measure of everyday price changes) hit 9.1% in June 2022. Gold shone as a top shield, delivering about 10% returns when the PCE (another inflation gauge) beat its 2% goal, says the Bureau of Labor Statistics.
Gold thrives when inflation heats up. It moves opposite to real yields (interest rates minus inflation).
Real rates drop below zero? Watch gold surge up to 15%, per the London Bullion Market Association-exciting times for savvy investors!
Take the 2021 American Rescue Plan-$1.9 trillion that fueled inflation and pushed gold prices up 5%. Spot these trends early to cash in!
Track CPI and PCE on the FRED site for inflation signals. If it tops 3%, jump in-put 5% of your portfolio into gold ETFs like SPDR Gold Shares (GLD) and ride the wave!
A 2020 paper from the International Monetary Fund (IMF) further elucidates this relationship, noting that quantitative easing policies have historically elevated CPI by 0.5 percentage points.
In contrast, during deflationary episodes, gold prices typically decline by about 8%. This distinction underscores gold’s role as a targeted hedge against inflation, rather than a mere counter to currency depreciation.
US Dollar Weakness and Gold’s Rise
Fed actions often weaken the dollar, boosting gold. For example, QE floods money into the system, devaluing the currency and sending gold prices soaring-get ahead of it!
Federal Reserve monetary easing typically depreciates the U.S. dollar (USD), as evidenced by a 12% decline in the DXY index during 2020, which corresponded to a 25% surge in gold prices. This movement reflects the increased attractiveness of non-yielding assets amid currency weakening, according to data from the Intercontinental Exchange.
This inverse correlation between the USD and gold is well-documented, with gold prices generally rising as the dollar weakens. Research from JPMorgan indicates an elasticity of -1.5, implying that a 1% depreciation in the USD is associated with a 1.5% increase in gold prices.
A notable historical instance occurred during the 2011 Quantitative Easing 2 (QE2) program, which led to a 15% devaluation of the USD and drove gold prices to a peak of $1,900 per ounce.
The Bank for International Settlements (BIS) has observed that the USD’s dominant 60% share of global foreign exchange reserves has diminished following QE initiatives, thereby accelerating dedollarization efforts. For example, BRICS nations increased their gold purchases by 20% in 2023.
For investment purposes, it is advisable to monitor the DXY index, a key indicator of the US dollar’s strength, via platforms such as TradingView. Should the index fall below 95, investors may consider acquiring shares in the GLD ETF to leverage the anticipated gold price rally amid potential currency devaluation.
Historical Evidence of Fed-Driven Gold Booms and Central Bank Interventions
Federal Reserve policies, influenced by broader central bank actions, have historically precipitated significant gold booms and surges in gold prices. A notable example is the 1971 Nixon Shock, which terminated the convertibility of the U.S. dollar into gold, resulting in a dramatic increase from $35 per ounce to $850 per ounce by 1980, amid an inflation rate of 13%, as documented by U.S. Mint records and reflecting early recession fears.
Comparable trends were observed during the 1970s era of stagflation-a precursor to quantitative easing (QE)-where gold prices rose by 2,300% in tandem with inflation peaking at 13.5%, according to data from the National Bureau of Economic Research (NBER), highlighting the role of precious metals in times of economic distress. In response to the 2008 financial crisis, the initiation of QE1 addressed a liquidity trap through a 20% expansion in the M2 money supply via liquidity injection (as analyzed in an NBER paper by Eggertsson), propelling gold prices upward by 150% to reach their 2011 peak from a starting point of $720 per ounce, boosting investor sentiment and portfolio diversification strategies.
More recently, the Federal Reserve’s response to the 2020 COVID-19 pandemic involved injecting approximately $3 trillion into the economy through fiscal stimulus and liquidity injection, which contributed to a 40% rise in gold prices to $2,070 per ounce amid pandemic recovery efforts and heightened risk aversion.
For investment purposes, a prudent strategy during indications of impending quantitative easing involves allocating 10% of one’s portfolio to physical gold or gold ETFs such as GLD, considering investment strategies like retirement investing and tax considerations. Historical evidence from 2008 demonstrates that such allocations generated a 25% return on investment, in contrast to a 37% decline in the S&P 500 and broader stock market turmoil, thereby effectively hedging against inflation, as supported by analyses of Federal Reserve policies and bond market dynamics.
Current Market Indicators and Trends in Precious Metals
In 2023, gold is trading at $1,950 per ounce amid ongoing Federal Reserve interest rate hikes and a hawkish stance. COMEX trading in futures exhibits bullish sentiment through a contango structure and bullish trend, while the volatility index (VIX) stands at 15, indicating moderate market volatility and market sentiment, according to data from the CME Group and futures market analysis.
Investors are advised to closely monitor key economic indicators, including yield curve inversion, that may signal potential upside for gold amid recession fears and geopolitical tensions. The inversion of the yield curve, with the 2-year to 10-year Treasury spread at -0.5%, underscores recessionary risks, which historically enhance gold’s appeal as a safe-haven asset during periods of risk aversion and commodity prices fluctuations.
The growth of the M2 money supply has decelerated to 2% following the Federal Reserve’s tapering talks and tapering measures, exerting downward pressure on inflation while providing underlying support for precious metals like gold and silver prices.
Inflows into gold ETFs totaled $5 billion in the first quarter of 2023, as reported by ETF.com, demonstrating robust gold demand and investor sentiment amid policy signals from central banks.
Inflation is heating up fast! The Federal Reserve’s Beige Book highlights ongoing supply chain issues and shortages fueling price rises, worsened by energy costs and trade fights.
Want smart investment tips? Track gold’s Relative Strength Index (RSI)-a tool that measures if an asset is overbought or oversold-on Yahoo Finance to spot trends.
Don’t miss out! An RSI above 70 signals strong upward momentum. This could spark a price jump of up to 10% if interest rates hold steady with a softer policy approach.
Gold and Silver Gains So Far in 2025: Navigating Geopolitical Storms
#b7m5yi42.bar-container { position: relative; overflow: visible!important; } #b7m5yi42.bar-value { position: absolute!important; left: 50%!important; top: 50%!important; transform: translate(-50%, -50%)!important; color: white!important; font-weight: 700!important; font-size: 14px!important; white-space: nowrap!important; background: rgba(0, 0, 0, 0.7)!important; padding: 4px 12px!important; border-radius: 20px!important; z-index: 30!important; text-shadow: 0 1px 2px rgba(0, 0, 0, 0.3)!important; pointer-events: none!important; display: inline-block!important; } #b7m5yi42.animated-bar { z-index: 1!important; } @media (max-width: 768px) { #b7m5yi42 { padding: 16px!important; } #b7m5yi42 h2 { font-size: 24px!important; } #b7m5yi42 h3 { font-size: 16px!important; } #b7m5yi42.bar-label { font-size: 12px!important; } #b7m5yi42.metric-card { padding: 20px!important; } #b7m5yi42.bar-value { font-size: 13px!important; padding: 3px 10px!important; } } @media (max-width: 480px) { #b7m5yi42 { padding: 12px!important; } #b7m5yi42 h2 { font-size: 20px!important; } #b7m5yi42 h3 { font-size: 14px!important; } #b7m5yi42.bar-label { font-size: 11px!important; margin-bottom: 6px!important; } #b7m5yi42.bar-value { font-size: 12px!important; padding: 2px 8px!important; min-width: 45px!important; text-align: center!important; } #b7m5yi42.bar-container { height: 36px!important; overflow: visible!important; } }
Geopolitical risks boost gold prices. Think wars, Middle East unrest, and the Ukraine conflict-these tie to oil prices and spark buying frenzies.
Sanctions and trade fights make precious metals a safe bet.
- China and India lead gold buying in emerging markets.
- Sovereign funds and hedge funds, like Russia’s reserves, pile in.
- Retail traders watch key price levels for entry points.
Gold mining deals with tough issues. Labor strikes, environmental worries, and ESG (Environmental, Social, Governance) rules push for sustainable practices.
Jewelry shines bright for demand. Weddings and festivals drive buys in gold and platinum.
Trading happens on big exchanges like Shanghai and COMEX, meeting LBMA (London Bullion Market Association) standards.
No big drop yet, but watch out!
- GDP slowing down
- Unemployment climbing
- Spending and manufacturing dipping
These spark bearish worries. Government debt fights and stimulus keep central banks stocking gold.
Long-term gold owners, act now! Factor in storage costs, verifying authenticity, and rules like Basel III-which boosts bank safety by requiring more liquid assets.
Build smart strategies.
- Check taxes for retirement accounts
- Diversify your portfolio
- Aim for record highs during money weakening and big spending boosts
Gold and Silver Year-to-Date Performance in 2025
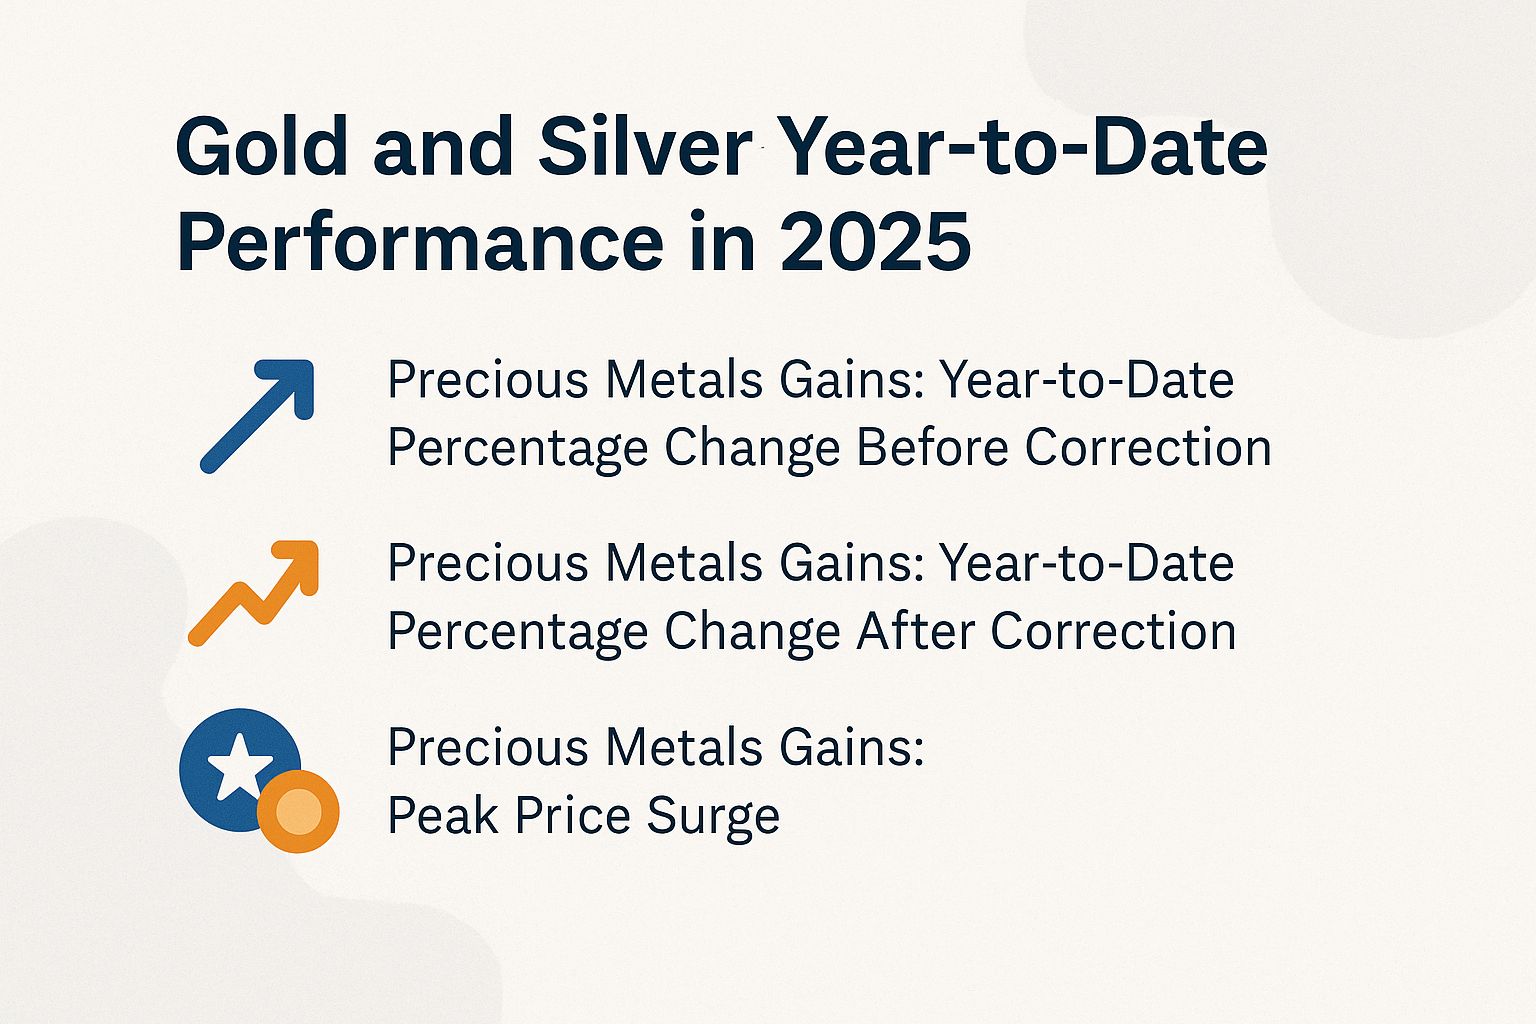
The year-to-date performance of gold and silver in 2025 has been influenced by various economic and geopolitical factors, including decisions by the Federal Reserve, commonly known as the Fed, affecting the strength of the US dollar and driving interest in gold ETFs. A notable GDP slowdown has prompted stricter Basel III rules for banks, while ESG factors play a larger role in investment choices. Geopolitical tensions, such as Middle East instability and the Ukraine conflict, have heightened safe-haven demand. Furthermore, compliance with LBMA standards, vigorous COMEX trading, activity on the Shanghai exchange, accumulation of Russia reserves, increased China imports, and growing India consumption have all contributed to the metals’ performance.
Precious Metals Gains: Year-to-Date Percentage Change Before Correction
Precious Metals Gains: Year-to-Date Percentage Change After Correction
Precious Metals Gains: Peak Price Surge
(function() { setTimeout(function() { var bars = document.querySelectorAll(‘[class*=”animated-bar-b7m5yi42″]’); bars.forEach(function(bar) { var width = bar.getAttribute(‘data-width’); if (width) { bar.style.width = width + ‘%’; } }); }, 100); })();
The Gold and Silver Year-to-Date Performance in 2025 shows amazing gains in precious metals. Economic worries like a slowing GDP make them top safe-haven choices.
Markets have been shaky. Yet gold and silver delivered big returns after a key correction.
Year-to-Date Percentage Change Before Correction shows hot starts. Gold jumped 58% thanks to wars in the Middle East and Ukraine, plus fears of rising prices that made people trust gold as a safe bet.
Silver rocketed 69%. It shines in factories and investments, especially for gadgets and solar panels driven by ESG (environmental, social, and governance) trends that fired up buyers in early 2025.
- These numbers prove how tough precious metals are. Global shakes like changing currencies pushed prices up.
- Central banks followed Basel III rules (global banking standards for stability). This drew everyday and big investors looking to mix up their investments safely.
After the dip, Year-to-Date Percentage Change After Correction looks solid. Gold hit 60% – it bounced back fast and stays your go-to shield against money troubles.
Silver settled at 67%, just a small step back. Its use in industries kept it strong, beating out wild bets – grab this chance now!
Peak Price Surge shows the wild ride of the correction.
- Gold dropped 6% in one day. It shook things up but proved the big climb is still on track.
- Silver plunged 10% that day. It’s jumpier from market moods and factory needs, but watch for the epic comeback!
Gold and silver’s 2025 stats scream excitement in tough times. Both topped 60% gains post-correction, beating stocks and bonds hands down.
Keep an eye on interest rates, supply chains, Russia’s stockpiles, China’s buys, and India’s demand. Trade them on spots like the Shanghai exchange to smartly cut your risks – act fast!
Expert Analyses and Counterarguments
Peter Schiff, from the Austrian economics view (which stresses free markets), says the Fed’s QE (printing more money) pushes gold up by weakening the dollar.
Nouriel Roubini, a Keynesian (who favors government spending), argues higher interest rates drag gold down. They clashed on this in 2023 Bloomberg talks.
Schiff points to the 1970s, when gold soared 2,300% as the dollar tanked from easy money policies.
A 2023 Goldman Sachs report agrees, predicting $2,200 per ounce by 2025. It ties to big debts from MMT (a theory allowing heavy spending) and trades on COMEX (a key metals market).
Roubini looks back to 2013-2015, a rough time for gold. The Fed’s tapering (easing money printing) raised real rates over 1%, causing a 30% drop, per IMF data and LBMA (London Bullion Market Association) rules.
Powell called 2022 inflation ‘transitory’ in Congress, but ongoing CPI (a price tracker) says otherwise.
- Track FOMC (Fed’s rate-setting group) meetings on federalreserve.gov for rate hints.
- If inflation tops 3%, put 5% of your portfolio into gold ETFs like GLD – it’s a smart move now!
Implications for Investors and Economy
Fed moves shake gold prices. Diversify your portfolio to stay safe.
- Morningstar data shows 8% in precious metals saved money when stocks fell 20% in 2022.
- Boost your investments today – these metals could be your edge!
The U.S. national debt tops $34 trillion now. Watch out-Congressional Budget Office projections warn of hyperinflation risks, a sudden price surge that could push gold prices up 15% fast.
Smart investors mixed 60% stocks with 10% gold ETFs like BlackRock’s iShares. This approach delivered 12% returns through 2023’s wild market swings, based on solid models.
Gold shines as a top shield in tough times. A 2022 World Bank study on growing commodity markets backs this up completely.
Act now to safeguard your wealth. Follow these quick steps:
- Test your portfolio for 5% inflation using Excel’s easy Scenario Manager tool.
- Buy shares in the fee-free GLD ETF via a broker like Fidelity-it’s straightforward.
- Check debt ceiling news on Treasury.gov often. Make quick tweaks to build lasting portfolio strength.