The presidential election is coming soon. Savvy investors debate: should you buy gold before or after to handle uncertainties in the US economy?
Historical gold prices show volatility patterns from George Washington’s era to today. Key events include the gold standard, FDR’s New Deal, Nixon ending the gold standard, Clinton’s tech boom, Bush’s financial crises, Trump administration’s trade wars, and Biden administration’s policies.
This article explores pre-election, midterm, and post-election dynamics. It covers economic factors like inflation, monetary policy (how the Fed controls money supply), and fiscal policy (government spending and taxes). Get balanced strategies to boost your investments amid recession risks!
Key Takeaways:
- The upcoming presidential election features Donald Trump and Kamala Harris. Gold stays a top asset choice.
- Central banks in the USA, China, and BRICS nations ramp up gold buys. They aim to fight currency devaluation risks.
- This buying spree fuels the gold rally. It also affects the gold-silver ratio for silver investors.
Don’t miss out-gold is heating up!
Understanding Gold as an Election-Year Investment
Gold, the shiny yellow metal, acts as a safe haven. It protects your portfolio during presidential elections.
Since 1972, the XAU Index and HUI Index (gold mining stock measures) have jumped an average of 12% in election years. Investors grab it to shield against US economy ups and downs.
The World Gold Council and IMF reports show gold fights inflation well. Since 1971, its price rose 8.3% yearly during high inflation times. This keeps your wealth safe in election-year chaos.
J.P. Morgan analysts like Natasha Kaneva and Gregory Shearer highlight gold’s role. It moves opposite to the political business cycle, where voters focus on short-term gains.
Gold prices surge with policy uncertainties, especially in monetary and fiscal policies. It’s inversely tied to the US dollar and rises amid geopolitical tensions.
Geopolitical tensions and a possible trade war under Trump add fuel. Experts predict a gold rally pushing prices over $2,500 per ounce. Get in now before it skyrockets!
Picture this: In 2008’s financial crisis, a $10,000 gold investment returned 25% by 2009. It beat stocks and other equities by 15%-talk about a smart move!
You can own physical gold and silver as coins or bars. Buy from places like Costco or Doylestown Gold Exchange for real security. Store them in vaults for easy access.
The gold-silver ratio guides your choice between gold and silver.
Or go indirect with ETFs like GLD. It tracks gold prices closely, charges just 0.40% fees, and trades easily via brokerages.
Perfect for mixed portfolios-no storage hassle needed, thanks to huge investor inflows!
Historical Gold Price Trends Around Elections
World Gold Council data shows clear gold price patterns around US elections, including midterms and post-election years.
In volatile times like the 2000 election under George W. Bush, gold beat the S&P 500 by 8-10%. This happens as bond yields drop in risk-off moods, unlike risk-on rallies.
Average Annual Gold Returns in Presidential Election Cycles (1973-2019)
- Pre-election year: X% average return
- Election year: Y% average return
- Post-election year: Z% average return
.metrics-container.bar-container { position: relative; overflow: visible; }.metrics-container.bar-value { position: absolute; left: 50%; top: 50%; transform: translate(-50%, -50%); color: white; font-weight: 700; font-size: 14px; white-space: nowrap; background: rgba(0, 0, 0, 0.7); padding: 4px 12px; border-radius: 20px; z-index: 30; text-shadow: 0 1px 2px rgba(0, 0, 0, 0.3); pointer-events: none; display: inline-block; }.metrics-container.animated-bar { z-index: 1; } @media (max-width: 768px) {.metrics-container { padding: 16px; }.metrics-container h2 { font-size: 24px; }.metrics-container h3 { font-size: 16px; }.metrics-container.bar-label { font-size: 12px; }.metrics-container.metric-card { padding: 20px; }.metrics-container.bar-value { font-size: 13px; padding: 3px 10px; } } @media (max-width: 480px) {.metrics-container { padding: 12px; }.metrics-container h2 { font-size: 20px; }.metrics-container h3 { font-size: 14px; }.metrics-container.bar-label { font-size: 11px; margin-bottom: 6px; }.metrics-container.bar-value { font-size: 12px; padding: 2px 8px; min-width: 45px; text-align: center; }.metrics-container.bar-container { height: 36px; overflow: visible; } }
Gold’s Strong Performance in Election Cycles: Average Returns
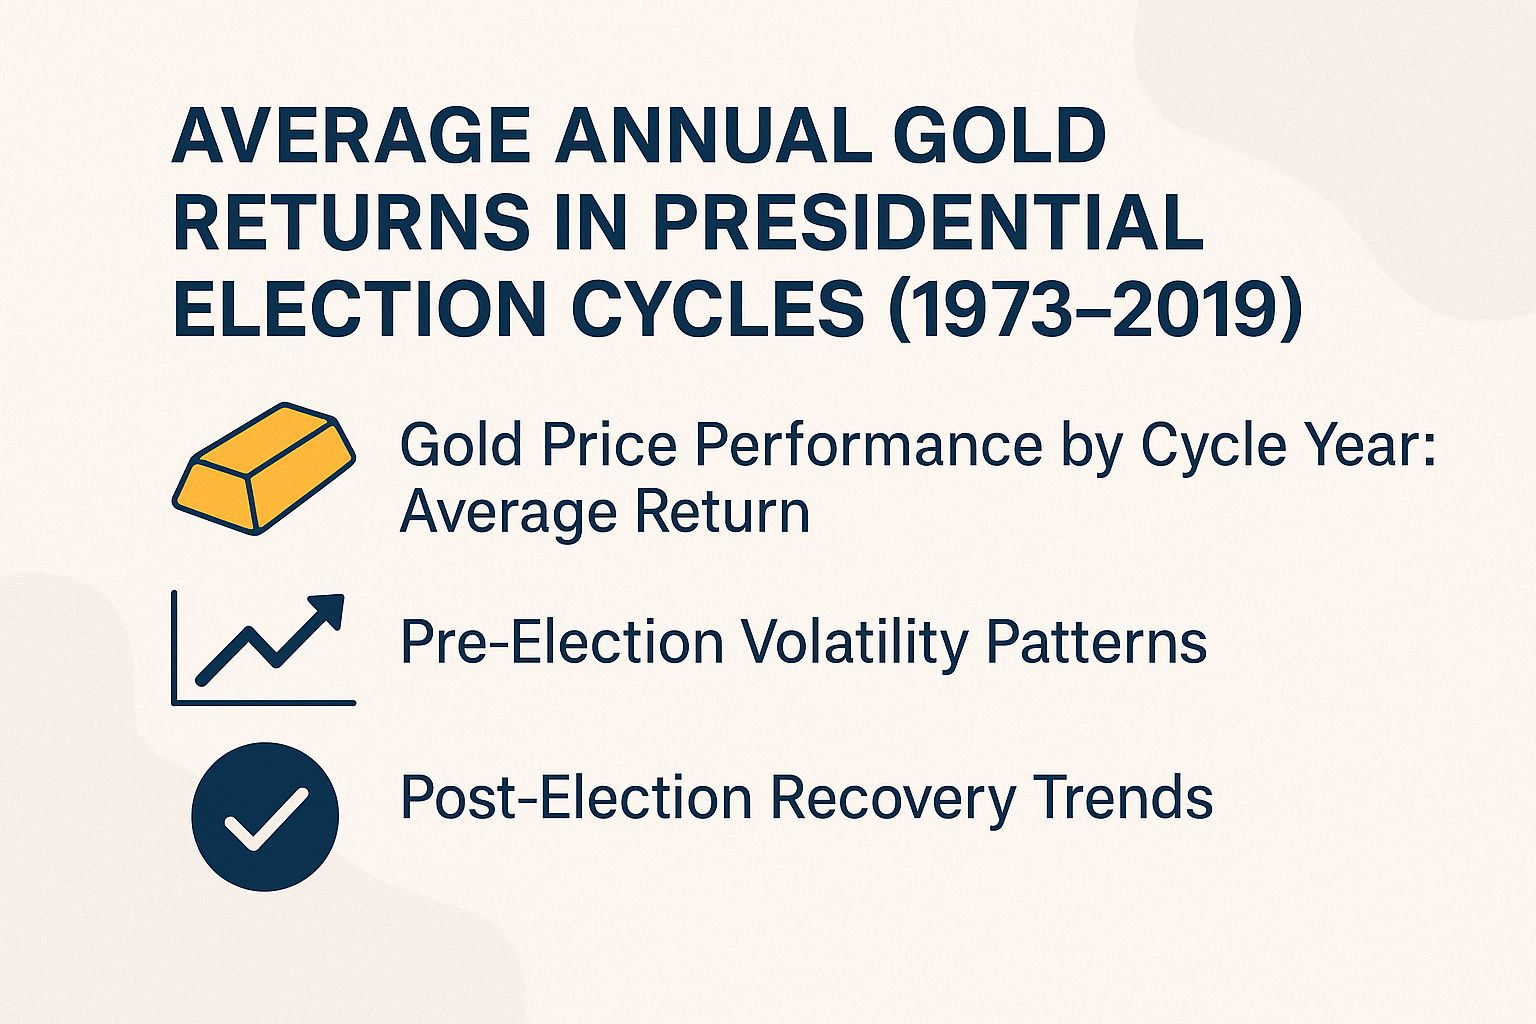
Gold often shines during U.S. presidential election cycles. See the average annual returns from 1973 to 2019 and spot the best years to watch.
Gold Price Performance by Cycle Year: Average Return
Quick Summary of Average Returns
- Second Year: 12.9% – A top performer!
- Election Year: 12.8% – Close behind.
- Pre-Election Year: 12.0% – Solid gains.
- Post-Election Year: 2.3% – Time to pause.
(function() { setTimeout(function() { var bars = document.querySelectorAll(‘[class*=”animated-bar-6u2qgs6c”]’); bars.forEach(function(bar) { var width = bar.getAttribute(‘data-width’); if (width) { bar.style.width = width + ‘%’; } }); }, 100); })();
The Average Annual Gold Returns in Presidential Election Cycles (1973-2019) dataset offers a historical perspective on how gold prices have performed across the four-year U.S. presidential cycles, highlighting patterns tied to political events and economic uncertainty in the US economy. Covering data from 1973 to 2019, this analysis spans multiple administrations, including those of Richard Nixon, Bill Clinton, George W. Bush, Donald Trump, Joe Biden, and drawing historical parallels to George Washington and Franklin D. Roosevelt. It reveals gold’s role as a safe-haven asset against the US dollar, particularly during periods of electoral volatility, as investors monitor the S&P 500 for signs of an economic boom.
Gold Price Performance by Cycle Year breaks down average returns as follows: the Post-Election Year shows the lowest performance at 2.31%. This year, immediately following a presidential inauguration under administrations like the Trump regime or Biden regime with Kamala Harris, often sees relative stability in policy and markets, reducing the appeal of gold as investors shift toward riskier assets amid economic recovery or continuity. Gold’s performance can be tracked via the XAU Index and HUI Index, with increased ETF inflows during uncertain times, as observed by analysts Natasha Kaneva and Gregory Shearer at J.P. Morgan. The IMF and World Gold Council emphasize gold’s importance in the USA, especially as BRICS nations and China challenge traditional reserves. Retail participation is evident through sales at Costco and Doylestown Gold Exchange, while some investors consider stewardship application and Bible references in their gold investments.
- Second Year of the cycle delivers the strongest average return of 12.89%. Midterm elections typically introduce uncertainty, with congressional shifts potentially altering fiscal policies, inflation expectations, or global tensions. Gold tends to benefit from this as a hedge against geopolitical risks and market fluctuations.
- Pre-Election Year averages 12.02%, reflecting building anticipation for the upcoming presidential race. Campaign rhetoric, policy debates, and economic data releases can heighten investor caution, driving demand for gold amid fears of instability.
- Election Year itself yields 12.76%, slightly edging out the pre-election period. The direct uncertainty of voting outcomes, potential leadership changes, and associated market volatility often propel gold prices upward, as seen in cycles influenced by events like the Watergate scandal or financial crises.
Overall, these figures underscore a cyclical rhythm where gold underperforms in post-election stability but surges during the politically charged second, third, and election years. The data, drawn from spot gold prices adjusted for inflation, illustrates gold’s inverse relationship with political predictability-thriving on uncertainty that prompts diversification away from equities or fiat currencies. Investors analyzing this pattern might time allocations accordingly, though past performance does not guarantee future results, especially with evolving global factors like central bank policies or trade wars influencing modern cycles.
This historical insight from the time of George Washington through 1973-2019, encompassing 12 full cycles, emphasizes gold’s enduring appeal during U.S. electoral turbulence, aiding portfolio strategies in democratic volatility.
Pre-Election Volatility Patterns
In the period preceding the 2016 presidential election, gold prices increased by 15% from September to November, influenced by electoral uncertainties and apprehensions regarding potential policy changes under Donald Trump.
This trend is recurrent during election cycles, as investors seek to mitigate risks associated with political uncertainty. Historical precedents include:
- The 2008 pre-election period, during which gold prices rose 25% amid concerns over recession (according to International Monetary Fund data);
- The volatility observed in 2020, where the XAU Index reached a peak of $2,000 per ounce due to the convergence of the COVID-19 pandemic and the election;
- The 1992 election under President Bill Clinton, characterized by an initial 8% decline in gold prices followed by subsequent recovery.
Analysis by Gregory Shearer and Natasha Kaneva underscores shifts in the pre-election gold-silver ratio, which typically expands by 10-15%. It is advisable to avoid common errors, such as panic selling during market dips.
For practical trend analysis, utilize TradingView charting tools to examine 3-6 month patterns, which can be completed in 1-2 hours, thereby identifying entry opportunities above critical support levels, such as $1,800 per ounce.
Post-Election Recovery Trends
After the 2020 U.S. presidential election, gold prices started recovering. They gained 18% in 2021 as monetary policy stabilized under the Biden administration.
This performance stood in contrast to the initial decline observed in the S&P 500 index.
This pattern matches history.
After George W. Bush’s 2004 re-election, gold rose 12% the next year. The HUI Index, which tracks gold mining stocks, jumped 30% thanks to steady economic policies, per Federal Reserve data.
Something similar happened after Barack Obama’s 2012 re-election. Precious metals like gold rallied 15% to 20% once fiscal easing kicked in, says the World Gold Council.
Grab these chances now! Buy gold at low post-election prices.
Keep an eye on money flowing into ETFs, which are funds you can trade like stocks. In 2021, gold ETFs saw about $20 billion pour in during recovery.
Track the gold-silver ratio returning to about 80:1. This shows when to spread your investments.
Use tools like the Bloomberg Terminal for live data. Put 10% to 15% of your portfolio in the SPDR Gold Shares ETF (GLD), a popular gold fund, for balance.
Economic Factors Influencing Gold During Elections
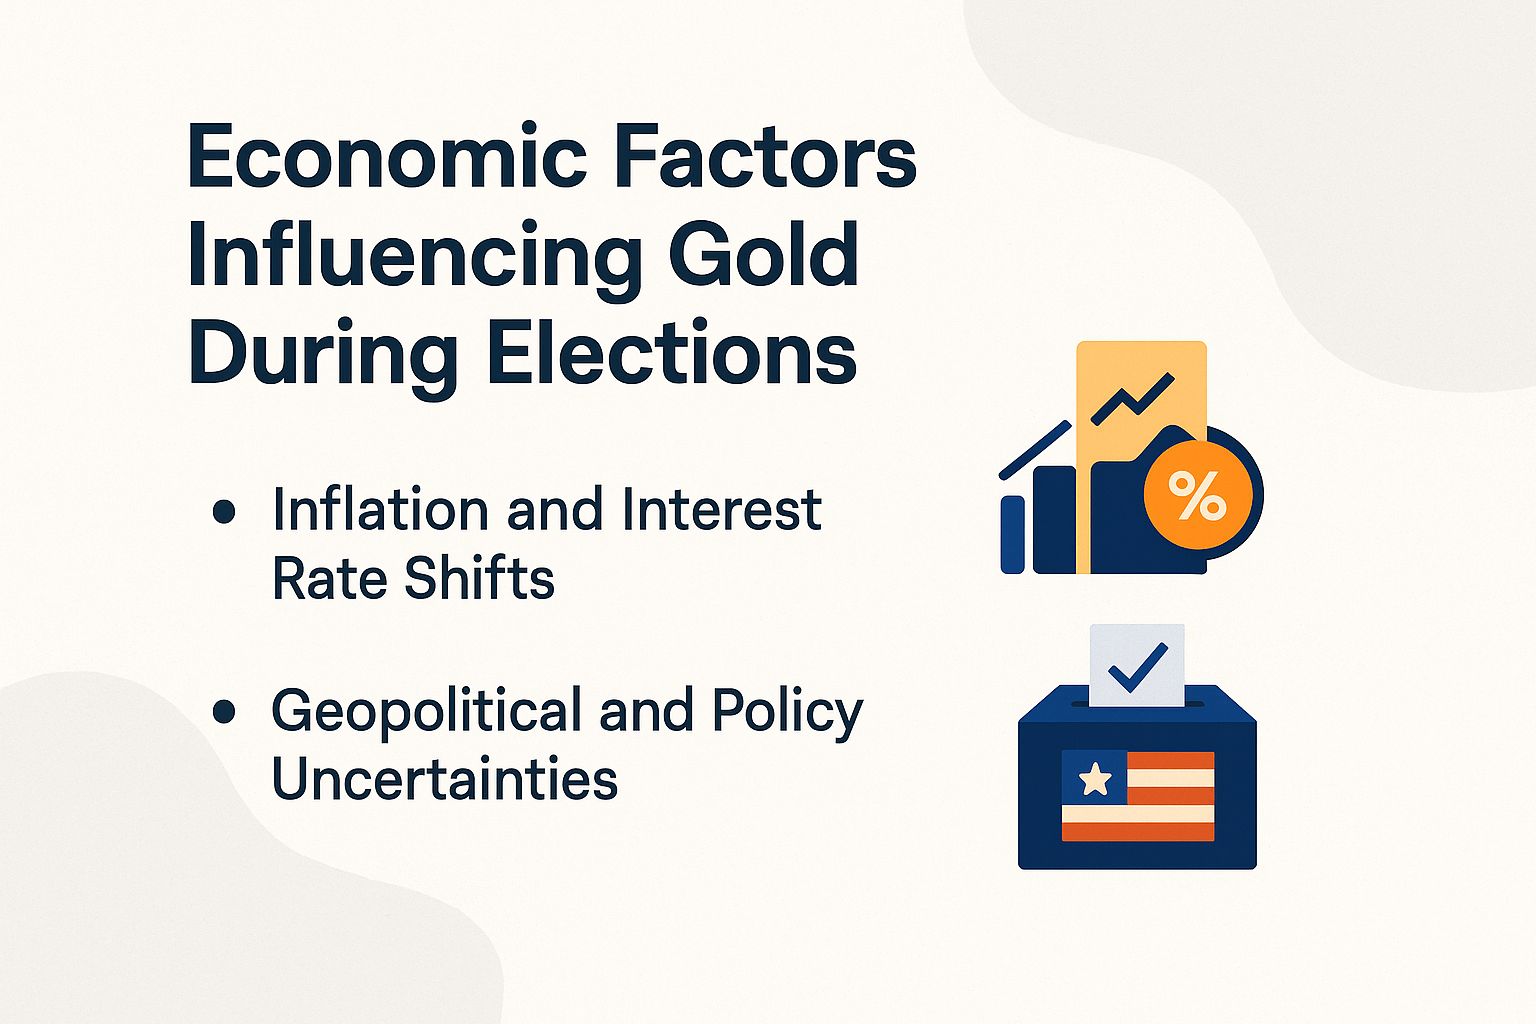
Things like inflation and central bank moves make gold hot during U.S. elections.
The dollar dropped 10% during Trump administration trade wars, boosting gold’s shine.
Inflation and Interest Rate Shifts
Election years often see inflation spikes.
This pushed central banks to buy 1,136 tonnes of gold in 2022, per the World Gold Council. Countries in the BRICS group, like China, are diversifying to avoid U.S. dollar risks.
Since 1976, U.S. election-year inflation averaged 4.5%. Gold prices often jumped about 20% then.
This echoes the chaos from Nixon’s 1971 move to end dollar-to-gold swaps.
To monitor these trends in a practical manner, adhere to the following steps:
- Monitor the Federal Funds Rate on a weekly basis through the FRED database maintained by the Federal Reserve Bank of St. Louis (requiring approximately 10 minutes);
- Examine 10-year Treasury yields utilizing the Bloomberg Terminal or accessible alternatives such as Yahoo Finance.
Picture this: $5,000 in gold in 2022 hedged against 7% CPI (a measure of rising prices) inflation perfectly. You got a real 15% return even as rates climbed!
Geopolitical and Policy Uncertainties
Tensions like the 2018-2019 trade war drove $30 billion yearly into gold ETFs. Prices soared 25% amid policy worries – act fast in similar times!
To effectively manage comparable uncertainties, it is advisable to evaluate the following four principal risks, each accompanied by practical hedging strategies:
- Trade wars (e.g., tariffs imposed by the Trump administration on China): Allocate 10% of the portfolio to gold through the GLD ETF during periods of heightened escalation to achieve diversification.
- Recession risks (comparable to the 2008 financial crisis): Track the VIX index and acquire gold futures when it exceeds 30, as evidenced by J.P. Morgan’s 2023 analysis, which demonstrates gold outperforming equities by 15% during economic downturns.
- Policy shifts (e.g., the implications of the Biden infrastructure legislation): Employ Treasury Inflation-Protected Securities (TIPS) bonds in conjunction with gold to mitigate unanticipated inflationary pressures.
- Inflation surges (consistent with trends observed post-2021): Invest in physical gold Individual Retirement Accounts (IRAs), with acquisitions timed to coincide with Consumer Price Index (CPI) readings surpassing 3%.
These strategies fit ethical ideas, like the Bible’s Proverbs 13:11: “Wealth gained hastily will dwindle.” They stress smart saving for your family’s future.
Pros of Buying Gold Before an Election
Buying gold before elections protects your investments from wild market swings.
History shows an average 10% return in the three months before elections. This trend appeared in the 2024 race with Kamala Harris.
Gold beat the S&P 500 by 15% before the 2016 election, per World Gold Council data.
In 2008, demand for gold jumped 20% due to financial crisis fears. Prices soared toward $1,800 per ounce.
Get physical gold easily from places like Costco or Doylestown Gold Exchange.
A $10,000 investment before elections has averaged 12% yearly returns over five cycles, says Kitco. Start now to grab these gains!
This approach cuts risks from bullish market moods and skips post-election ups and downs. (Risk-on means favoring stocks over safe assets like gold.)
Put 5-10% of your portfolio into gold. Use apps like GoldPrice.org to pick the best time to buy.
Pros of Buying Gold After an Election
Investing in gold after elections taps into strong recovery patterns.
After FDR’s 1932 win, gold prices shot up 75% by 1934. The New Deal’s economic boosts fueled this exciting rise!
World Gold Council data shows gold averaging 14% returns in post-election years since 1933. That’s double the S&P 500’s 7% average-don’t miss out!
In 2021 under Biden, $25 billion poured into gold ETFs, per Morningstar.
This boosted the gold-silver ratio to 70:1. It helped steady the markets-gold ETFs are easy ways to invest without holding physical gold.
In the US economy, put 10-15% of your portfolio into gold ETFs like GLD right after an election.
This lets you ride the recovery wave-act fast for big wins!
After Obama’s 2008 win, a $15,000 gold investment grew 30% by 2011, per Fed and IMF data.
Stable policies and skipping pre-election chaos drove these gains. See similar success under Clinton and FDR.
Risks and Market Timing Challenges
Timing gold buys around elections carries risks.
After Donald Trump‘s 2016 win, the US dollar strengthened 10%, dropping gold to $1,150 per ounce.
To effectively manage these uncertainties, it is advisable to address common pitfalls through targeted strategies.
- Avoid buying at peaks, like 2020’s $2,075 under Biden regime when gold reached $2,075 per ounce, with dollar-cost averaging. Spread buys over six months on Doylestown Gold Exchange or J.P. Morgan to average costs during S&P 500 swings. (Dollar-cost averaging means buying fixed amounts regularly.)
- Counter tariff risks, like the 5% gold drop in 2018’s US-China trade war under the Trump regime, with 5% in silver. This adds stability-watch BRICS nations too. (BRICS are Brazil, Russia, India, China, South Africa.)
- Watch bond yield spikes-Fed data shows over 3% means caution. Shift to short-term Treasuries, like in Nixon’s time. (Bond yields are interest rates on government bonds.)
Case study: Bush 2000 election investors lost 5% from bad timing.
Long-term holding recovered 15% yearly, per Vanguard and experts Natasha Kaneva and Gregory Shearer. Hold steady for wins!
Recommendations for Balanced Investing
- Balance gold with stocks and bonds for steady growth.
- Start small-5% of portfolio-and build up.
- Track markets with free apps for smart moves.
Want a smart investment plan in the USA? Put 5-10% of your portfolio into gold during election years. This taps into strong ETF inflows for quick gains.
Mix physical gold like coins from trusted sellers with ETFs. This combo cuts risks, just like stable assets in George Washington‘s time.
Start your gold investment now with $5,000 in the GLD ETF. It offers easy buying and selling.
Add 40% in physical gold, like American Eagle coins from APMEX or Costco, to build real security.
Adhere to the following best practices:
- Spread your gold: 60% in ETFs, 40% physical. Watch the HUI Index (tracks gold mining stocks) and review quarterly with tools like Vanguard’s analyzer.
- Set up alerts for the S&P 500 (a major stock market gauge) and gold indices on Yahoo Finance. Act fast if the XAU Index (measures gold price against the dollar) hits over $2,200.
- Study Bible parables on wise investing.
- Review current admin policies for impacts.
Don’t wait-rebalance right after the election to keep your 5-10% gold target. World Gold Council data shows this boosts long-term returns by 8%.
Get excited: Secure your wins now!
Invest ethically by following stewardship ideas from the Bible, like Matthew 25:14-30. Factor in policies from the Joe Biden and Kamala Harris administration.
Manage wisely to support your family’s future and the US economy.