Gold prices hover near all-time highs amid mounting global and economic uncertainties. Savvy investors are watching closely.
A parabolic move could explode prices, just like the 1970s gold bull during stagflation.
Recession fears now threaten stocks and real estate. This makes gold crucial.
Get ready for seven triggers that could spark the next big rally. They include geopolitical flare-ups, stubborn inflation, central bank buys, and technical breakouts. Gold stands strong as a hedge against a weak dollar and falling currencies.
Trigger 1: Escalating Geopolitical Tensions

The 2022 Russia-Ukraine conflict spiked gold prices 15% in three months, hitting $2,070 per ounce. Investors rushed to safe-haven gold as sanctions and supply chain fears grew.
Historical Precedents
- 1973 Yom Kippur War: Oil shocks and Middle East chaos drove gold up 300% in two years, from $97 to $387 per ounce. Investors piled into safe-haven gold fast.
- 2003 Iraq War: U.S. invasion sparked regional chaos. Gold jumped 25% in six months, from $320 to $400 per ounce (LBMA data).
- 2011 Arab Spring: Uprisings across North Africa and the Middle East pushed gold to $1,900 per ounce. Fears of global spread led to a 40% gain in nine months (World Bank report).
- 2018 U.S.-China Trade War: Tariffs and supply chain hits boosted gold 10% in eight months to $1,350 (Bloomberg analysis).
- 2017 U.S. Sanctions on Venezuela: Export bans cut shipments 50% in one year (USGS data). Geopolitical squeezes like this tighten global supply and skyrocket prices elsewhere.
- Watch for more: Global wars, trade battles, pandemics, disasters, and Taiwan flare-ups. They boost demand for gold and other metals as safe havens amid uncertainty.
Trigger 2: Persistent High Inflation
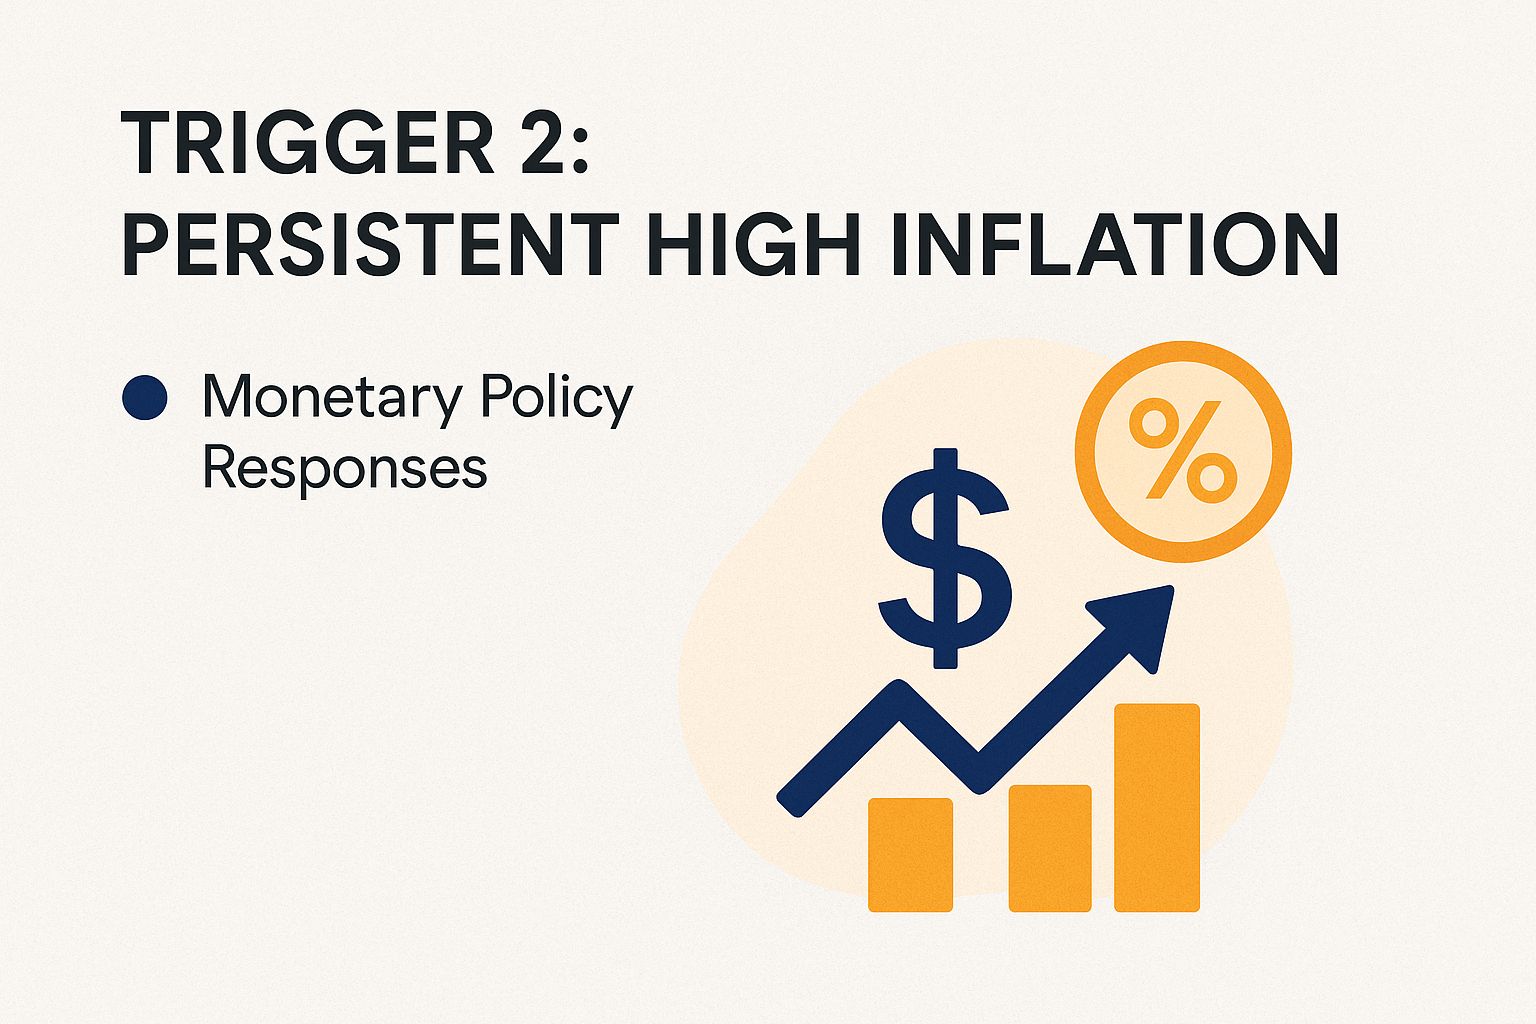
In June 2022, U.S. inflation hit 9.1% via the Consumer Price Index (CPI)-a measure of price changes-which was the worst since 1981. Gold jumped 8% in Q3, shielding buyers from losing money as yearly inflation averaged 7%.
Monetary Policy Responses
The Fed’s 2020 quantitative easing (QE)-printing money to buy assets-pumped $3 trillion into markets. This led to a 25% gold surge, as low yields made it a top inflation fighter.
Past money policies always boosted gold big time. Check these examples:
- Interest rate reductions: During the 1970s, the Federal funds rate declined from 13% to 8%, leading to a 400% rise in gold prices (data from the St. Louis Federal Reserve).
- Quantitative easing expansions: Between 2008 and 2012, the addition of $4 trillion in liquidity propelled gold prices to $1,900 per ounce (European Central Bank reports).
- Yield curve control measures: Japan’s policy implemented in 2016 resulted in a 15% appreciation of gold in yen terms (Bank of Japan analysis).
- Fiscal stimulus initiatives: The United States’ $1.9 trillion stimulus package in 2021 contributed to a 7% increase in gold prices (Congressional Budget Office).
For investors seeking to mitigate inflation risks, it is advisable to allocate 10% of a portfolio to the GLD exchange-traded fund during periods of dovish signals from the Federal Reserve. This investment strategy can incorporate physical gold, gold futures, mining stocks, and commodities trading to safeguard against bond yields compression, hyperinflation risks, and recession fears.
Trigger 3: Weakening US Dollar
In 2020, the US Dollar Index (DXY) declined by 11%, which propelled gold prices upward by 25% to $2,075. This appreciation was amplified by gold’s inverse correlation of 0.7 with the dollar.
According to data from the CME Group, this inverse relationship demonstrates that gold has historically appreciated by 1.5% for every 1% decline in the DXY. The following table offers a side-by-side comparison:
| Period | DXY Change | Gold Change | Key Insight |
|---|---|---|---|
| Strong Dollar (2014-2016) | +25% | -28% | Dollar strength exerted downward pressure on gold as a safe-haven asset. |
| Weak Dollar (2002-2008) | -40% | +250% | Currency depreciation drove substantial gold rallies amid economic uncertainty. |
To hedge against such dynamics, investors may establish short positions in the UUP ETF, thereby capitalizing on DXY declines. For example, the 2023 drop in the DXY to 100 levels precipitated a 5% rally in gold prices, illustrating the potential for actionable strategies in volatile market environments.
Utilizing technical analysis, traders can monitor chart patterns, resistance levels, support levels, moving averages, RSI indicator, MACD signal, trading volume, and market sentiment via the fear greed index to anticipate price breakout opportunities.
Trigger 4: Central Bank Gold Accumulation
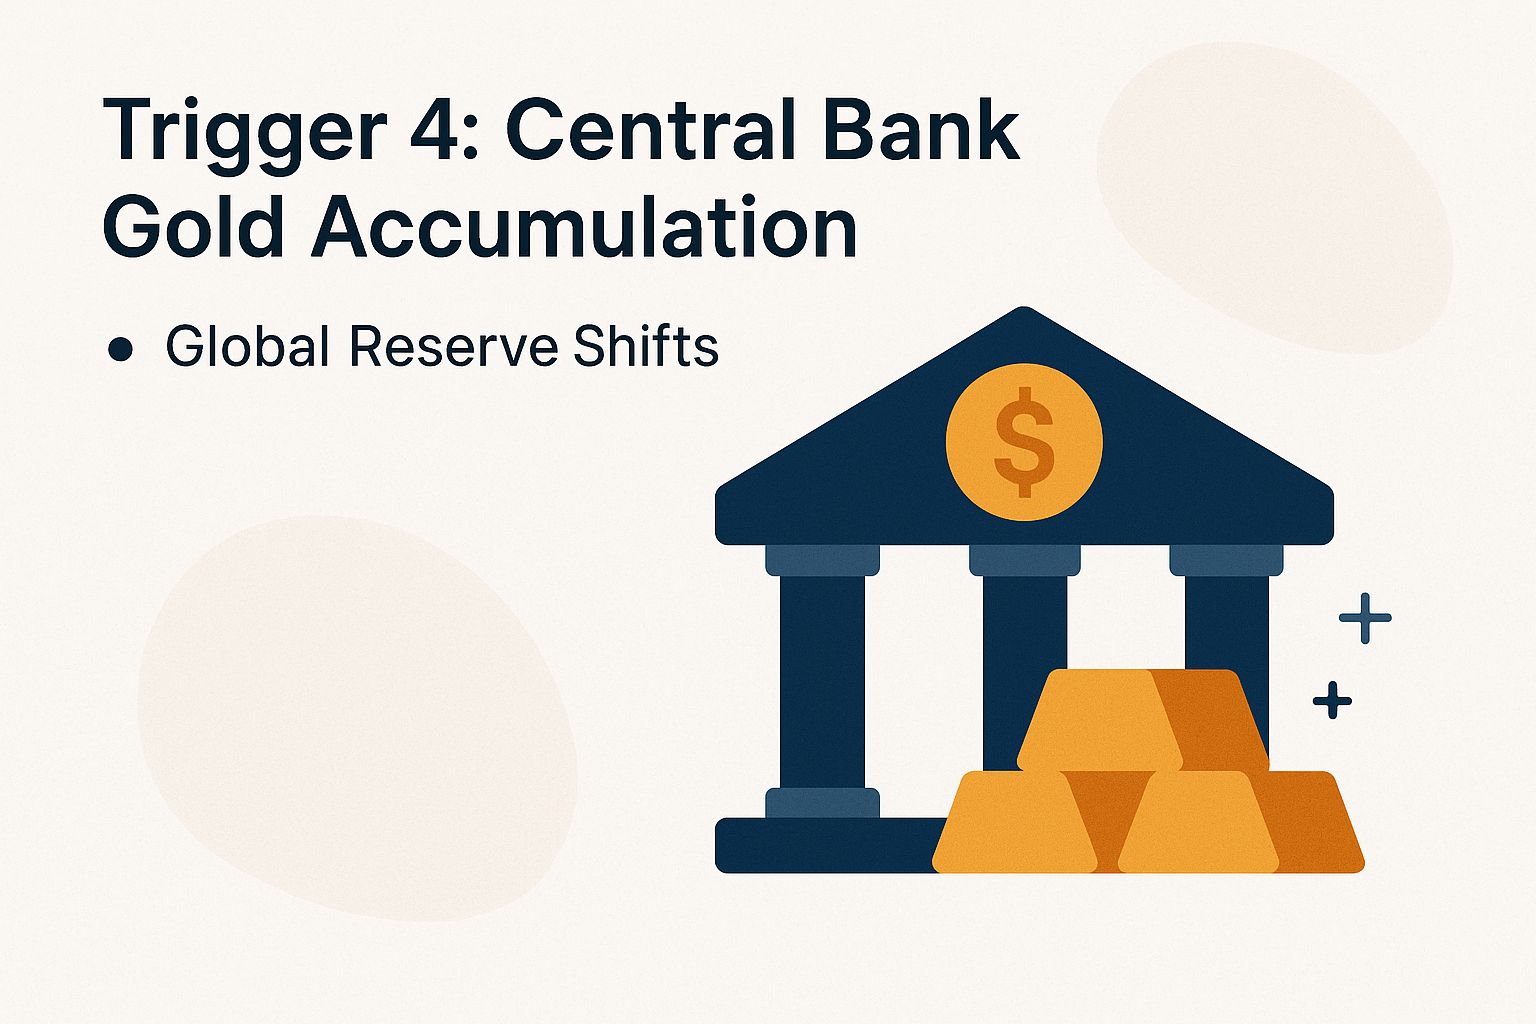
According to the World Gold Council, central banks acquired a record 1,136 tonnes of gold in 2022, representing a 52% increase from 2021. This substantial purchase activity supported a 10% rise in gold prices, amid broader efforts by these institutions to diversify their holdings away from U.S. dollar-denominated assets.
Global Reserve Shifts
In 2022, Russia increased its gold reserves by 43 tonnes despite international sanctions, while China’s holdings expanded by 200 tonnes annually, according to the World Gold Council (WGC). These developments have contributed to an 8% year-to-date gain in gold prices.
Emerging markets are sustaining this momentum through deliberate strategies of gold accumulation. Notable changes include:
- Russia, with total reserves of 2,300 tonnes, reflecting an addition of 274 tonnes in 2022 based on Central Bank of Russia data;
- China, holding 2,200 tonnes, with undisclosed purchases estimated at 300 tonnes per year derived from leaks associated with the People’s Bank of China;
- India, possessing 800 tonnes and adding 50 tonnes in 2023 as reported by the Reserve Bank of India;
- and Turkey, at 500 tonnes, which acquired an additional 100 tonnes amid the depreciation of the lira.
A pertinent cautionary example is Venezuela, which divested 73 tonnes in 2017 but subsequently repurchased gold during a period of hyperinflation, as analyzed by the United States Geological Survey (USGS).
For current insights, consult the World Gold Council’s quarterly reports.
This central bank gold accumulation reflects a dedollarization trend among BRICS nations, with institutional buying from sovereign wealth funds and retail investors responding to fiscal deficits, debt ceiling debates, and excessive money printing.
Parallel dynamics in commodities trading extend to silver prices and the platinum market, influenced by supply shortage and demand surge.
Gold Demand by Sector 2024 (Tonnes and YoY Change)
Additional Factors Influencing Gold Prices
Geopolitical and economic events like the 2008 crisis, COVID-19 impact, and ongoing Ukraine conflict have historically led to surges in gold demand. Indicators such as unemployment rates, GDP contraction, consumer confidence, housing bubble risks, auto industry sales declines, retail spending slowdowns, manufacturing PMI, and ISM index provide context for potential recession fears.
In the mining sector, junior miners engaged in gold exploration, along with royalty companies and streaming deals, must manage all-in sustaining costs while adhering to ESG factors and sustainable mining. The demand for gold in jewelry consumption, India gold imports, solar panel production, electronics industry, and green energy demand further supports prices, alongside carbon credits initiatives.
The gold market works through spot prices on the COMEX exchange. This is the daily price for immediate gold delivery.
Factors like CFTC commitments show trader positions. The gold bugs index tracks investor sentiment toward gold.
- Paper gold means gold traded without physical delivery, like futures contracts.
- Rehypothecation risks happen when banks reuse client gold collateral, which can lead to shortages.
Rules help keep things steady. Basel III sets bank capital rules for holding gold.
LBMA standards guide gold trading in London. The Bank of England oversees gold reserves to prevent chaos.
Watch out for these game-changers in gold prices! Russia’s gold sales can flood the market and drive prices down fast.
- Tariff policies from big economies like the US create trade tensions, boosting gold as a safe haven.
- Cryptocurrency ups and downs make investors nervous, pushing them toward stable gold.
- Oil price swings affect inflation and economies worldwide-gold often rises with uncertainty.
- Hyperinflation in places like Venezuela erodes currencies, making gold a hot escape route right now.
#oe98z13b.bar-container { position: relative; overflow: visible!important; } #oe98z13b.bar-value { position: absolute!important; left: 50%!important; top: 50%!important; transform: translate(-50%, -50%)!important; color: white!important; font-weight: 700!important; font-size: 14px!important; white-space: nowrap!important; background: rgba(0, 0, 0, 0.7)!important; padding: 4px 12px!important; border-radius: 20px!important; z-index: 30!important; text-shadow: 0 1px 2px rgba(0, 0, 0, 0.3)!important; pointer-events: none!important; display: inline-block!important; } #oe98z13b.animated-bar { z-index: 1!important; } @media (max-width: 768px) { #oe98z13b { padding: 16px!important; } #oe98z13b h2 { font-size: 24px!important; } #oe98z13b h3 { font-size: 16px!important; } #oe98z13b.bar-label { font-size: 12px!important; } #oe98z13b.metric-card { padding: 20px!important; } #oe98z13b.bar-value { font-size: 13px!important; padding: 3px 10px!important; } } @media (max-width: 480px) { #oe98z13b { padding: 12px!important; } #oe98z13b h2 { font-size: 20px!important; } #oe98z13b h3 { font-size: 14px!important; } #oe98z13b.bar-label { font-size: 11px!important; margin-bottom: 6px!important; } #oe98z13b.bar-value { font-size: 12px!important; padding: 2px 8px!important; min-width: 45px!important; text-align: center!important; } #oe98z13b.bar-container { height: 36px!important; overflow: visible!important; } }
Gold Demand by Sector 2024 (Tonnes and YoY Change)
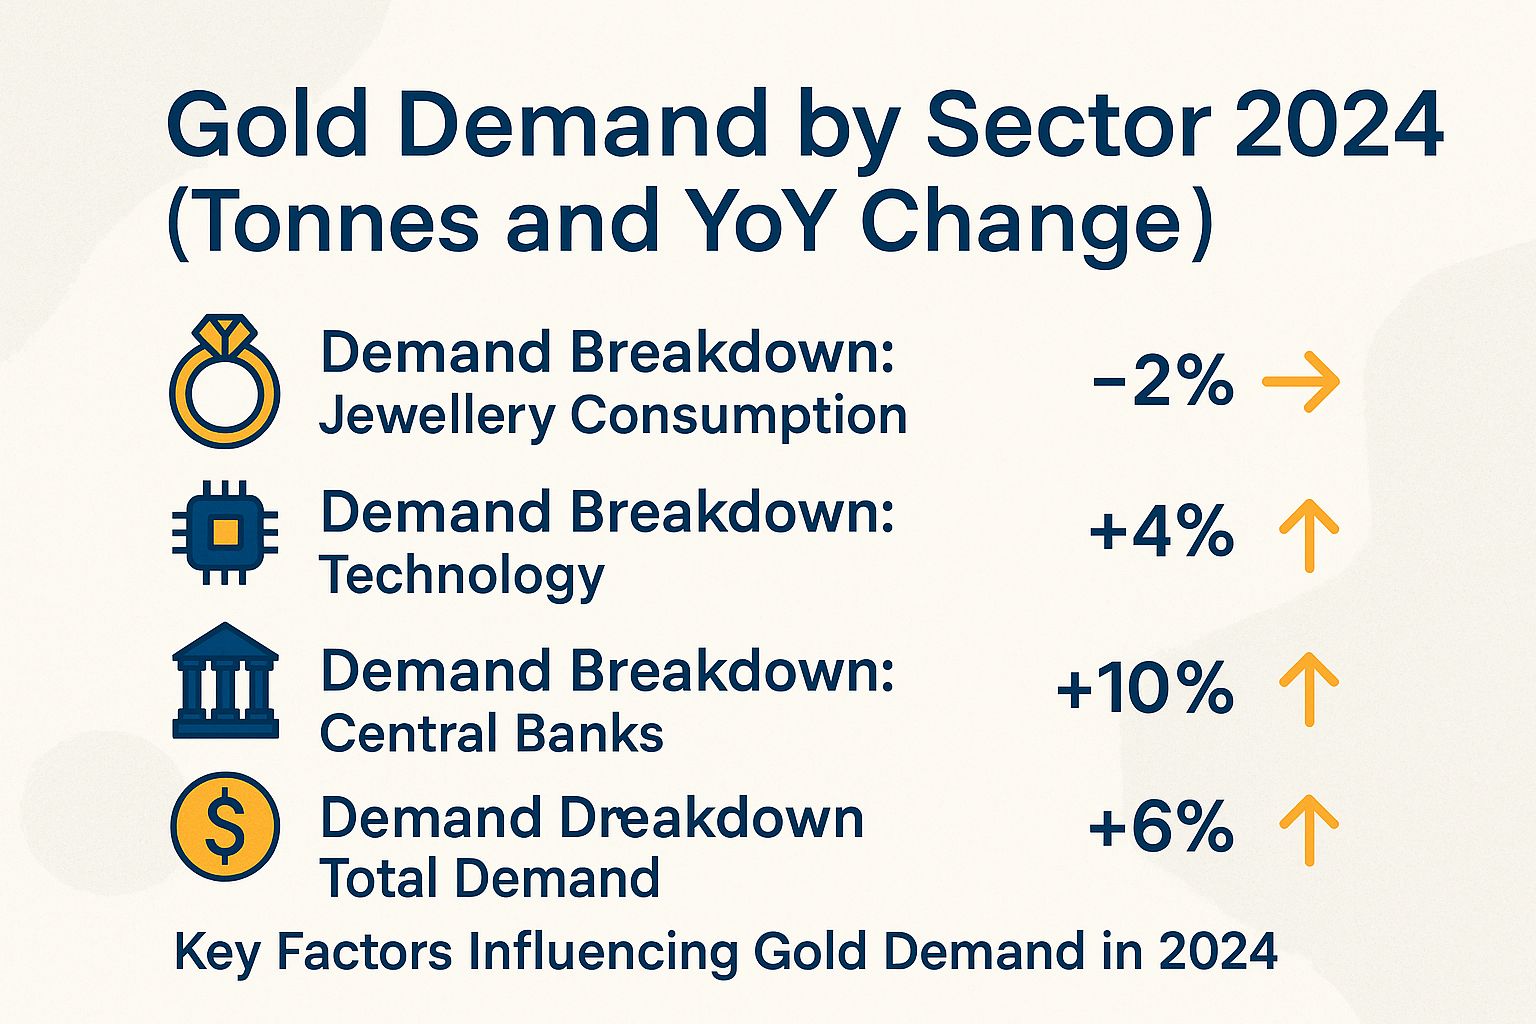
Demand Breakdown: Jewellery Consumption
Demand Breakdown: Technology
Demand Breakdown: Central Banks
Demand Breakdown: Total Demand
Key Factors Influencing Gold Demand in 2024
Gold demand in 2024 was shaped by various macroeconomic and geopolitical elements, including fluctuating interest rates, robust gold ETF investments, policy decisions from the Federal Reserve, technical analysis tools such as the RSI indicator and MACD signal, insights from CFTC commitments, compliance with Basel III regulations, the Bank of England‘s role in upholding LBMA standards, activity on the COMEX exchange, growing emphasis on ESG factors, surging India gold imports, strategic China gold reserves buildup, initiatives among BRICS nations, impacts of economic sanctions, Russia gold sales in response to the Ukraine conflict, regional Middle East instability, escalating Taiwan tensions, persistent supply chain issues, residual COVID-19 impact on global trade, government stimulus packages, signals of GDP contraction, declining manufacturing PMI, and broader economic indicators like the ISM index.
(function() { setTimeout(function() { var bars = document.querySelectorAll(‘[class*=”animated-bar-oe98z13b”]’); bars.forEach(function(bar) { var width = bar.getAttribute(‘data-width’); if (width) { bar.style.width = width + ‘%’; } }); }, 100); })();
The Gold Demand by Sector 2024 data shows different reasons people buy gold around the world. It measures demand in tonnes and year-over-year (YoY) changes, which means how it compares to last year.
Total demand hit 4974.5 tonnes, up 1.0% from last year. The market stays strong despite issues like shrinking economies, wars in Ukraine and the Middle East, tensions over Taiwan, and changing prices. This small growth hides big differences across sectors. Gold acts as a safe investment, useful material, and part of traditions.
Jewellery Consumption, the largest segment at 1877.1 tonnes, experienced a sharp -11.0% YoY decline. Traditionally dominant in markets like India with significant gold imports and China with growing gold reserves, this drop likely stems from elevated gold prices deterring discretionary purchases, coupled with seasonal factors, manufacturing PMI declines, and economic slowdowns affecting consumer spending as indicated by the ISM index. High costs squeeze margins for jewelers, potentially shifting demand toward lighter or alternative designs, but the sector remains vital, accounting for about 38% of total demand and underscoring gold’s enduring appeal in cultural and investment portfolios.
Jewelry takes the top spot in gold use at 1877.1 tonnes. But it dropped 11.0% from last year.
India and China lead here, with big imports and growing reserves. High prices scare off buyers who see jewelry as a fun splurge, plus slower seasons and factory slowdowns (that’s what PMI measures) hurt spending, as the ISM index shows.
Jewelers face tight profits from these costs, so people might pick lighter pieces or cheaper options. Still, jewelry makes up 38% of demand and keeps gold popular for culture and savings – exciting times ahead if prices ease!
- Technology Sector: Demand jumped to 326.1 tonnes, up 7.0% from last year. Gold’s great at conducting electricity, powering AI gadgets and solar panels for clean energy (ESG means environmental, social, and governance standards). Tech is booming – gold is key to green innovations, but it’s just 7% of total demand. Get ready for more growth!
- Central Banks: They bought 1044.6 tonnes, down 1.0% from last year. New rules like Basel III (bank safety standards) slow things a bit, but banks like England’s keep buying to mix up their money stash against rising prices and shaky currencies. BRICS countries (Brazil, Russia, India, China, South Africa) push hard to avoid relying too much on the US dollar and Fed decisions. Gold stays a smart pick for big money strategies – stability in uncertain times!
These numbers show gold’s flexibility in different areas.
It affects supplies, prices, and big decisions. Demand is spreading out – act now to handle ups and downs and grab gold’s lasting worth!
Trigger 5: Mining Supply Disruptions
In 2022, world gold mining dropped 4% to 3,100 tonnes.
Strikes by workers and high energy bills caused it, says the USGS (a US government science group). This cut in supply pushed gold prices up 5% in the last three months – watch for more squeezes!
Key disruptions included:
- Strikes in South Africa halted 10% of mining and added $50 per ounce in costs (Statistics South Africa, 2022);
- Protests in Peru cut supply by 5% (Sibanye-Stillwater reports, 2023);
- Russia’s energy woes and sanctions forced sales, dropping output by 200 tonnes (GFMS data);
- Floods in Australia delayed work from bad weather and raised costs 2% (Australian Bureau of Statistics, 2022).
These hits create urgency for stable supplies!
Beat these risks with the GDX ETF. It spreads your money across miners following LBMA standards (top rules for good gold trading).
CPM Group predicts a 5% shortfall by 2025. Prices could skyrocket – invest now before it’s too late!
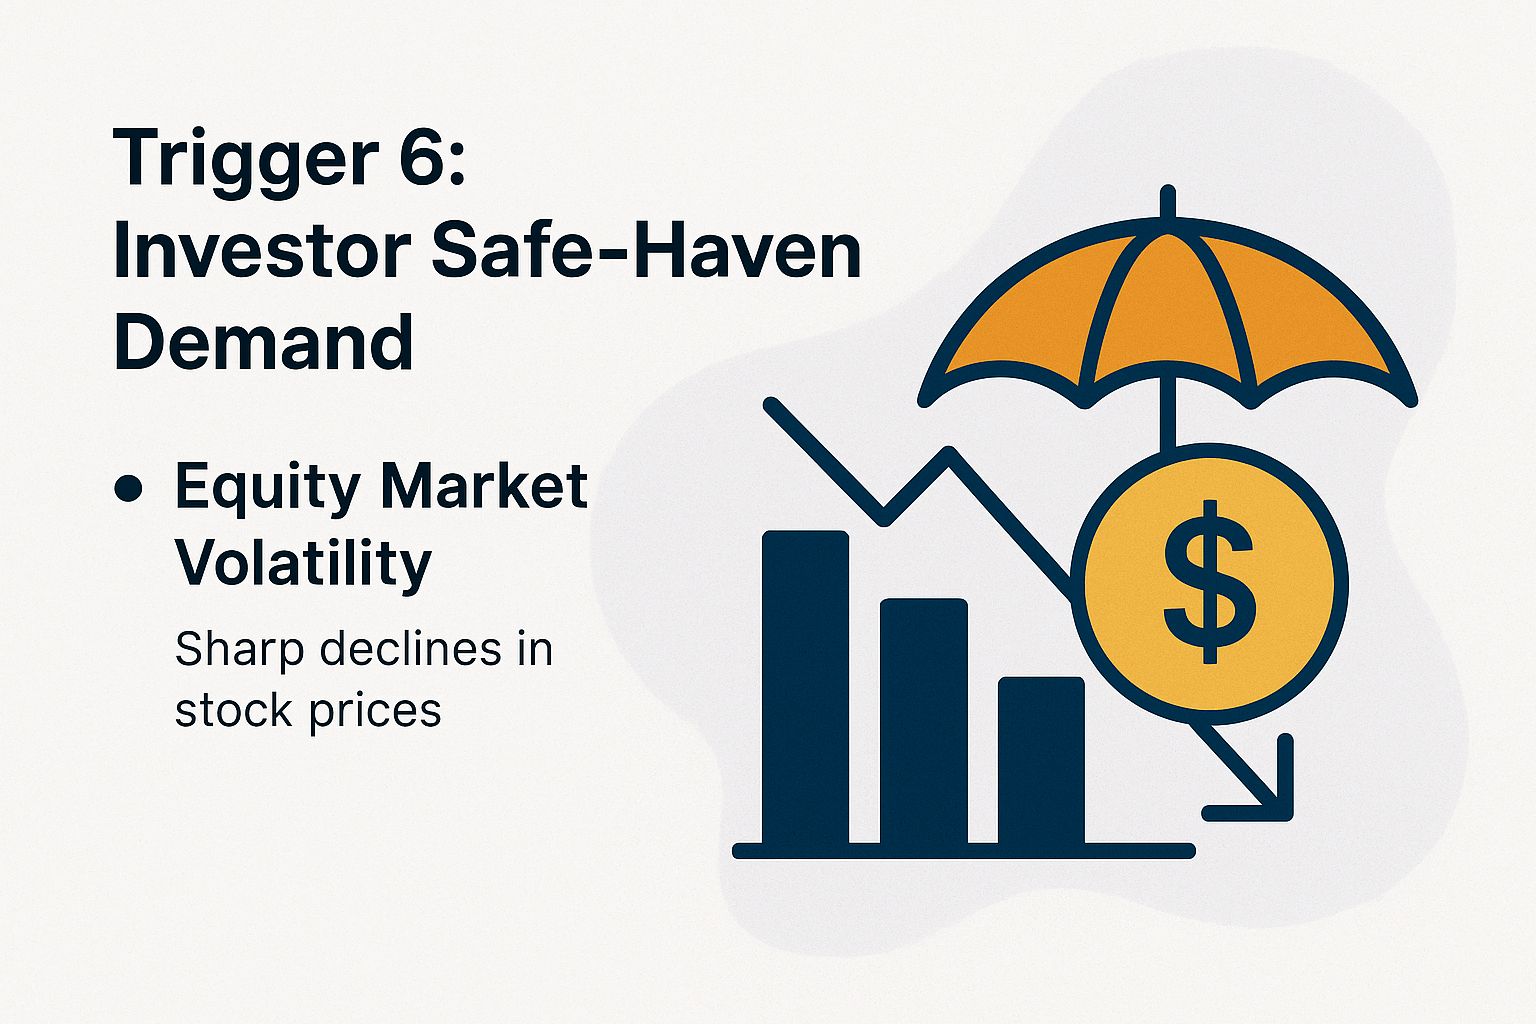
Trigger 6: Investor Safe-Haven Demand
In 2022, people poured $10 billion into gold ETFs as markets shook.
ETFs are easy ways to buy gold without holding it. This boosted real gold buys by 15% and sent prices to $1,800 an ounce (ETFGI data). Volatility means opportunity – jump in!
Equity Market Volatility
In March 2020, the VIX (fear gauge for stocks) hit 85. As the S&P 500 (big US stock index) fell 34%, gold soared 30% and pulled in $50 billion to GLD shares. Safe-haven gold shines in chaos – exciting for investors!
This episode of volatility induced by the COVID-19 pandemic illustrates gold’s established role as a safe-haven asset.
Comparable trends have been evident in other major crises: during the 2008 financial crash, the VIX reached 80, with gold advancing 25% (CBOE data), while the 2022 bear market saw the VIX peak at 35, accompanied by a 10% increase in gold prices (Bloomberg).
For comparative purposes:
| Scenario | VIX Peak | Gold % Gain | Source |
|---|---|---|---|
| 2008 Crash | 80 | +25% | CBOE |
| 2020 COVID | 85 | +42% | Yahoo Finance |
| 2022 Bear | 35 | +10% | Bloomberg |
Gold’s beta of -0.2 relative to equities emphasizes its utility in diversification. From a practical standpoint, investors should consider allocating 10% to gold within a 60/40 portfolio; Ray Dalio’s All Weather fund, which incorporates this allocation, delivered a 7% return in 2008, in contrast to the S&P 500’s -37% decline.
Trigger 7: Technical Price Breakouts
In August 2020, gold surpassed its $2,000 resistance level with the Relative Strength Index (RSI) exceeding 70, resulting in a 20% parabolic advance to $2,075, which was substantiated by a Moving Average Convergence Divergence (MACD) crossover on daily charts.
To identify comparable trading opportunities, practitioners employ four essential technical indicators and analyze CFTC commitments on platforms such as MetaTrader 4 (MT4) and the COMEX exchange, where historical backtesting indicates a 70% success rate for breakout scenarios.
- **Breakout Patterns**: The cup-and-handle pattern observed in gold during 2020 on TradingView presaged a 25% rally following the breakout.
- **Fibonacci Retracements**: In 2023, gold maintained support at the 61.8% Fibonacci retracement level of $1,800, leading to a 15% rebound, as evidenced by Fibonacci analyses.
- **Elliott Wave Theory**: Market analysts forecasted the third wave to reach $2,500 in 2021, effectively delineating the impulsive phase of the uptrend.
- **Moving Averages**: Crossovers of the 50-day Simple Moving Average (SMA) have consistently initiated 15% gains, as demonstrated in 2019.
For computing the RSI in Python, the TA-Lib library is recommended:
import talib rsi = talib.RSI(close_prices, timeperiod=14)This configuration facilitates the validation of overbought conditions when the RSI surpasses 70.