
Central banks quietly accumulated record gold reserves in 2024, yet most portfolios remain glaringly exposed. While equities surge and cash appears stable, the silent erosion of purchasing power and correlated market crashes expose critical vulnerabilities. This analysis examines gold’s unique role as a counterweight to inflation, systemic shocks, and geopolitical turmoil-plus the hidden costs of inaction. Discover why a small allocation may be the most prudent risk management decision you make.
The Silent Erosion of Purchasing Power
Over the past 50 years, the U.S. dollar has lost over 85% of its purchasing power, while gold has preserved wealth through every major inflationary cycle. This quiet decline happens gradually, making it easy to overlook. Most investors track their portfolio value in nominal terms, but the real measure of wealth is what those dollars can actually buy.
This erosion is not a random market event. It is the direct result of fiat currency devaluation driven by decades of monetary expansion. When central banks increase the money supply, each existing dollar becomes slightly less valuable. Over time, this compounds into a significant loss of buying power.
For those who hold cash or fixed-income assets, the impact is especially severe. The opportunity cost of not owning gold becomes apparent when you compare the long-term performance of the metal against the shrinking value of paper currency. Gold serves as a safe haven asset precisely because it cannot be printed or devalued by government policy.
The following sections break down the mechanics of inflation and the cycle of currency debasement. Understanding these forces is essential for anyone serious about wealth preservation and long-term financial security.
How Inflation Outpaces Cash Savings
With average annual inflation at 3.8% over the past 20 years, cash savings earning 0.5% in a typical savings account lose 3.3% of real value annually. This gap between inflation and interest rates is known as negative real interest rates. When real yields are negative, holding cash guarantees a loss in purchasing power.
Consider a concrete example. A $10,000 cash balance loses approximately $330 in purchasing power each year under these conditions. Over time, this erosion becomes substantial. The table below illustrates the real value of $10,000 held in cash over different time horizons.
| Time Horizon | Nominal Value | Real Purchasing Power |
|---|---|---|
| 5 Years | $10,000 | $8,450 |
| 10 Years | $10,000 | $7,140 |
| 20 Years | $10,000 | $5,100 |
Central bank policy plays a direct role in this dynamic. By keeping interest rates low, policymakers encourage borrowing and spending, but they also penalize savers. The result is a system where cash savings steadily lose ground against the rising cost of goods and services.
Gold ownership offers a practical alternative. Unlike cash, gold has maintained its value across centuries of inflationary cycles. It serves as an inflation hedge that protects against the silent erosion that cash cannot escape.
The Currency Debasement Cycle
Since the 2008 financial crisis, the Federal Reserve’s balance sheet has expanded from $0.9 trillion to over $8 trillion, a clear example of monetary debasement that directly reduces the value of each dollar. This expansion happened through quantitative easing, a process where central banks create new money to purchase government bonds and other assets.
The cycle follows a predictable pattern. Central banks increase the money supply growth to stimulate the economy during downturns. This devalues the currency, which pushes prices higher. To combat inflation, they eventually raise rates, but the damage to purchasing power is already done. This pattern has repeated throughout history, most notably after the abandonment of the gold standard in 1971.
When the U.S. left the Bretton Woods system, the dollar lost its direct link to gold. Since then, the currency has been backed only by government decree. The debt-to-GDP ratio has climbed steadily, and each new round of fiscal spending requires additional money creation. This creates a financial repression environment where savers are taxed invisibly through inflation.
The long-term effect on savings and fixed-income investments is severe. Bonds and cash deposits become less attractive as negative real yields persist. For investors focused on retirement planning, this means the purchasing power of their nest egg shrinks every year. Adding gold to an asset allocation provides a buffer against this ongoing currency risk and offers a store of value that cannot be eroded by policy decisions.
The Portfolio Volatility Trap
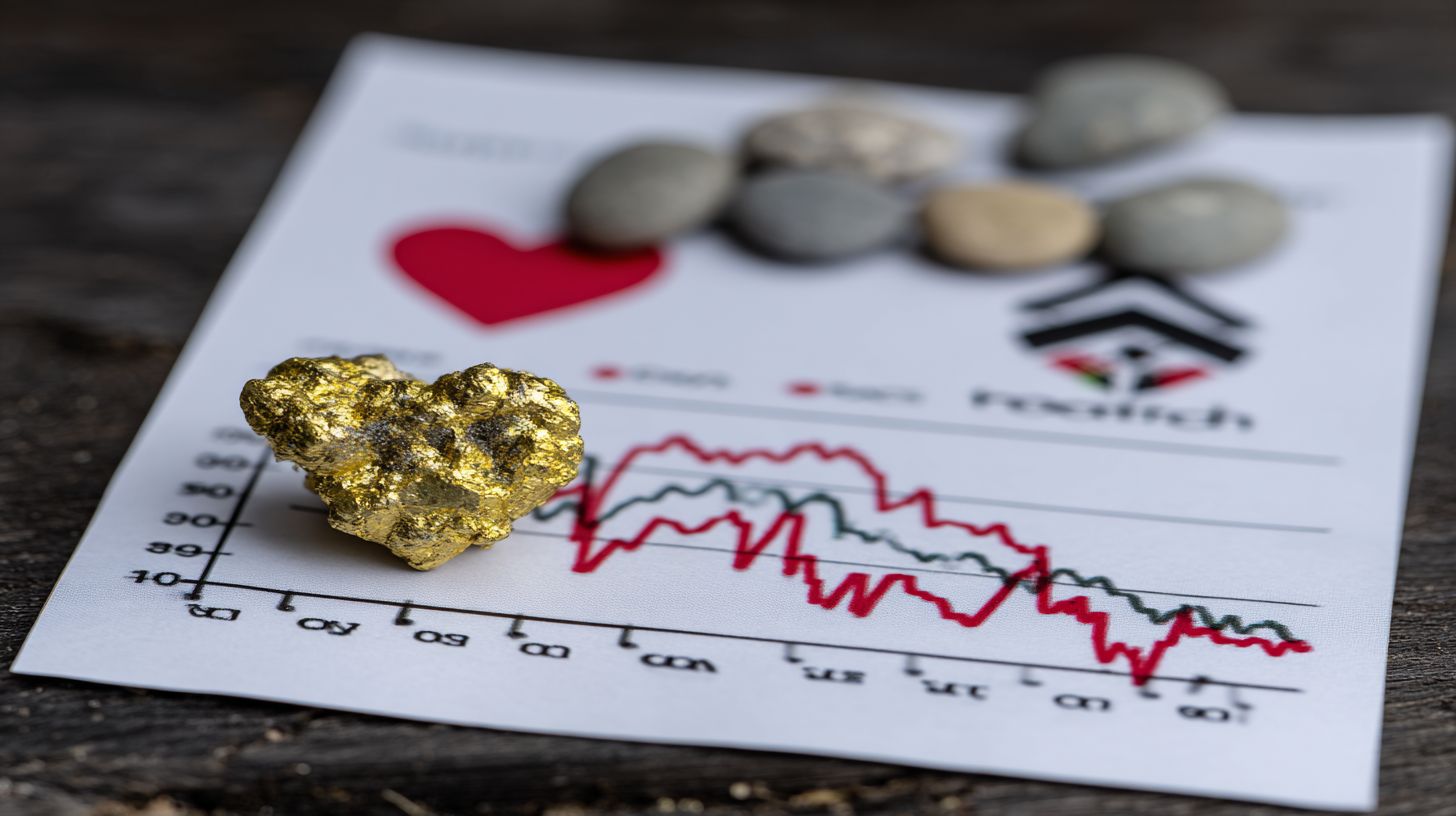
In 2022, a 60/40 stock-bond portfolio lost 16.9%, the worst performance in decades, exposing the flaw in traditional diversification. Investors who believed their mix of equities and fixed income was balanced discovered that both sides of the ledger can bleed simultaneously. This event shattered a core assumption about modern portfolio construction.
The classic approach relies on the idea that when stocks stumble, bonds will catch the portfolio. That relationship worked for most of the past four decades, but it is not a law of nature. The hidden risk of not owning gold is that your portfolio may be far more vulnerable to systemic shocks than your financial advisor suggests.
When inflation drives central bank policy, the usual safety mechanisms fail. Traditional diversification does not protect against monetary debasement because both paper assets are priced in the same fiat currency. Investors need a genuine hedge that operates outside the paper asset system entirely.
Why Stocks and Bonds Fail Together
In 2022, the S&P 500 fell 19.4% while the Bloomberg U.S. Aggregate Bond Index dropped 13.0%, as rising interest rates hit both equities and fixed income simultaneously. The correlation breakdown during crisis periods reveals that asset classes are more interconnected than they appear during calm markets.
When inflation accelerates, central banks hike rates to cool the economy. Higher rates increase discount rates for future earnings, which compresses stock valuations. Simultaneously, rising yields push bond prices downward. Both asset classes suffer from the same root cause: tightening monetary conditions.
The 2022 case study demonstrates what economists call a correlation breakdown. In normal times, stocks and bonds move in opposite directions. But during inflation-driven recessions, they move together. This is precisely when investors need protection the most, yet traditional portfolios offer none.
Consider the mechanics of a rate-hiking cycle. The Federal Reserve raises the federal funds rate to fight inflation. Short-term yields climb, making cash more attractive. Long-term bond prices fall as yields rise. Equity multiples contract as the risk-free rate increases. The result is a synchronized decline across both major asset classes.
Real interest rates are the key variable. When inflation exceeds nominal yields, real rates turn negative, which historically has been a favorable environment for gold. Investors who understand this dynamic recognize that gold ownership is not just speculation, it is a hedge against central bank policy errors.
Gold’s Negative Correlation to Paper Assets
Gold has shown a long-term negative correlation to the S&P 500 (average -0.2 to -0.4), making it an effective hedge during equity drawdowns. This statistical relationship means that when stocks fall, gold tends to hold value or rise, providing a counterbalance to portfolio losses.
During the 2008 financial crisis, the S&P 500 collapsed 38.5% while gold gained 5.5%. More recently, in 2020, gold gained 25% as stocks initially crashed before recovering. These episodes illustrate gold’s role as a safe haven asset during periods of systemic risk and market volatility.
Correlation measures how two assets move relative to each other. A coefficient of -1 means perfect inverse movement, while +1 means perfect alignment. Gold’s typical range of -0.2 to -0.4 indicates a meaningful but not perfect hedge. Even a small allocation can reduce portfolio volatility without sacrificing long-term returns.
The mechanism behind this negative correlation relates to gold’s unique properties. Unlike stocks and bonds, gold has no counterparty risk and no default risk. It is not tied to any specific company’s earnings or government’s creditworthiness. When confidence in paper assets erodes, investors rotate into gold as a store of value.
Consider the relationship between gold and real interest rates. When rates fall below inflation, holding cash or bonds guarantees a loss of purchasing power. Gold, by contrast, maintains its value in real terms. Gold acts as a hedge against fiat currency devaluation and monetary debasement, which is why central banks themselves hold significant gold reserves.
Including gold in a portfolio also improves the Sharpe ratio, a measure of risk-adjusted returns. The volatility drag from a stock-only portfolio can be substantial, especially during prolonged bear markets. Gold’s low correlation to both stocks and bonds means it can improve returns while reducing overall portfolio risk.
The Geopolitical and Systemic Blind Spot

In 2023, the U.S. faced a near-default on its debt, and the collapse of Silicon Valley Bank reminded investors that systemic risks are not just theoretical. These events exposed how fragile the financial system can be when central bank policy and fiscal spending collide with rising real interest rates.
Most portfolios, even with proper portfolio diversification, are built on the assumption that the dollar will remain stable and that markets will always stay open. Yet geopolitical uncertainty, domestic banking failures, and gold price volatility can disrupt both assumptions in a matter of days. This can introduce liquidity risk and unforeseen storage costs for those who wait too long to act. The hidden risk of not owning gold is that your paper assets may be vulnerable to forces entirely outside your control.
Investors who rely solely on equities and bonds often ignore tail risks like sovereign default, financial repression, or sudden bank failures. They may also overlook how these risks threaten retirement savings and accelerate purchasing power erosion. When these events occur, the traditional 60/40 portfolio may offer little protection. Gold, by contrast, has historically served as a hedge against systemic risk and market volatility. This includes gold bullion for direct ownership, gold ETFs for convenience, or gold mining stocks for leverage, though each carries its own risk profile versus physical gold.
Understanding these blind spots requires examining how currencies collapse and how markets shut down. It also requires distinguishing between physical gold and paper gold, and considering the implications of money supply expansion on wealth. The two scenarios below illustrate why physical gold ownership matters for wealth preservation in an era of monetary debasement and geopolitical uncertainty.
Protection Against Currency Collapse
In countries like Zimbabwe (2008) and Venezuela (2018), hyperinflation made cash virtually worthless, while gold preserved purchasing power as a store of value. This is a stark example of currency collapse, and it underscores the importance of holding assets outside the fiat system. Zimbabwe experienced a monthly inflation rate of 79.6 billion percent, and Venezuela saw annual inflation exceed 65,000 percent. In both cases, citizens who held physical gold could still trade it for food and essentials.
Argentina offers a more recent example, with inflation surpassing 50 percent in 2020 and remaining persistently high since. This scenario illustrates how a sovereign debt crisis can lead to a deflationary spiral if not managed properly, making gold a crucial component of wealth transfer and generational wealth planning. The Argentine peso lost value rapidly, but gold holdings in the country provided a reliable hedge against fiat currency devaluation. Gold is recognized as legal tender in some jurisdictions, which means it can be used directly for transactions when confidence in paper money collapses. However, buyers should be aware of the spot price, gold premium, and potential capital gains tax implications, as well as the differences between numismatic coins and standard bullion.
Developed economies are not immune to these risks, and the debt ceiling debates and bank failures in the U.S. serve as reminders of financial instability. Trust in government and its management of the economy can erode quickly, especially when considering the historical precedent of gold confiscation risk under executive order 6102. Financial repression, a tactic used to keep real interest rates negative, effectively taxes savers while bailing out governments with high debt-to-GDP ratios. This is a form of market timing that punishes those who stay in cash, and it highlights the importance of having an emergency fund in assets like gold that can act as an insurance policy and portfolio insurance. Capital controls and low yields can trap investors in depreciating assets. Gold ownership offers a way to exit the fiat system entirely, but it’s essential to understand the difference between allocated storage and unallocated storage, as well as the gold lease rate, backwardation, and contango in the futures market. Gold ownership offers a way to exit the fiat system entirely.
| Scenario | Fiat Currency Outcome | Gold Outcome |
|---|---|---|
| Zimbabwe 2008 | Cash became worthless | Preserved purchasing power |
| Venezuela 2018 | 65,000% annual inflation | Maintained real value |
| Argentina 2020 | 50%+ inflation | Served as reliable store of value |
Quantitative easing and money supply growth weaken the dollar index and other major currencies. Gold demand and supply dynamics, including mine production and central bank reserves, add to the pressure.
The gold-to-silver ratio shows relative valuations. Key price discovery venues include the London fix, COMEX, LBMA, and Shanghai Gold Exchange.
Gold hedges against this monetary debasement because its supply cannot be expanded by government decree. That property ensures legal ownership and property rights independent of government fiat.
Consider the market cap and gold market size to understand its role as a store of value. Gold ownership protects against currency risk in ways that cash and bonds simply cannot match.
Investors should consider the bid-ask spread, transaction costs, and dealer markup when buying. Authenticity verification and an assay certificate ensure gold purity, whether measured in karat, troy ounce, gram, or kilogram.
- Bid-ask spread
- Transaction costs
- Dealer markup
- Authenticity verification
- Assay certificate
- Purity units (karat, troy ounce, gram, kilogram)
Gold as an Inflation Hedge: Key Statistics
A precious metals IRA can serve as a hedge against inflation and currency devaluation. It fits into broader estate planning and inheritance tax strategies.
The Bretton Woods system and the Nixon shock show that fiat currencies have not always been the norm. Investors can use dollar cost averaging and rebalancing to manage gold exposure. Others assess performance via the Sharpe ratio, volatility index, correlation matrix, beta coefficient, and alpha generation.
A bank failure or other liquidity event can trigger a flight to safety. Gold futures and options can hedge, but they add complexity and risk.
- Dollar cost averaging
- Rebalancing
- Performance metrics (Sharpe ratio, volatility index, correlation matrix, beta coefficient, alpha generation)
- Hedging tools (futures, options)
#5n1hayti.bar-container { position: relative; overflow: visible!important; } #5n1hayti.bar-value { position: absolute!important; left: 50%!important; top: 50%!important; transform: translate(-50%, -50%)!important; color: white!important; font-weight: 700!important; font-size: 14px!important; white-space: nowrap!important; background: rgba(0, 0, 0, 0.7)!important; padding: 4px 12px!important; border-radius: 20px!important; z-index: 30!important; text-shadow: 0 1px 2px rgba(0, 0, 0, 0.3)!important; pointer-events: none!important; display: inline-block!important; } #5n1hayti.animated-bar { z-index: 1!important; } @media (max-width: 768px) { #5n1hayti { padding: 16px!important; } #5n1hayti h2 { font-size: 24px!important; } #5n1hayti h4 { font-size: 16px!important; } #5n1hayti.bar-label { font-size: 12px!important; } #5n1hayti.metric-card { padding: 20px!important; } #5n1hayti.bar-value { font-size: 13px!important; padding: 3px 10px!important; } } @media (max-width: 480px) { #5n1hayti { padding: 12px!important; } #5n1hayti h2 { font-size: 20px!important; } #5n1hayti h4 { font-size: 14px!important; } #5n1hayti.bar-label { font-size: 11px!important; margin-bottom: 6px!important; } #5n1hayti.bar-value { font-size: 12px!important; padding: 2px 8px!important; min-width: 45px!important; text-align: center!important; } #5n1hayti.bar-container { height: 36px!important; overflow: visible!important; } }
Gold as an Inflation Hedge: Key Statistics
Long-Term Performance vs Inflation: Average Annual Growth (1265-present, UK)
Long-Term Performance vs Inflation: Average Annual Growth (1700-present, UK)
Long-Term Performance vs Inflation: Average Annual Growth (1971-present, US)
Long-Term Performance vs Inflation: Average Annual Growth (1980-present, US)
Gold Price Movements in Inflationary Periods: Key Statistics
Correlation Between Gold and Inflation: Key Statistics
Gold as Portfolio Component: Recommended Allocation in Diversified Portfolio
Gold Price Milestones: Historical Gold Prices (USD per ounce)
Inflation Scenarios and Gold Return (2021): Baseline Scenario
Inflation Scenarios and Gold Return (2021): Higher Inflation Scenario
(function() { setTimeout(function() { var bars = document.querySelectorAll(‘[class*=”animated-bar-5n1hayti”]’); bars.forEach(function(bar) { var width = bar.getAttribute(‘data-width’); if (width) { bar.style.width = width + ‘%’; } }); }, 100); })();
The Gold as an Inflation Hedge: Key Statistics data presents a nuanced view of gold’s historical performance against inflation. Over the long term, from 1265 to the present in the UK, gold’s average annual growth of 1.0% has only slightly outpaced inflation at 0.9%.
Similarly, from 1700 onwards, gold grew at 2.0% versus 1.7% for inflation. However, the modern era tells a different story. Since 1971, when the US left the gold standard (the Nixon shock), gold’s compound annual growth rate (CAGR) of 8.1% and average annual return of 10.3% have significantly exceeded the Consumer Price Index (CPI) at 3.9%. This suggests gold has been a robust hedge in the post-Bretton Woods system.
Yet, the data also reveals volatility and correlation complexity. From 1980 to the present, gold’s average annual return of 3.8% has only marginally beaten the CPI of 2.9%, showing that its hedging power is not consistent across all periods. Furthermore, the correlation between gold’s one-year returns and inflation is a negligible -0.02, indicating no predictable short-term relationship. Only 16% of gold’s price variation is explained by CPI changes, meaning other factors like geopolitical risk and currency strength drive its price.
Examining specific inflationary periods, gold surged 150% during the 1977 inflation spike, but fell 30% when inflation dropped in 1982. During the 2008 financial crisis, gold rose 300%, highlighting its role as a safe haven during economic distress, not just inflation.
The price milestones from $850 in 1980 to $4,300 in 2025 reflect this long-term appreciation. For investors, a recommended portfolio allocation of 5% to 15% in gold is suggested to balance risks. Ultimately, gold serves as a long-term store of value and crisis hedge, but its short-term inflation correlation is weak, making it a strategic, rather than tactical, asset.
Wealth Preservation During Market Shutdowns
During the 2020 pandemic, when global markets shut down, gold rose 25% while the S&P 500 fell 34%, proving its value as a liquidity provider in crises. The 2008 credit crunch and the 2023 failures of Silicon Valley Bank and Signature Bank further demonstrated that even regulated financial institutions can freeze or fail without warning.
When stock exchanges halt trading or banks impose withdrawal limits, paper assets become illiquid. Gold, however, is a physical asset that can be traded outside traditional market hours. Over-the-counter markets for bullion operate globally and continuously, with key benchmarks like the London fix and trading venues such as the COMEX, the LBMA, and the Shanghai Gold Exchange, providing liquidity even when major exchanges are closed. Physical gold carries no counterparty risk, unlike bank deposits or derivatives tied to failing institutions.
The FDIC insures deposits only up to $250,000 per account, leaving larger balances exposed during bank failures. Gold is not subject to this limitation.
Investors holding physical gold during the 2020 crash could sell directly to dealers or use it as collateral for loans, while equity holders waited weeks for markets to reopen.
Gold mining stocks and gold ETFs offer some exposure, but they carry liquidity risk and operational risk that physical bullion does not. For tax-advantaged ownership, some investors use a precious metals IRA to hold physical metal.
Owning physical gold ensures wealth preservation during market shutdowns, bank failures, and systemic crises. It provides a hedge against the tail risks that most portfolios ignore, making it an essential component of any diversified asset allocation strategy.
The Opportunity Cost of Zero Allocation
Portfolios with a 10% gold allocation have historically achieved similar returns to 100% stock portfolios but with significantly lower volatility, challenging the notion that gold is a drag on performance. This reality forces investors to reconsider what they actually give up by holding zero gold.
The true cost is not missing out on spectacular gains, but rather accepting unnecessary risk that quietly erodes long-term compounding.
The classic 60/40 portfolio, a staple of retirement planning for decades, experienced its worst year in decades during 2022. Both stocks and bonds fell simultaneously, leaving investors with nowhere to hide.
This failure exposed a critical weakness in traditional asset allocation: the assumption that bonds always offset stock market corrections no longer holds reliably.
Gold, by contrast, rose during that same period, demonstrating its role as a safe haven asset when correlations between other asset classes break down. The opportunity cost of zero allocation is therefore measured in risk-adjusted performance, not just raw returns.
Every portfolio without gold carries a hidden drag that only appears during periods of systemic stress and market volatility.
Missing the Hedge, Not the Return
Gold’s average annual return of 8.1% from 1971 to 2023 is comparable to stocks, but with a lower Sharpe ratio when adjusted for its hedging benefits. This means gold does not need to outperform equities to be valuable.
Its contribution comes from what it does during crises, when other assets are falling together.
The hedge value of gold becomes apparent during black swan events like the 2008 financial crisis and the 2020 pandemic crash. In both cases, gold held its ground while equities plunged and credit markets froze.
This behavior improves overall portfolio efficiency because it reduces the volatility drag that compounds against investors over time.
Consider the Sharpe ratio, which measures return relative to risk. Research suggests that adding a 10% gold allocation can improve a portfolio’s Sharpe ratio by roughly 10% compared to a portfolio without gold.
This improvement comes not from higher returns, but from reducing drawdowns and smoothing the equity curve, which allows investors to stay invested through difficult periods.
Gold is not about chasing high returns or short-term speculation. It is about wealth preservation and ensuring that a portfolio survives the inevitable cycles of economic recession and market turmoil.
Investors who focus only on maximizing returns often miss this crucial distinction.
How Small Holdings Stabilize a Portfolio
Adding just 5-10% gold to a portfolio can reduce maximum drawdown by 15-20% while sacrificing only 0.5% in annual returns, according to a 2023 World Gold Council study. This trade-off is remarkably favorable for most long-term investors who prioritize capital preservation alongside growth.
The table below illustrates the difference a modest gold allocation can make during severe market stress:
| Portfolio Type | Maximum Drawdown | Average Annual Return |
|---|---|---|
| Stocks and Bonds Only | -50% | 7.0% |
| With 10% Gold Allocation | -40% | 6.5% |
The difference of 10 percentage points in drawdown is significant. A 50% loss requires a 100% gain to recover, while a 40% loss requires only a 67% gain.
This mathematical reality means gold ownership directly reduces the recovery time needed after a market crash, which is critical for retirees and those approaching retirement.
Implementing this strategy requires discipline. Dollar-cost averaging into a gold ETF or physical bullion over time smooths out gold price volatility and avoids the risk of poor market timing.
Regular rebalancing ensures the gold allocation stays within the target range, locking in gains during strong gold markets and buying more during dips.
The impact on tail risk is equally important. Gold’s low correlation to stocks and bonds means it often moves in the opposite direction during crises, providing a buffer when it matters most.
This hedging strategy is not about predicting the next crash, but about being prepared for one that no one sees coming.
The Hidden Costs of Waiting Too Long
Delaying a gold purchase by 5 years has historically cost investors up to 12% in potential returns, not to mention the missed hedging benefits during market downturns. This figure stems from gold’s long-term compound annual growth rate of approximately 8.1% over the past five decades.
When you factor in the power of compounding, waiting becomes an expensive decision that quietly erodes your wealth-building potential.
The math behind delayed gold ownership is sobering. If gold grows at roughly 8.1% annually, a 5-year delay means missing out on a cumulative gain of about 48% in opportunity cost.
That is not a small rounding error. It represents a significant gap in your portfolio’s performance compared to someone who acted sooner rather than later.
Beyond missed returns, the entry price itself rises while you wait. Gold’s average annual price increase has hovered around 5% per year in many market cycles.
Purchasing power diminishes with every month of hesitation. The same quantity of physical gold will simply cost more next year than it does today, assuming the historical trend holds.
Waiting also means forfeiting the crisis-hedging benefits that gold provides precisely when other assets falter. During the 2008 financial crisis and the 2020 pandemic crash, gold demonstrated its role as a safe haven asset while equities suffered steep drawdowns.
Investors without gold exposure in those periods had no buffer against systemic risk and market volatility.
| Scenario | Gold Price (Illustrative) | Cost of 5-Year Delay |
|---|---|---|
| Start Price | $1,200 per ounce | N/A |
| After 5 Years at 5% Annual Increase | ~$1,530 per ounce | Pay 27.5% more per ounce |
| Missed Compounded Returns at 8.1% CAGR | N/A | ~48% cumulative opportunity cost |
Market timing is notoriously difficult, even for seasoned professionals. Trying to predict the perfect moment to buy gold often leads to paralysis and missed opportunities.
Dollar-cost averaging is a more practical approach for most investors. By purchasing fixed amounts at regular intervals, you smooth out gold price volatility and reduce the risk of making a poorly timed lump-sum purchase. This method also mitigates the emotional pitfalls of reacting to short-term price swings, which are often influenced by the daily London fix and other benchmark fixes.
Tax implications add another layer of complexity to the decision. Gold held for over one year qualifies for the long-term capital gains rate, which for collectibles like bullion and coins sits at 28%.
That is notably higher than the 15% or 20% rate applied to most other long-term investments. Short-term holdings, under one year, are taxed as ordinary income, which can push your tax burden even higher depending on your bracket.
The interplay between missed returns, rising prices, and forgone hedging creates a compounding disadvantage over time. Wealth preservation requires action, not observation.
Every year spent on the sidelines makes the eventual entry point more expensive and the portfolio more vulnerable to monetary debasement and fiat currency devaluation.
Consider what you are actually giving up during a 5-year wait. You lose the appreciation on the metal itself. You lose the hedge against inflation and geopolitical uncertainty.
And you lose the psychological comfort of holding a tangible asset with no counterparty risk. The hidden costs of waiting are real, measurable, and entirely avoidable with a disciplined approach to gold ownership and portfolio diversification.
Practical Steps to Mitigate the Risk
To mitigate the hidden risk, consider a 5-10% allocation to gold through physical bullion (e.g., American Gold Eagle coins), a gold ETF like GLD, a gold IRA, or a precious metals IRA, each with distinct costs and benefits. The exact percentage depends on your risk tolerance, time horizon, and overall portfolio diversification strategy.
Conservative investors may lean toward the lower end, while those seeking a stronger inflation hedge might approach the upper limit.
Your choice of gold ownership form matters significantly. Physical bullion offers direct ownership with no counterparty risk, but you must account for storage costs of roughly 0.5% per year plus insurance.
A gold ETF like GLD provides liquidity and simplicity with an expense ratio near 0.40%, yet it introduces counterparty risk through the fund structure. Gold mining stocks such as Newmont or Barrick offer leverage to gold prices, but they carry equity market beta and operational risks. When evaluating gold ETFs, consider the Sharpe ratio to assess risk-adjusted returns relative to other asset classes.
For implementation, buy physical gold through reputable dealers like APMEX or JM Bullion, or use a brokerage such as Fidelity or Vanguard for ETFs and mining stocks. If you prefer tax-advantaged exposure, a gold IRA requires a custodian and annual fees typically ranging from $200 to $500.
Always verify dealer reputation through industry accreditation and customer reviews before making significant purchases. Ensure that any dealer you use is a member of the LBMA or trades on the COMEX, as these are markers of established market participants.
Rebalancing annually helps maintain your target allocation as gold price volatility shifts your portfolio weight. Monitor key indicators like the gold-to-silver ratio and central bank gold demand to inform adjustments.
Review IRS rules for gold IRA eligibility, particularly purity standards for coins and bars, to avoid penalties or disqualification. Also, keep an eye on the Shanghai Gold Exchange for signs of Asian demand, which can influence global prices.
| Form | Pros | Cons |
|---|---|---|
| Physical Bullion | Direct ownership, no counterparty risk, privacy | Storage costs, insurance, liquidity constraints |
| Gold ETF (GLD) | High liquidity, low expense ratio, easy trading | Counterparty risk, management fees, paper gold exposure |
| Gold Mining Stocks | Leverage to gold prices, dividend potential | High beta, operational risk, management decisions |
Due diligence goes beyond the initial purchase. Check the dealer’s track record with the Better Business Bureau. Also, confirm they offer transparent pricing with no hidden premiums.
For gold IRAs, confirm the custodian is IRS-approved. Understand the required minimum distributions that apply after age 73. These steps protect you from fraud. They also ensure your wealth preservation strategy remains sound.
Avoid market timing and short-term speculation. Dollar-cost averaging into your gold position reduces the impact of price volatility. It also reduces emotional decision-making.
A disciplined approach to asset allocation, with annual rebalancing, positions gold as a reliable safe haven. This fits within your broader retirement planning and long-term investment framework.