The Truth About Gold’s Role in a Portfolio
Gold has fascinated people since ancient times. It stood for wealth and stability during tough periods.
Today, with rising inflation and global tensions, investors seek gold for strong portfolios. It helps protect wealth in uncertain markets.
This article covers gold’s history, benefits against inflation, diversification perks, risks, myths, and smart ways to add it to your investments. See how gold can secure your financial future! Get ready to uncover gold’s power!
Historical Performance of Gold as a Long-Term Investment

Gold has shown strong resilience over time. From 1971 to 2023, it averaged 7.8% annual returns, beating inflation but lagging stocks in good markets, per London Bullion Market Association data.
Key Milestones
Big events shaped gold’s market, like the 1971 Nixon Shock: the U.S. decision to leave the gold standard, making the dollar a fiat currency not backed by gold.
President Nixon ended the gold standard, stopping dollar-to-gold swaps. This caused gold prices to jump from $35 to $850 per ounce by 1980, fueled by oil crises and inflation.
Key milestones in the evolution of gold prices include the following:
- 1971 Nixon Shock: The termination of the gold standard led to a 200% price increase by 1974 (International Monetary Fund data).
- 1980 Peak: Gold prices reached $850 per ounce amid stagflation (Federal Reserve reports).
- 2000-2011 Bull Market: Prices rose from $250 to $1,900 per ounce following the dot-com crash (World Gold Council).
- 2008 Financial Crisis: Gold achieved a 25% gain as a safe-haven asset (COMEX records).
- 2020 COVID-19 Surge: Prices peaked at $2,075 per ounce during global lockdowns (London Bullion Market Association).
- 2022 Ukraine Invasion: A 10% price increase resulted from heightened geopolitical risks (Bloomberg analysis).
| Year | Event | Price Impact |
|---|---|---|
| 1971 | Nixon Shock | 200% increase by 1974 |
| 1980 | Peak | $850/oz |
| 2000 | Bull Market | Rose from $250 to $1,900 by 2011 |
| 2008 | Financial Crisis | 25% gain |
| 2020 | COVID-19 Surge | Peaked at $2,075/oz |
| 2022 | Ukraine Invasion | 10% increase |
These spikes show gold’s thrilling potential-act now to include it!
Other Factors
- Since 2008, central banks buy more gold than they sell for reserves (IMF data).
- Jewelry demand
- Industrial uses
- Speculation
- Mining decline affecting stocks
Long-Term Returns
In 50 years, gold grew at 7.9% yearly. Its Sharpe ratio-a measure of return per risk unit-is 0.45, close to the S&P 500’s 0.52, showing solid performance in volatile times (Morningstar data). It also beats inflation with positive extra returns.
| Period | Gold Return | S&P 500 Return | Inflation-Adjusted Gold | Source |
|---|---|---|---|---|
| 10-year (2014-2023) | 5.2% | 12.8% | 2.1% | NYU Stern |
| 20-year (2004-2023) | 8.1% | 9.5% | 5.3% | NYU Stern |
| 50-year (1971-2023) | 7.9% | 10.2% | 4.5% | NYU Stern |
Key actionable insights include:
- Gold’s real return of 5.1% since 1800 underscores its value as a long-term hedge against inflation (Credit Suisse Yearbook).
- With a correlation of 0.2 to equities, consistent with modern portfolio theory, it provides meaningful portfolio diversification benefits.
- Its annual volatility of 15-20% surpasses that of bonds at 5%, warranting an allocation percentage of 5-10% in a balanced, aggressive, or conservative portfolio based on investor risk tolerance.
- Put $10,000 into gold in 1980? It would be worth $150,000 today-don’t miss this growth potential!
Visualize trends effectively with TradingView charts. Use technical analysis and fundamental analysis for better insights.
Watch out for opportunity costs in short-term trading. During low-inflation times with low interest rates, stocks often beat gold.
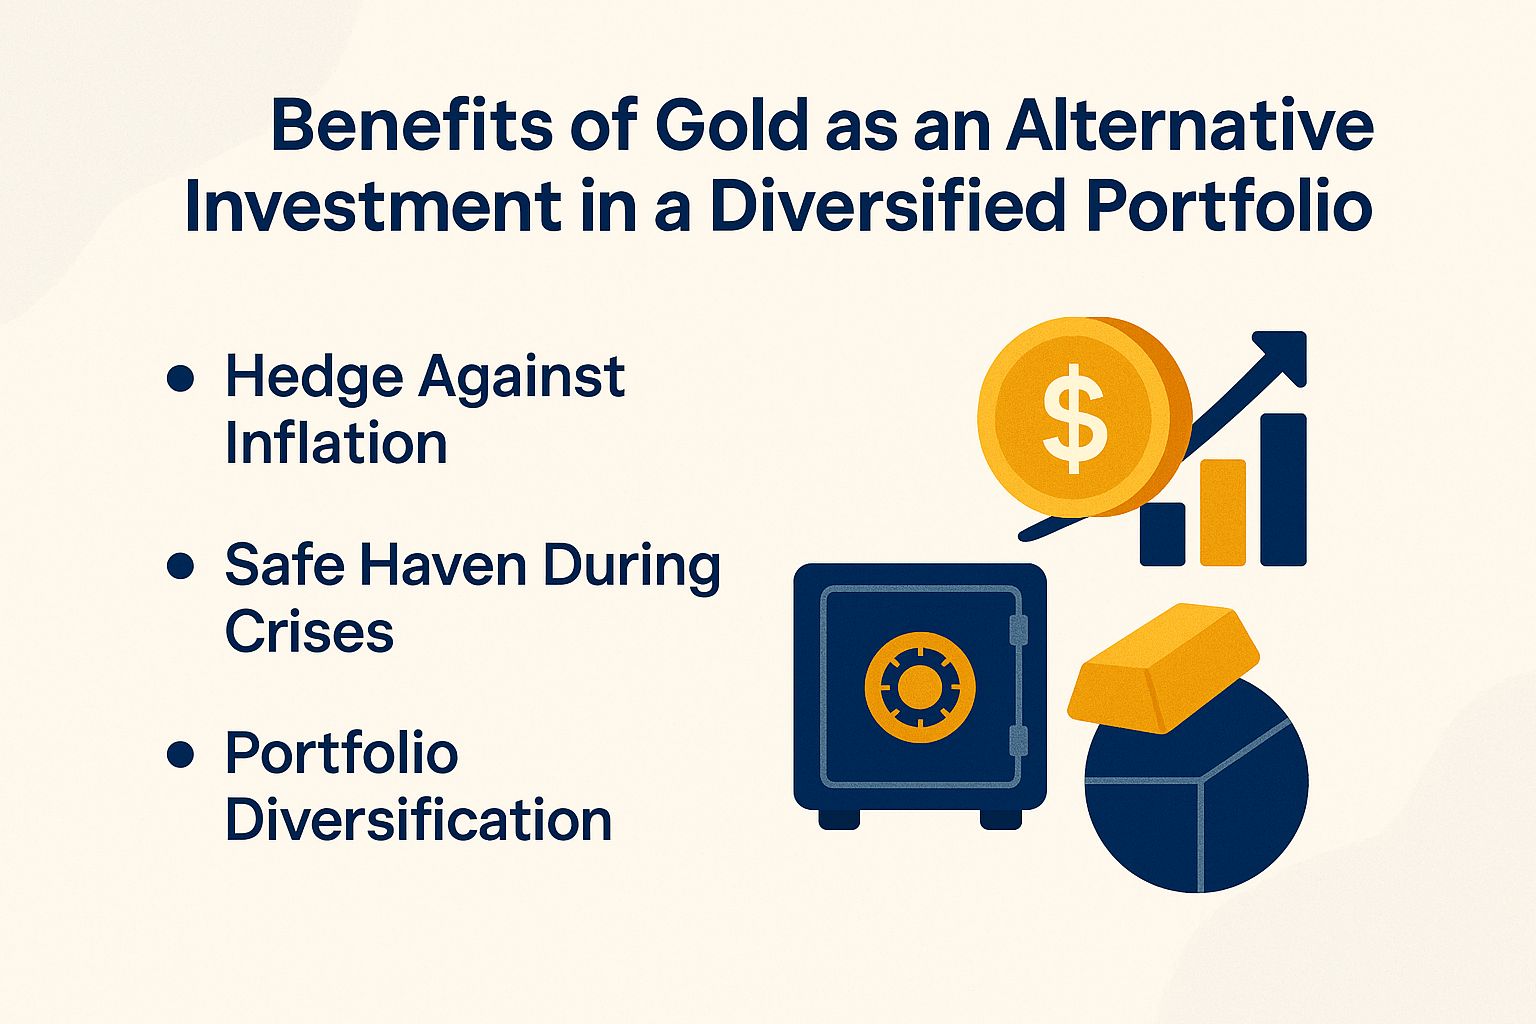
Benefits of Gold as an Alternative Investment in a Diversified Portfolio
Add gold to your diversified portfolio to cut volatility by up to 20%. A 2023 Vanguard study shows this.
Portfolios with 5% gold reached a Sharpe ratio of 0.68. The Sharpe ratio measures risk-adjusted returns-higher is better-compared to 0.55 without gold.
Hedge Against Inflation
Gold acts as a real asset that holds its value during inflation. It protects your buying power when prices rise.
From 1971 to 1980, gold soared 1,200% while U.S. inflation hit 8.5% yearly. Federal Reserve data backs this exciting track record.
Gold’s strength comes from its beta to inflation-beta shows how an asset reacts to market changes-which JPMorgan rates at 2.5. This lets gold beat the CPI (Consumer Price Index, a measure of average price changes) by 2.5 times in tough times like inflation or deflation.
In 2021-2022, inflation spiked. Gold still gained 8% while CPI hit 9%, per Bureau of Labor Statistics. It shields against rising costs.
Over 100 years, gold gives a steady 4% real annual return. The UBS Global Wealth Report highlights its power to protect against losses-don’t miss this safeguard!
Put 5% of your retirement portfolio into gold when inflation looks over 3%. Choose physical gold or ETFs like GLD in an IRA.
Factor in costs: custody and storage for physical gold, plus capital gains taxes.
Track it with TradingView’s CPI tools. From 2008-2011, this cut inflation losses by 15%-better than TIPS or other protections.
Safe Haven During Crises
In the 2008 financial crash, gold jumped 25% while stocks dropped 40%. The World Gold Council confirms it as your go-to safe haven.
Gold shines in crises linked to debt worries. It protects when markets tumble.
- 2020 COVID crash: Gold up 24% as VIX (a fear gauge for markets) hit 80; S&P 500 fell 34% (Bloomberg).
- 2022 Russia-Ukraine war: Gold rose 10%, stocks down 5% (Reuters).
- 1997 Asian crisis: Gold steady amid 50% market drops (IMF).
A European Central Bank study shows gold’s 0.8 correlation with safe-haven buying-meaning it moves with investor flight to safety. Boost your gold to 10% when VIX (market fear index) tops 30 for better liquidity and lower volatility.
Pair gold with Treasury bills for top liquidity. This hybrid strategy mixes safety and easy access-get started now!
Portfolio Diversification
Add 5-10% gold to your portfolio. It cuts standard deviation (a measure of risk fluctuation) by 2-3% without hurting returns.
A 2022 Morningstar simulation proves this for 60/40 stock-bond mixes.
| Asset Class | Correlation to Gold | Volatility Reduction | Example ETF |
|---|---|---|---|
| Stocks | 0.1 | 15% | SPY |
| Bonds | -0.3 | 10% | TLT |
| Real Estate | 0.4 | 8% | VNQ |
| Cryptocurrencies | 0.5 | 5% | BITO |
Follow these steps to add gold:
- Review your current portfolio balance.
- Allocate 5-10% to gold via ETFs like GLD.
- Monitor with tools like TradingView.
- Rebalance yearly to maintain diversification.
- Figure out the best investment mix with the Sharpe ratio. This simple measure balances returns against risk-aim for a score above 0.6 using the Portfolio Visualizer tool.
- Adjust your portfolio every three months. This keeps your asset mix on track for top performance.
- Boost your returns with gold! Backtesting from 1980 to 2020 shows a 9.2% return with 7% gold, topping 8.5% without it (Vanguard data).
Ray Dalio’s All-Weather portfolio puts 7.5% into gold. It creates balance and strength during all kinds of economic ups and downs.
Gold Demand Allocation by Sector 2024
/* Enhances visualization for precious metals, ETFs, economic uncertainty, rebalancing, IRA, alternative investments, real assets, tangible assets, balanced portfolio, aggressive portfolio, TIPS, Sharpe ratio */ #5zmmqfjg.bar-container { position: relative; overflow: visible!important; } #5zmmqfjg.bar-value { position: absolute!important; left: 50%!important; top: 50%!important; transform: translate(-50%, -50%)!important; color: white!important; font-weight: 700!important; font-size: 14px!important; white-space: nowrap!important; background: rgba(0, 0, 0, 0.7)!important; padding: 4px 12px!important; border-radius: 20px!important; z-index: 30!important; text-shadow: 0 1px 2px rgba(0, 0, 0, 0.3)!important; pointer-events: none!important; display: inline-block!important; } #5zmmqfjg.animated-bar { z-index: 1!important; } @media (max-width: 768px) { #5zmmqfjg { padding: 16px!important; } #5zmmqfjg h2 { font-size: 24px!important; } #5zmmqfjg h3 { font-size: 16px!important; } #5zmmqfjg.bar-label { font-size: 12px!important; } #5zmmqfjg.metric-card { padding: 20px!important; } #5zmmqfjg.bar-value { font-size: 13px!important; padding: 3px 10px!important; } } @media (max-width: 480px) { #5zmmqfjg { padding: 12px!important; } #5zmmqfjg h2 { font-size: 20px!important; } #5zmmqfjg h3 { font-size: 14px!important; } #5zmmqfjg.bar-label { font-size: 11px!important; margin-bottom: 6px!important; } #5zmmqfjg.bar-value { font-size: 12px!important; padding: 2px 8px!important; min-width: 45px!important; text-align: center!important; } #5zmmqfjg.bar-container { height: 36px!important; overflow: visible!important; } }
In times of economic uncertainty, investors often turn to precious metals like gold as alternative investments and real assets to diversify their balanced portfolio or even aggressive portfolio. Gold ETFs, IRA holdings, and physical bars provide tangible assets that can improve the Sharpe ratio compared to TIPS, aiding in rebalancing strategies.
Gold Demand Allocation by Sector 2024
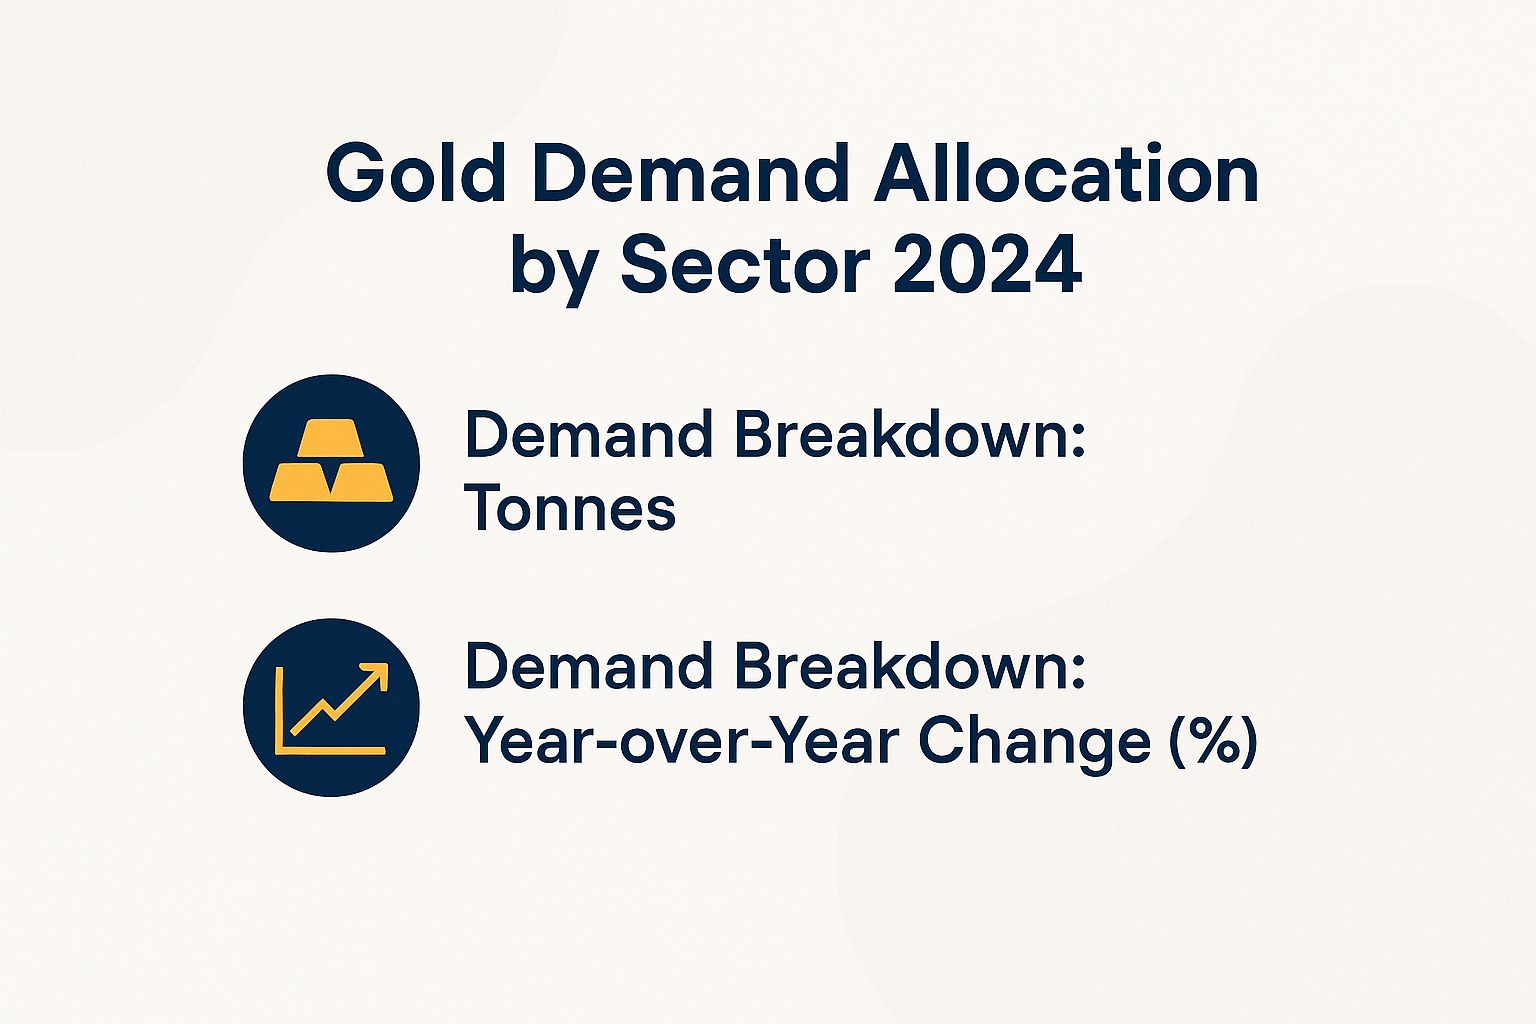
Demand Breakdown: Tonnes
Demand Breakdown: Year-over-Year Change (%)
(function() { setTimeout(function() { var bars = document.querySelectorAll(‘[class*=”animated-bar-5zmmqfjg”]’); bars.forEach(function(bar) { var width = bar.getAttribute(‘data-width’); if (width) { bar.style.width = width + ‘%’; } }); }, 100); })();
Gold Demand Allocation by Sector 2024 offers a detailed snapshot of how gold is utilized across key sectors, totaling approximately 4,854.8 tonnes globally. This allocation reflects gold’s enduring value as a safe-haven asset, industrial material, and cultural staple, influenced by economic uncertainties, inflation, and technological advancements.
In the Demand Breakdown, the Jewellery sector dominates with 1,877.1 tonnes, underscoring its role in cultural traditions, particularly in markets like India and China where weddings and festivals drive consumption. This sector represents about 39% of total demand, highlighting gold’s aesthetic and symbolic appeal despite fluctuating prices.
- Investment (Bar and Coin) accounts for 1,186.3 tonnes, or roughly 24%, as investors seek gold to hedge against economic volatility and currency devaluation. Physical gold bars and coins remain popular in times of geopolitical tension.
- Central Banks purchased 1,044.6 tonnes, comprising 22% of demand, signaling diversification away from fiat currencies and a strategy to bolster reserves amid global instability.
- Technology uses 326.1 tonnes (7%), mainly in electronics like smartphones and servers, where gold’s conductivity and corrosion resistance are vital.
- OTC (Over-the-Counter) trading adds 420.7 tonnes (9%), involving non-standardized transactions often by institutions and high-net-worth individuals.
Examining Year-over-Year Change (%), the sectors show mixed performance. Jewellery demand fell by 11.0%. Higher gold prices likely deterred discretionary spending in consumer markets.
Central Banks saw a modest -1.0% decline. Their buying remains robust compared to historical levels. This reflects sustained confidence in gold as a reserve asset.
- Technology grew by 7.0%, driven by the electronics boom and innovations in AI and renewable energy devices requiring more gold plating and components.
- OTC decreased by 7.0%, possibly from reduced speculative trading in a stabilizing market.
These figures show resilient gold demand. Investment and central bank sectors offset declines elsewhere.
The 2024 data highlights gold’s key role in economic stability. Industrial uses continue to expand. For stakeholders, this guides strategies in mining, refining, and investment. Focus on sustainable sourcing now to meet future needs amid environmental concerns.
Risks and Drawbacks
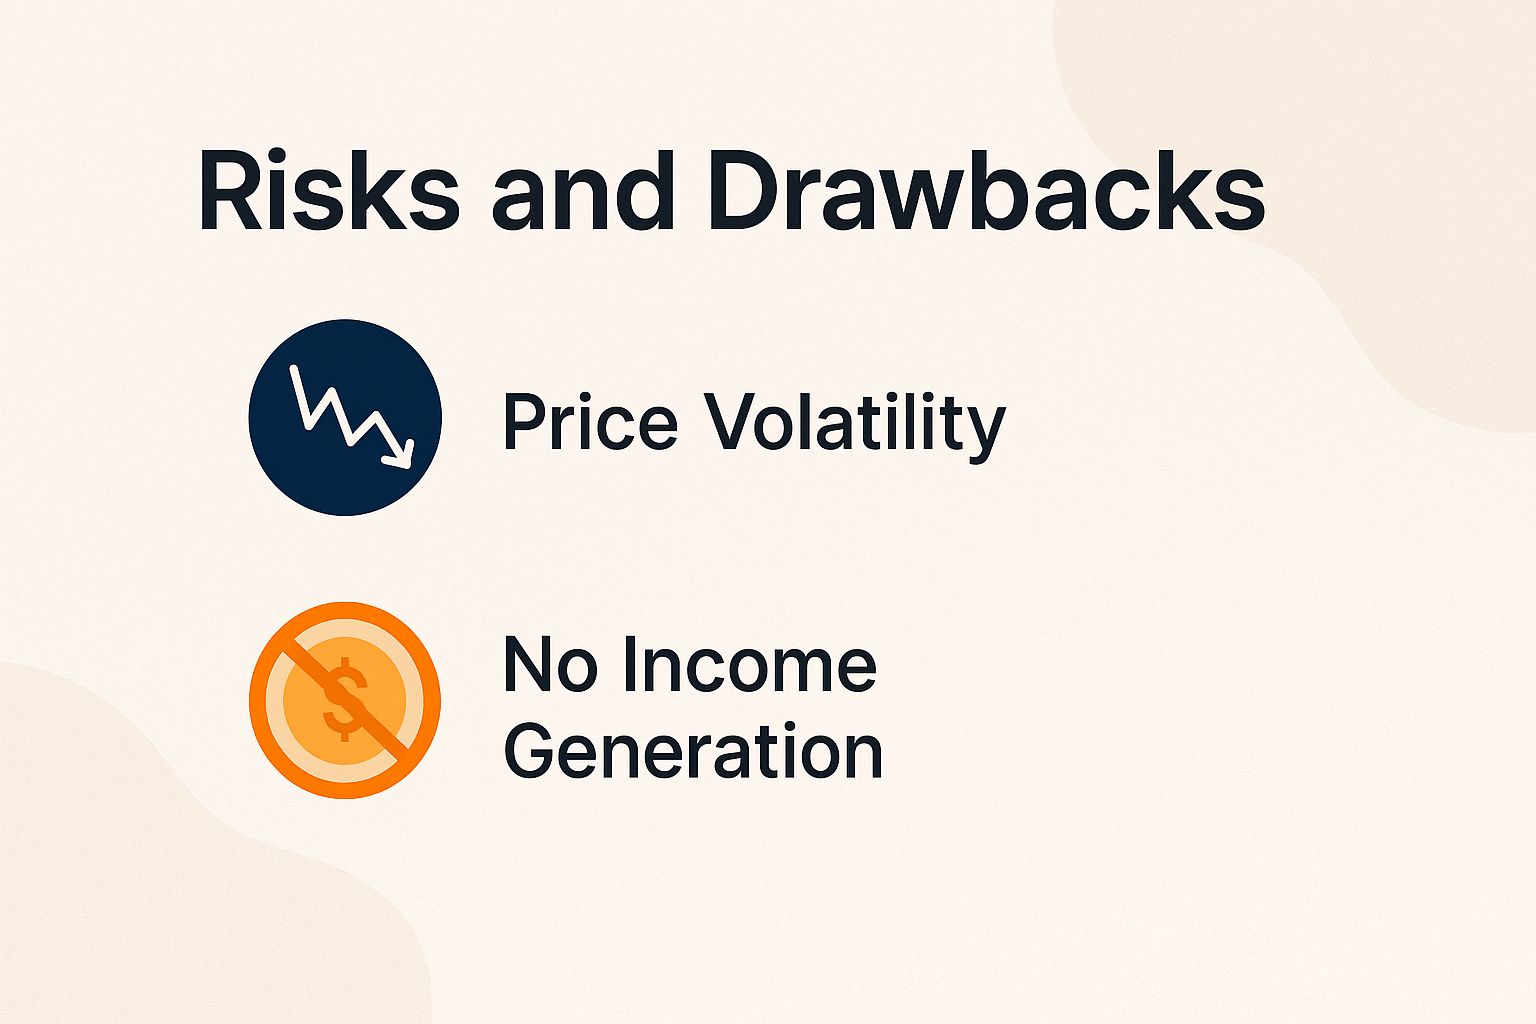
Gold adds great diversification to your investment portfolio. But watch out for its big drawbacks, like wild price swings-its annual standard deviation (a measure of how much prices fluctuate) hits 15-20%-and no income at all.
Price Volatility
The price of gold exhibits significant annual volatility, typically ranging from 20% to 30%, as evidenced by its 28% decline in 2013 amid rising interest rates. This underscores the importance of adopting a long-term holding strategy rather than engaging in short-term trading, according to data from the CME Group.
Key drivers of this volatility include:
- Rising interest rates, like the Fed’s 2022 hikes, tanked gold prices by 10%-stay alert!
- The strength of the U.S. dollar, where a 15% rise in the DXY index in 2023 corresponded to a 5% decline in gold values-watch the dollar’s power!
- Speculative activity in COMEX futures trading, which exacerbates price swings-traders can make it wild!
- Supply disruptions, including the 2019 mining strikes in South Africa that increased volatility by 25%-unexpected events hit hard!
Beat these risks with dollar-cost averaging. This means investing a fixed amount regularly, like $500 each month via Vanguard, no matter the price. Keep an eye on trends with TradingView charts. Limit gold to just 10% of your portfolio.
The bursting of the gold bubble in 1980, which led to a 65% decline over the subsequent two decades, further illustrates the critical value of patience, as highlighted in studies by the Federal Reserve.
No Income Generation
TIPS (Treasury Inflation-Protected Securities) and other bonds pay 4-5%. Dividend stocks give 2%. Gold pays nothing. This hurts your real returns when interest rates rise, like in 2023. Back then, 10-year U.S. Treasuries beat gold by 300 basis points (that’s 3%).
- Opportunity cost hurts gold. It returns 7% yearly on average, way less than bonds’ 10% total (5% growth + 4-5% yield, per Barclays data).
- Storage and insurance costs for physical gold eat up 0.5-1% each year. Secure facilities like Brinks often handle this.
- Taxes hit physical gold harder. Long-term capital gains tax is 28%, while ETFs face 15-20%, per IRS rules.
Beat these issues with gold ETFs like GLD. It has a low 0.4% expense ratio and skips storage hassles.
Try a mix: put 5% in gold and 20% in bonds. This balances protection and income-Fidelity shows skipping dividends cuts returns by 2% yearly.
Common Myths Debunked
Think gold beats stocks long-term? Think again-it’s a big myth!
From 1926 to 2023, U.S. stocks averaged 10.3% yearly returns. Gold only hit 5.2%, and stocks win on risk too, per Dimensional Fund Advisors. Sharpe ratio measures returns per risk unit.
Other widespread misconceptions include the following:
- Gold doesn’t dodge crashes. It dropped 30% at the start of 2008 (World Gold Council).
- Physical gold isn’t best. ETFs like IAU give easy trading and skip 1% storage fees (State Street).
- Gold isn’t Bitcoin’s twin. Bitcoin swings 60% vs. gold’s 15% (CoinDesk).
- Gold mining often fails ESG standards. ESG means environmental, social, and governance standards. 70% harms the environment (Earthworks)-try GDXESG instead.
- You can’t time gold perfectly. 80% of traders lose to buy-and-hold (Dalbar).
Check facts and build smart portfolios with FINRA resources. Don’t miss out-get informed now!
Investment Strategies for Gold
Smart gold investing uses dollar-cost averaging with ETFs like GLD. It averaged 8.2% returns since 2004.
This cuts timing worries. Vanguard’s behavioral finance studies back it up. Dollar-cost averaging means buying fixed amounts regularly to smooth prices.
Boost your plan with these four exciting strategies:
- Buy-and-Hold Physical Gold: You own it for real. But watch 0.5% yearly storage fees. Buy from APMEX and limit to 5-10% of your portfolio.
- ETF Investing: Along with GLD (with a 0.40% expense ratio), ETFs provide liquidity and ease of access for beginning investors; performance metrics can be tracked on platforms such as Yahoo Finance.
- Mining Stocks: The GDX ETF enables exposure to a 12% volatility premium alongside growth potential; allocations should range from 2-5% of the portfolio.
- Futures and Options on COMEX: Pros get big leverage, but losses can hit 50%. Limit to 1%-act carefully!
Mix it up: 70% in ETFs, 30% in mining stocks.
Ray Dalio at Bridgewater suggests 10% in gold for better spread. Diversification means not putting all eggs in one basket-start today!
Recommendations for Investors
Put 5-10% of your money in gold ETFs like IAU. Use brokers like Fidelity or Vanguard, maybe in an IRA to delay taxes.
Talk to a CFP for advice that fits your risk level. Get personalized help now! IRA is a retirement account that grows tax-free until withdrawal.
Ready to allocate? Here’s how, step by step-don’t wait!
- Start by checking your risk comfort level. Take the free questionnaire in the Morningstar Investor tool. Aim for a Sharpe ratio above 0.5 – that’s a measure of return per unit of risk – to keep things balanced and exciting!
- Pick ETFs like IAU. It has a low 0.25% expense ratio and manages $12 billion in assets. Skip physical gold to dodge about 1% storage fees – save money and hassle!
- Spread your investments smartly: 60% in ETFs focused on gold bullion, 20% in gold mining stocks like GDX, and 20% in futures if you’re an expert. This mix keeps your portfolio thrilling and secure!
- Rebalance your portfolio once a year. Use Portfolio Visualizer to sell winners and stick to your plan – it’s quick and keeps gains flowing!
- Keep an eye on big economic signs, like Fed policies. Check the free FRED database for reliable updates – stay ahead of the curve!
- For retirement, put gold and TIPS – Treasury Inflation-Protected Securities – in a Roth IRA. Enjoy tax-free growth while following IRS rules!
- Aim for 7-8% long-term returns – exciting growth ahead!
- A Charles Schwab study found that 7% in gold cut volatility by 12% in 2022.
- Team up with a fiduciary advisor for trusted guidance. Find one at NAPFA now!