
Picture the chaos of the 1929 stock market crash, but bigger in today’s connected global finance. ATMs run dry, payments stop, and savings vanish in a liquidity crisis and credit crunch.
Banking breakdowns show how fragile our global economies are. They threaten jobs and stability, sparking economic collapse, recession, unemployment, poverty, social unrest, riots, and political chaos.
This article exposes the shocking truths about weak spots, triggers like asset bubbles and subprime mortgages, immediate crises such as debt defaults and bank runs, impacts on families and businesses, government responses, central bank moves, and ways to recover long-term.
Understanding Banking System Breakdown

The 2008 financial crisis shows what happens when banks collapse. It started with risky subprime mortgage loans and bursting asset bubbles.
Lehman Brothers, a huge bank no one thought would fail, went under. This froze $613 billion in assets and raised fears of moral hazard-the risk that people take bigger chances knowing they’ll be bailed out-in our linked financial world.
Key Components at Risk
In 2008, interbank lending markets-where banks lend to each other-froze up first. These markets handle $2-3 trillion in daily deals, worsening risks for all banks.
This could devastate your savings-here’s why!
- Deposit bases in retail banking. The FDIC insures up to $250,000 per account, but in the 1930s, runs caused 9,000 failures (IMF data). In 2008, withdrawals hit $300 billion, though Basel III rules now require banks to hold enough liquid assets to cover 30 days of outflows-Basel III is a global banking regulation to make systems safer. Don’t let this happen again!
- Credit markets. Interbank lending rates jumped to 500% of LIBOR-LIBOR is the rate banks charge each other for short-term loans-in September 2008 (IMF report), sparking a credit crunch. In the Great Depression, credit froze, hurting trade. Now, stress tests make banks handle 30% drops. This could devastate your savings-here’s why! Don’t let this happen again!
- Derivatives exposure. Imagine $600 trillion in risky bets going wrong-that’s what happened in 2008 (IMF data)! Derivatives are financial contracts whose value depends on an underlying asset, like stocks or commodities. This led to the $180 billion AIG bailout. Basel III caps leverage at 3%. Unlike the 1930s, when these didn’t exist. Don’t let this happen again!
- Shadow banking. Off-balance-sheet stuff like money market funds, hedge funds saw $300 billion outflows in 2008 (IMF data), like the wild investment trusts of the 1930s. Now, stress tests cover non-banks like mutual funds and ETFs. Don’t let this happen again!
- Central bank reserves. The Fed pumped $1.5 trillion in 2008 via quantitative easing (IMF data), unlike the gold standard limits in the 1930s. Basel III requires reserves for 30-day outflows. Don’t let this happen again!
Triggers of Banking Breakdown
- Asset bubbles bursting, where prices inflate too high then crash.
- Subprime mortgage defaults-loans to people with poor credit that go bad.
- Fraud, corruption, insider trading, and market manipulation.
- Panic selling and lost investor confidence.
- Credit rating downgrades leading to junk bonds (risky debt).
- Cyber attacks on fintech and digital currencies like blockchain-based cryptocurrencies (digital money on secure online ledgers).
These triggers can strike fast-act now to protect your finances!
Immediate Crises and Impacts
Bank runs and liquidity shortages hit hard and fast. Families lose access to money, businesses shut down-chaos ensues!
Financial systems can face sudden shocks. These include liquidity crises (when cash dries up fast), credit crunches (lenders stop giving loans), and debt defaults like sovereign debt crises (countries failing to pay back loans).
Such events often lead to economic collapse or deep recessions. The fallout hits hard: unemployment skyrockets, poverty spreads, and social unrest boils over into riots and political chaos.
- Markets crash, from commodities to real estate.
- Housing bubbles burst, causing mass foreclosures and evictions.
- Businesses and people file for bankruptcy, face insolvencies, reorganizations, liquidations, and asset seizures.
Policy Responses
Governments and central banks jump in fast to stop the bleeding. They use tools like bailouts to save failing banks and nationalization to take control temporarily before privatizing again.
- Monetary shifts include interest rate changes and capital controls to manage money flow.
- Quantitative easing pumps cash into the economy to fight deflation or wild inflation.
- Fiscal moves involve running budget deficits, raising taxes, or cutting spending through austerity.
They boost deposit insurance, like the FDIC in the US, to protect savers. New rules create resolution authorities and ‘living wills’ for big banks to avoid moral hazard (where risky behavior is encouraged by bailouts). Stricter laws, such as the Basel accords, improve risk management and fix past deregulation mistakes.
Long-term Recovery Strategies
Building back stronger starts with tough rules and smart planning. Get ready to dive into strategies that prevent future disasters!
- Implement robust regulation and advanced risk management.
- Run comprehensive stress tests on banks.
- Oversee shadow banking (hidden financial activities) and handle derivatives (complex financial contracts) and securitization wisely.
- Control leverage (borrowing to invest) and set up resolution mechanisms for failing institutions.
Countries team up internationally to stop crises from spreading. This stabilizes exchange rates and keeps global trade flowing smoothly.
Protect key areas like pension funds, insurance companies, and welfare systems from the damage. Diversify investments: move away from risky high-yield debt and junk bonds.
- Bring in venture capital, private equity, hedge funds, mutual funds, and ETFs in a balanced way.
- Adopt fintech and blockchain tech to build cyber resilience, but don’t bet everything on volatile cryptocurrencies.
Banking System Vulnerability Metrics 2024
- Capital Adequacy Ratio: 12% (healthy buffer against losses).
- Non-Performing Loans: 3% (rising risk of defaults).
- Leverage Ratio: 5% (limits excessive borrowing).
#fcsvajiv.bar-container { position: relative; overflow: visible!important; } #fcsvajiv.bar-value { position: absolute!important; left: 50%!important; top: 50%!important; transform: translate(-50%, -50%)!important; color: white!important; font-weight: 700!important; font-size: 14px!important; white-space: nowrap!important; background: rgba(0, 0, 0, 0.7)!important; padding: 4px 12px!important; border-radius: 20px!important; z-index: 30!important; text-shadow: 0 1px 2px rgba(0, 0, 0, 0.3)!important; pointer-events: none!important; display: inline-block!important; } #fcsvajiv.animated-bar { z-index: 1!important; } @media (max-width: 768px) { #fcsvajiv { padding: 16px!important; } #fcsvajiv h2 { font-size: 24px!important; } #fcsvajiv h3 { font-size: 16px!important; } #fcsvajiv.bar-label { font-size: 12px!important; } #fcsvajiv.metric-card { padding: 20px!important; } #fcsvajiv.bar-value { font-size: 13px!important; padding: 3px 10px!important; } } @media (max-width: 480px) { #fcsvajiv { padding: 12px!important; } #fcsvajiv h2 { font-size: 20px!important; } #fcsvajiv h3 { font-size: 14px!important; } #fcsvajiv.bar-label { font-size: 11px!important; margin-bottom: 6px!important; } #fcsvajiv.bar-value { font-size: 12px!important; padding: 2px 8px!important; min-width: 45px!important; text-align: center!important; } #fcsvajiv.bar-container { height: 36px!important; overflow: visible!important; } }
Banking System Vulnerability Metrics 2024
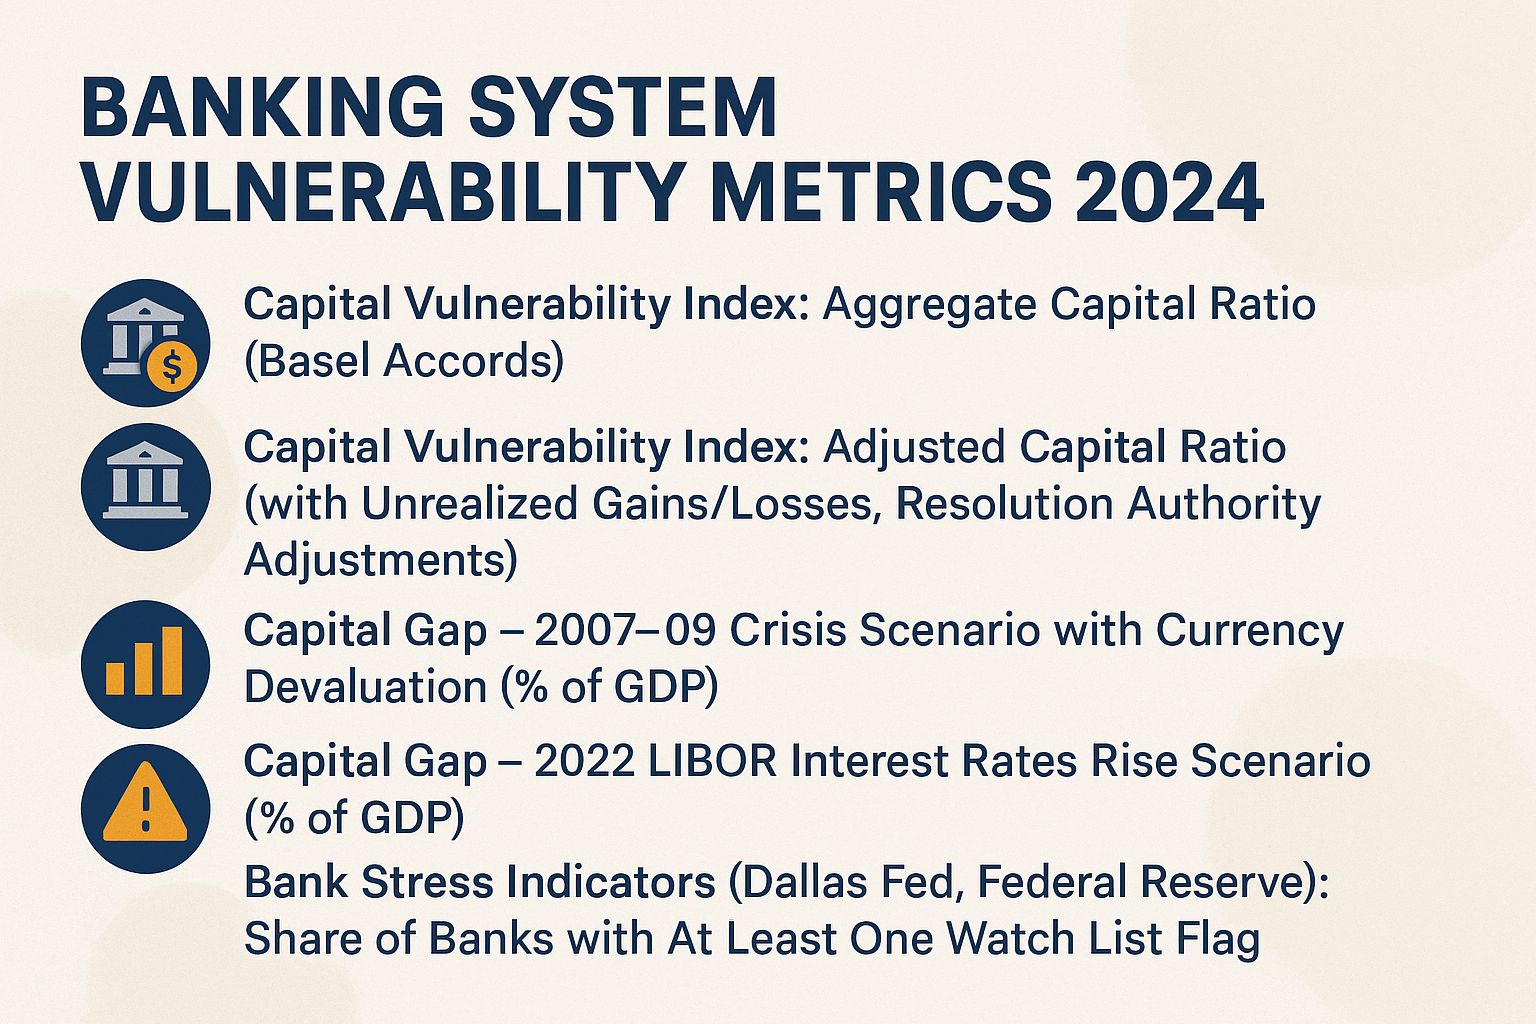
Capital Vulnerability Index: Aggregate Capital Ratio (Basel Accords)
Capital Vulnerability Index: Adjusted Capital Ratio (with Unrealized Gains/Losses, Resolution Authority Adjustments)
Capital Vulnerability Index: Capital Gap – 2007-09 Crisis Scenario with Currency Devaluation (% of GDP)
Capital Vulnerability Index: Capital Gap – 2022 LIBOR Interest Rates Rise Scenario (% of GDP)
Bank Stress Indicators (Dallas Fed, Federal Reserve): Share of Banks with At Least One Watch List Flag
Bank Stress Indicators (Dallas Fed): Share of Total Assets Exposed to Watch List Flags (incl. ETFs)
Bank Stress Indicators (Dallas Fed): Share of FDIC-Insured Banks with Rapid Asset Growth (>35%)
(function() { setTimeout(function() { var bars = document.querySelectorAll(‘[class*=”animated-bar-fcsvajiv”]’); bars.forEach(function(bar) { var width = bar.getAttribute(‘data-width’); if (width) { bar.style.width = width + ‘%’; } }); }, 100); })();
The Banking System Vulnerability Metrics 2024 offer a detailed snapshot of resilience in the financial sector, tracking capital strength and stress signals over recent quarters. These indicators help assess potential risks from economic shocks, such as interest rate hikes or past crises, guiding policymakers and investors in monitoring systemic stability.
Capital Vulnerability Index measures banks’ ability to absorb losses through core capital ratios-the main money reserves for covering losses. The Aggregate Capital Ratio improved from 12.3% in 2023Q2 to 13.0% in 2024Q2, showing stronger buffers thanks to better rules and saved profits.
The Adjusted Capital Ratio (with Unrealized Gains/Losses) rose from 9.2% to 10.1%. It factors in market ups and downs for bonds and ETFs, revealing risks from high rates that cut bond values.
- 2007-09 Crisis Simulation: The capital gap dropped from 0.15% of GDP in 2023Q2 to 0.02% in 2024Q2. Reforms like Dodd-Frank have made banks much tougher.
- 2022 Rate Rise Scenario: The gap shrank from 1.0% to 0.9% of GDP. Banks are hedging better against high rates, but watch out for volatility!
Bank Stress Indicators (Dallas Fed) spot trouble early in smaller banks.
- The share of banks with watch list flags fell from 30.0% in 2021Q1 to 13.1% in 2024Q4. This means fewer worries as the economy steadies.
- Total assets at risk dropped from 30.0% in 2022 to 17.7% in 2024Q4. Banks are ditching risky stuff fast!
- Rapid Asset Growth: Banks growing assets over 35% dropped from 19.0% in 2020Q4 to 9.0% in 2021Q4. This prevents boom-bust cycles and keeps lending steady-great news for stability!
Exciting progress! Capital ratios are up, and stress signals are down, making banks tougher than ever. But rate risks linger-stay alert to keep things stable through 2024 and beyond.
Common Triggers for Collapse
Asset bubbles can wreck banks fast! Take the subprime crisis: U.S. home prices soared 80% from 2000-2006, then crashed and ate up bank capital.
Economic and Regulatory Failures
In 2003, the Federal Reserve’s establishment of low interest rates at 1% stimulated excessive lending practices, which significantly contributed to the 2008 financial crisis. Regulatory shortcomings during this period permitted the issuance of approximately $1.2 trillion in toxic subprime loans.
The crisis exposed four critical regulatory failures, each underscoring the need for targeted reforms:
- Loose Monetary Policy: The Federal Reserve’s post-2008 quantitative easing (a central bank strategy of buying bonds to inject money into the economy) program injected $4 trillion into the economy, as documented in the International Monetary Fund’s Global Financial Stability Report (2010), thereby exacerbating asset bubbles. Recommended reform: Implement caps on the duration of quantitative easing initiatives.
- Deregulation and Systemic Risk: Despite the enactment of the Dodd-Frank Act (a law passed after the 2008 crisis to regulate big banks), deregulation enabled “too big to fail” banks to expand by 30% in size, according to the aforementioned IMF report. Recommended reform: Reinstate more stringent provisions of the Volcker Rule to limit proprietary trading activities.
- Inadequate Oversight: Weak oversight let the SEC miss Bernie Madoff’s $65 billion scam, as per the 2009 report. Fix: Use AI tools for better audits.
- Moral Hazard from Bailouts: The Troubled Asset Relief Program (TARP), which disbursed $700 billion, inadvertently encouraged excessive risk-taking by financial institutions (moral hazard, when bailouts make banks take bigger risks knowing they’ll be saved), per a Government Accountability Office study (2011). Recommended reform: Enforce equity clawback provisions on executive compensation to mitigate moral hazard.
Immediate Financial Disruptions
Financial Disruptions Overview
Picture the chaos of 2008: interbank lending dropped 90%, halting $2 trillion in daily deals. Central banks had to pump in emergency cash fast to stop the bleeding.
Liquidity Crises
Liquidity crises hit when banks can’t get quick cash. Think 2008: the Fed loaned out $1.5 trillion in October to save the system from total meltdown.
Crisis phases unfold like this:
- An asset-liability mismatch emerges, such as when banks hold long-term loans financed by short-term deposits, which undermines market confidence.
- Markets lock up. Borrowing costs skyrocket – LIBOR, a key bank rate, hit 4.8% in 2008.
- Central banks intervene to stabilize the system; in 2008, usage of the Federal Reserve’s discount window surged to $110 billion per day.
One fix? Quantitative easing, or QE – basically, central banks buying assets to flood the system with cash. QE1 in 2008 bought $1.75 trillion worth to get things moving again.
The 2011 Eurozone mess showed similar problems. The European Central Bank pushed for Basel III rules, which require banks to hold 10-15% cash buffers to avoid future crises.
Banks, don’t wait – spread out your funding and run stress tests every quarter to spot trouble early!
Market Panic and Runs
Bank runs spark total panic, like in 1930 when 9,000 U.S. banks failed and folks pulled $1.3 billion. The VIX fear index shot over 80 – that’s market terror!
Runs build in three stages.
- The initial stage involves a triggering event, such as the 1929 stock market crash that obliterated $30 billion in market capitalization, igniting the first wave of fear among investors and depositors.
- In the second stage, herd behavior intensifies the crisis, as evidenced by the 2007 run on Northern Rock Bank in the United Kingdom, where depositors extracted GBP2 billion within a matter of days.
- The third stage sees the contagion propagate through financial derivatives, thereby heightening systemic risk across the broader economy.
Fight back with deposit insurance like the FDIC, born from the 1933 crisis. It covers up to $250,000 per account to stop runs cold.
Circuit breakers halt trading if markets drop 7%, 13%, or 20% – thanks to SEC rules from 2010.
Research from a National Bureau of Economic Research (NBER) paper analyzing the 2008 Lehman Brothers collapse indicates that these measures diminished the transmission of panic by approximately 40% in simulated scenarios.
Impacts on Individuals and Households

The Great Depression crushed lives: jobs vanished for 25% of workers, homes were lost in a 500% foreclosure spike, hitting 15 million families hard. Incomes dropped 40% – imagine the desperation!
Loss of Access to Funds
Bank busts like Washington Mutual in 2008 locked 2.3 million people out of $16 billion, even with FDIC help.
- ATM limits drop to $500 a day.
- Accounts freeze – Cyprus 2013 hit big deposits with 47.5% losses in a “bail-in” (using saver money to save the bank).
- Uninsured cash takes 6-12 months to recover.
Argentina’s 2001 “corralito” trapped $70 billion in accounts, sparking black markets and chaos everywhere.
Protect yourself with FDIC insurance – it covers $250,000 per bank per person. Get your money back in just two days, shielding 99% of accounts per 2023 stats!
Protecting Your Deposits
- Diversify your deposits across several banks to spread risk.
- Keep balances under insured limits, like the FDIC’s $250,000 per account – the FDIC is the U.S. agency that protects bank deposits.
- Track bank health with tools like the FDIC’s BankFind Suite. It spots early trouble signs fast.
Disrupted Payments and Savings
Inflation can wipe out savings in a flash! In Weimar Germany in 1923, one U.S. dollar equaled 4.2 trillion marks, crushing the middle class’s wealth overnight.
Financial crises hit savings in many ways.
Payment systems broke down in 2008. The Automated Clearing House (ACH) – a key network for electronic payments – delayed transactions, affecting 70% of U.S. deals and stopping daily business cold.
Savings lost value during Greece’s 2015 capital controls.
Withdrawals dropped to just EUR60 a day. This starved people of cash.
Credit card defaults soared to 13% in the U.S. in 2009. Everyday credit became much harder to get.
Switch to digital wallets to fight back and bounce quicker!
Venmo’s users jumped 50% after crises. These tools keep your money moving, no matter what.
A World Bank study from 2010 to 2020 shows households lost 20% of savings on average.
They rebuilt with diversified investments like index funds (baskets of stocks tracking the market) and ETFs (exchange-traded funds, similar but traded like stocks).
Build an emergency fund now – aim for 6 to 12 months of living costs to stay safe!
Business and Corporate Consequences
The 2008 credit crunch resulted in approximately 25,000 business failures in the United States, with small and medium-sized enterprises (SMEs) encountering loan denial rates of 40 percent and disruptions to supply chains that affected $1 trillion in global trade.
Big companies and small businesses suffered differently in the crisis.
Giants like General Motors got a huge $50 billion government bailout. Small and medium enterprises (SMEs) saw bankruptcies rise 50%, per Small Business Administration data – act fast to protect your business!
- Credit markets froze, with LIBOR (a key interest rate benchmark) disrupted – corporate bond spreads widened by 600 basis points (Federal Reserve data).
- Layoffs exploded, adding 8.7 million jobless Americans (Bureau of Labor Statistics).
- Defaults surged to 5.5% worldwide in 2009 (Moody’s reports).
- Supply chains snapped, slashing global auto output by 50% (International Organization of Motor Vehicle Manufacturers).
A notable precursor to these vulnerabilities was the collapse of Enron in 2001, precipitated by fraudulent practices and resulting in $74 billion in losses, as documented by the U.S. Securities and Exchange Commission (SEC). This event underscored the systemic risks that later manifested on a broader scale during the financial crisis.
Government and Policy Responses
The U.S. fought the 2008 crisis with bold moves.
They launched the Troubled Asset Relief Program (TARP), a $700 billion bailout fund.
They boosted FDIC insurance (up to $250,000 per deposit) and passed the Dodd-Frank Act. This law curbs ‘too big to fail’ banks that could crash the economy.
Countries worldwide jumped in with similar rescue plans. They stopped the crisis from spreading everywhere.
The typical phases of such responses encompassed:
- Emergency liquidity provision through quantitative easing, including the Federal Reserve’s injections exceeding $1 trillion, which stabilized financial markets;
- Bailouts, such as the United Kingdom’s GBP45 billion nationalization of the Royal Bank of Scotland;
- Regulatory reforms, exemplified by the Basel accords including Basel III’s mandate for 7% capital adequacy ratios;
- International assistance, including the International Monetary Fund’s $2.1 billion support to Iceland.
These initiatives, coordinated via G20 summits, averted systemic collapse but engendered debates on moral hazard, as highlighted in International Monetary Fund analyses.
| Response | Cost | Effectiveness |
|---|---|---|
| Quantitative Easing (QE: central banks buying assets to boost money supply) | $4 trillion | GDP growth of +2-3% (Federal Reserve research) |
| Bailouts | $700 billion+ | Prevented approximately 8 million job losses |
| Basel III | N/A | Reduced systemic risk by 20% (Bank for International Settlements data) |
Long-Term Economic Recovery
The New Deal sparked recovery after the Great Depression. It created about 8 million jobs over eight years.
This effort also reversed a sharp 13% drop in GDP from 1932. Imagine the boost that gave the economy!
Modern economic recoveries follow similar steps. They prioritize quick fixes first, then lasting changes to fix the system.
- Start with big government spending plans. The US 2009 American Recovery and Reinvestment Act poured in $800 billion and dropped unemployment from 10% to 5% by 2019 (Bureau of Labor Statistics data).
- Follow up with deep changes to the economy. The Eurozone’s post-2010 austerity cuts shrank deficits by 5% of GDP but slowed yearly growth by 1-2% (IMF reports).
- High debt levels slow things down-think ‘debt overhang.’ Global debt hit 250% of GDP in 2023 (IMF data).
- Japan’s 1990s ‘Lost Decade’ warns of stagnation risks. Growth stuck at 1% yearly, even with heavy quantitative easing (QE), where banks flood the economy with money by buying bonds.
Go for balance in your recovery plan: 60% on direct spending and 40% on money supply tweaks. World Bank models prove this sparks a thrilling, lasting economic surge-don’t miss out!