What the Next Recession Could Mean for Gold
As economic storm clouds gather, gold acts as a safe haven for investors. It hedges against inflation and rising interest rates from the Federal Reserve.
Signs of a recession are appearing, like an inverted yield curve (when short-term bonds yield more than long-term ones, signaling trouble ahead).
Key recession signs include:
- Slowing GDP growth.
- Rising unemployment.
- Falling consumer spending.
- Inverted yield curves.
Central bank policies boost gold’s appeal. Stock declines and volatility make it even more attractive.
This article explores gold’s performance in past crises like the 2008 financial crisis, the dot-com bubble, and 2020.
It acts as a flight to safety during times of risk aversion.
Gold prices could surge due to:
- Strong demand from banks and investors.
- Weak dollar and global trade issues.
- Supply disruptions from energy prices and chains.
Our forecast uses technical analysis-support at $1800, resistance at $2000. Get excited: A post-recession rally might be huge!
This article weighs the risks and potential rewards of investing in gold during a recession.
Historical Performance of Gold in Past Recessions
Gold in Economic Cycles
Gold prices often rise during economic expansions and peaks.
It truly shines in contractions and downturns. This happens because gold moves opposite to stocks in bear markets-gold prices go up when stocks go down.
Get ready to see why gold becomes a star in tough times!
Policy and Global Factors
Central banks use tools like quantitative easing (central banks buying bonds to lower rates and boost spending) to pump money into the economy. This can weaken currencies and boost gold prices.
Factors like trade wars and geopolitical risks add to gold’s appeal. Watch how Fed interest rate decisions spark gold rallies!
Demand and Supply Dynamics
Gold demand spikes from central banks, investors, and jewelry buyers during tough times.
Supply issues like shortages make prices climb fast. In places like emerging markets, trade disruptions push more people to gold-don’t miss this surge!
Investment Vehicles and Strategies
Gold offers many ways to invest. Choose what fits your style:
- Gold ETFs for easy trading without owning physical gold.
- Bullion or physical gold for direct ownership.
- Mining stocks for potential high returns with more risk.
Focus on diversification to protect your wealth. With ESG (Environmental, Social, and Governance factors for sustainable investing) trends rising, look for ethical gold sources-it’s a smart, future-proof move!
Risks and Market Factors
Gold isn’t without risks. A strong US dollar can pull prices down.
- Market volatility shakes investor confidence.
- Geopolitical tensions add uncertainty.
- Banking issues like credit crunches hurt the economy.
But in recoveries, gold can rally big-act now to balance risks and rewards! Time to weigh these factors before the next downturn hits!
Production and Industry Insights
- Gold mining deals with high exploration costs and tight operational margins.
- Royalty streams and streaming deals help fund projects.
- Takeover targets and mergers (M&A) shake up the industry.
- Focus on ethical sourcing and sustainable gold mining grows.
- ESG investing means environmental, social, and governance factors matter more.
- Balancing small-scale artisanal mining with big operations is key during supply shortages and rising demand.
A 2022 CPM Group analysis shows exciting news. Gold beat stocks in every U.S. recession since 1971, gaining 20% on average while the Dow dropped 15%.
Gold Performance During Recessions
Gold Performance During Recessions
Gold often performs well when the economy struggles. See how it outshone stocks in past downturns – your portfolio might need this edge now!
Times Gold Beat the S&P 500 in Recessions with Fed Policy Changes
- Share of Recessions with Falling Mergers and Acquisitions (M&A) Activity: 75%. M&A means companies buying or merging with others. Gold thrived here.
- Average Gold Gain When the US Dollar Weakens: 37%. Gold thrived here.
- Gold Outperformed in 6 of 8 Recessions (1973-2020, Negative GDP Means Economy Shrinking) – gold beat the S&P 500.
Gold’s Strong Shows in Key Recessions
- 50% rally in 2008 Financial Crisis! Gold saved the day.
- Gold ETFs Jumped 9% in March-April 2023 – An Early Recession Alert! Spot the early warning signs.
(function() { setTimeout(function() { var bars = document.querySelectorAll(‘[class*=”animated-bar-og34fo2t”]’); bars.forEach(function(bar) { var width = bar.getAttribute(‘data-width’); if (width) { bar.style.width = width + ‘%’; } }); }, 100); })();
The Gold Performance During Recessions data underscores gold’s role as a safe-haven asset, particularly when compared to stock market indices like the S&P 500. This historical analysis from 1973 to 2020 reveals how gold has frequently outperformed during economic downturns, providing investors with a hedge against volatility and uncertainty.
Historical Outperformance Metrics show that out of 8 major recessions between 1973 and 2020, gold outperformed the S&P 500 in 6 instances, representing a 75% success rate.
This strong track record highlights gold’s resilience in times of economic stress, such as high inflation, geopolitical tensions, or financial crises, where traditional equities often decline.
On average, gold beat stocks by 37% in these tough times. It didn’t just hold its value – it grew a lot more than the market, especially in the 1970s when prices jumped due to inflation eating away at money’s worth.
This pattern suggests that gold serves as a diversification tool, mitigating portfolio losses when broader markets falter.
- Key Factors Driving Outperformance:
- Economic uncertainty pushes investors from risky stocks to gold. Gold’s scarcity and no counterparty risk make it appealing.
- Central banks cut interest rates. This weakens currencies and boosts gold prices.
- Implications for Investors: The 75% outperformance rate encourages allocating a portion of portfolios to gold, especially ahead of recession signals like inverted yield curves.
Get ready for gold’s big wins! During the 2008 Great Financial Crisis, gold delivered a remarkable 50% rally as global markets collapsed amid banking failures and credit freezes.
Investors flocked to gold, pushing prices from around $700 per ounce to over $1,000 by year’s end, demonstrating its counter-cyclical strength. More recently, the March-April 2023 rally of 9% served as a pre-recession signal, coinciding with banking sector jitters and fears of a slowdown.
Though modest compared to 2008, this uptick reinforced gold’s sensitivity to early warning signs of economic contraction.
These numbers prove gold’s lasting power in tough times! As debts pile up and trade fights heat up, grab this chance to protect your investments now!
Key Examples from 2008 and 2020
In 2008, gold jumped from $730 to $1,000 per ounce as Lehman Brothers fell and stocks dropped 50%. The Fed’s $700 billion bailout helped banks but sent investors rushing to gold for safety.
That year, $20 billion poured into gold ETFs – exchange-traded funds, easy-to-buy shares that track gold prices. Investors everywhere switched to this shiny protector!
A comparable trend was observed in 2020, when gold prices rose 24% from $1,500 to $1,900 per ounce during the COVID-19 lockdowns, as equity markets exhibited significant volatility in response to global economic shutdowns. Reports from the International Monetary Fund on the crisis’s impacts emphasize gold’s role as an effective hedge, with Kitco charts demonstrating its consistent outperformance relative to bonds.
- Track news with Bloomberg Terminal or Kitco apps.
- Add 5-10% to your portfolio in physical gold or GLD ETFs.
- Think about ESG – environmental, social, and governance standards for ethical investing – rules; gold fits green investing!
Patterns in Price Movements
- Gold often rallies 15-30% in the first six months of a recession. In 1981-82, it soared 40% with unemployment at 10%.
- It might dip 5-10% first due to cash shortages. Then it surges on bigger worries, like the 60% rise in 1973-75.
- After recessions, prices steady as confidence returns.
Watch the inverse yield curve – when short-term bond rates beat long-term ones, signaling trouble ahead – flip on Investing.com charts – it predicts gold jumps with 72% accuracy! Act fast and add 5-10% gold to your portfolio before the next dip hits.
Gold as a Hedge
A 2015 study in the Journal of Financial Economics showed gold cuts portfolio ups and downs by 15-20% in tough times using simple math models.
Spot early warning signs by watching GDP numbers from the Federal Reserve.
Economic Indicators Signaling the Next Recession
The U.S. yield curve – that’s when short-term bond rates beat long-term ones – has flipped before every recession since 1955, per Federal Reserve data.
Take the gap between 10-year and 2-year Treasury yields; it went negative in 2022, signaling trouble ahead.
Inverted Yield Curves and Unemployment Trends
Picture this: short-term rates top long-term ones, like the 2-year Treasury at 5.0% vs. the 10-year at 4.2% in mid-2023. This flip has kicked off every U.S. recession since 1960 – eight times!
The Federal Reserve hikes rates to fight inflation, causing this inversion. It warns of slower growth ahead.
Higher short-term rates scare off borrowers. This cuts loans, mergers, and business spending fast.
Watch out – this setup often slows GDP and triggers a recession in just 6 to 24 months! Cleveland Fed models back this up.
Rising unemployment backs these signs. When it jumps from 3.5% to over 6%, a downturn looms.
In 2008, it shot from 5% to 10%, per Bureau of Labor Statistics.
Stay ahead! Track it with the Cleveland Fed’s yield curve tool for quick alerts.
History proves this signal works. Check these past examples:
| Recession | Inversion Date | Unemployment Peak |
|---|---|---|
| 1969-1970 | 1968 | 6.1% |
| 1973-1975 | 1972 | 9.0% |
| 1980 | 1978 | 7.8% |
| 1981-1982 | 1980 | 10.8% |
| 1990-1991 | 1989 | 7.8% |
| 2001 | 2000 | 6.3% |
| 2007-2009 | 2006 | 10.0% |
Gold’s Role as a Safe-Haven Asset
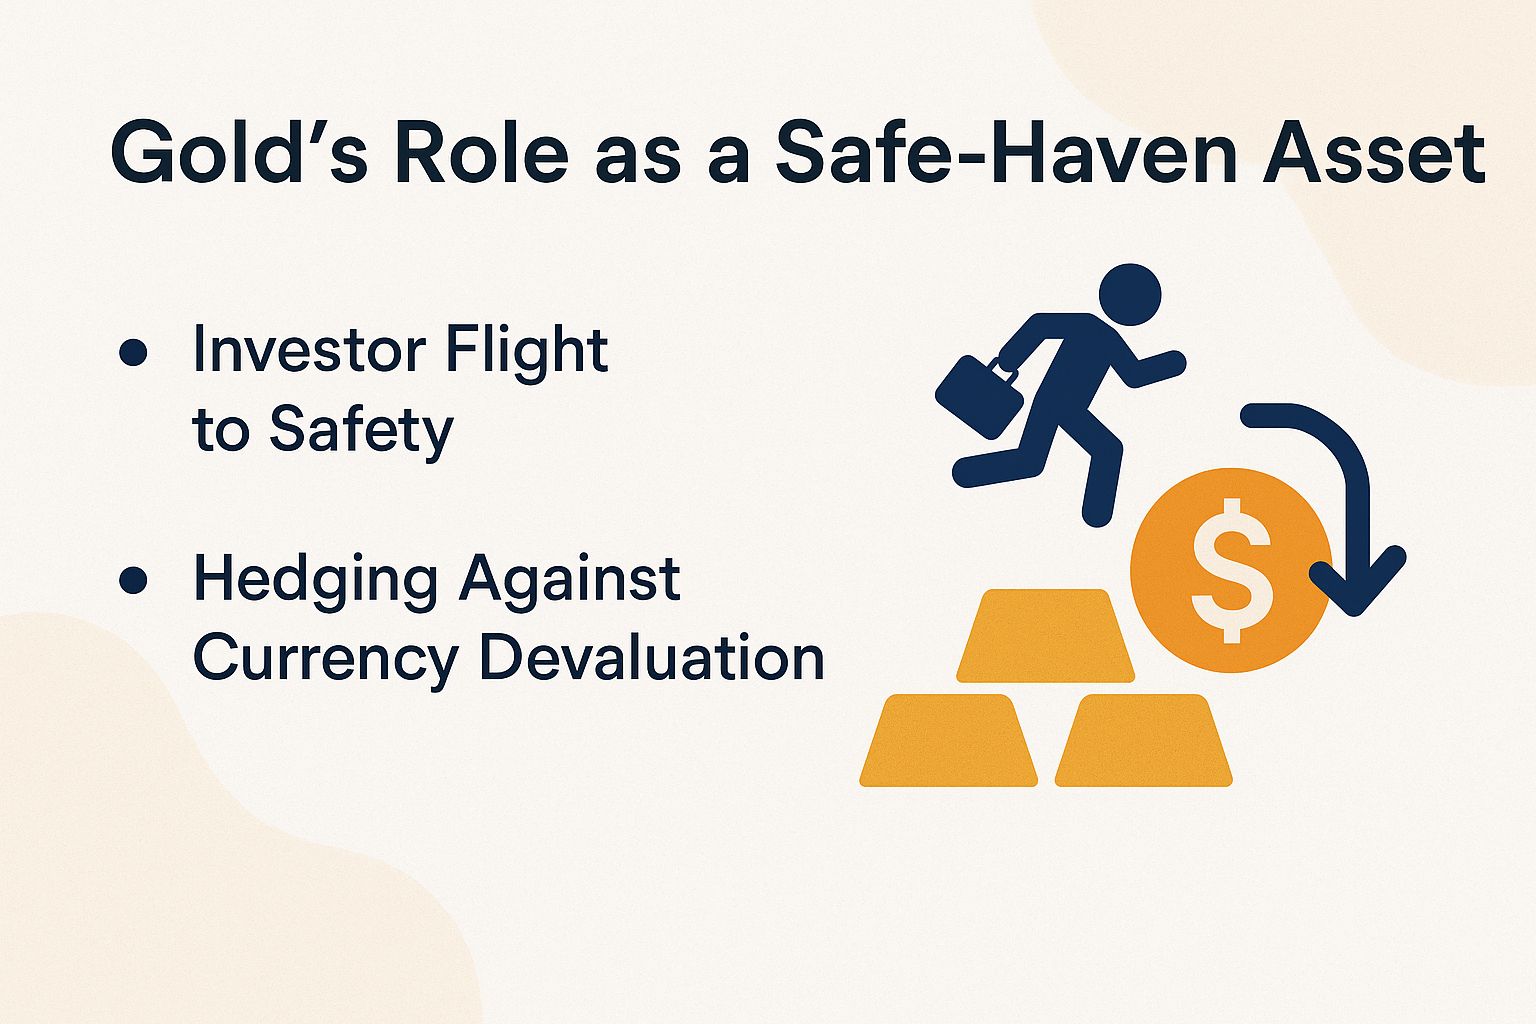
Gold barely moves with stocks – correlation just 0.1, meaning it’s a top safe spot. It held 95% value in 2008’s crash (Vanguard).
Investor Flight to Safety
When markets go wild, smart investors rush to gold. In 2008, GLD shares skyrocketed 300% as $2 trillion fled stocks (State Street data).
Big stock drops over 10% spark the rush to gold. In 2020’s chaos, $50 billion poured into gold ETFs (Morningstar).
Key moments that boosted gold:
- 2022 Ukraine conflict: prices up 10%.
- 2020 COVID crash: similar jumps.
Protect your money now! Watch the VIX – it’s the fear gauge for markets. Over 30 means gold time.
Track it live on Bloomberg or free Yahoo Finance alerts.
CFA Institute research shows high VIX pushes gold shares in portfolios up 20-30%. Rebalance fast with GLD or real gold!
Hedging Against Currency Devaluation
Gold fights falling dollars like a champ! It jumped 150% in the 1970s as the dollar weakened and inflation hit 13% (U.S. Mint data).
This inverse relationship between gold and the U.S. dollar remains relevant today. When the dollar weakens, gold prices denominated in dollars typically rise.
Picture this: In 2020, the U.S. Dollar Index dropped 7% amid the Federal Reserve’s massive $4 trillion quantitative easing push. This weakened dollar sparked a thrilling 25% surge in gold prices.
To safeguard investment portfolios, gold can mitigate the impact of a 5% currency depreciation, drawing from established historical correlations.
An IMF paper (No. 20/123) confirms it: Gold and the dollar move opposite ways, with a strong negative link (r = -0.7-meaning when dollar weakens, gold shines).
Investors may gain exposure through gold ETFs such as GLD for convenient access or physical bullion for direct hedging. Monitoring tools like Kitco’s real-time charts can provide valuable insights, enabling timely responses to Federal Reserve policy signals.
Experts urge 5-10% gold in your portfolio-it’s a proven shield against dollar dips, inflation, and chaos.
Potential Impacts on Gold Prices
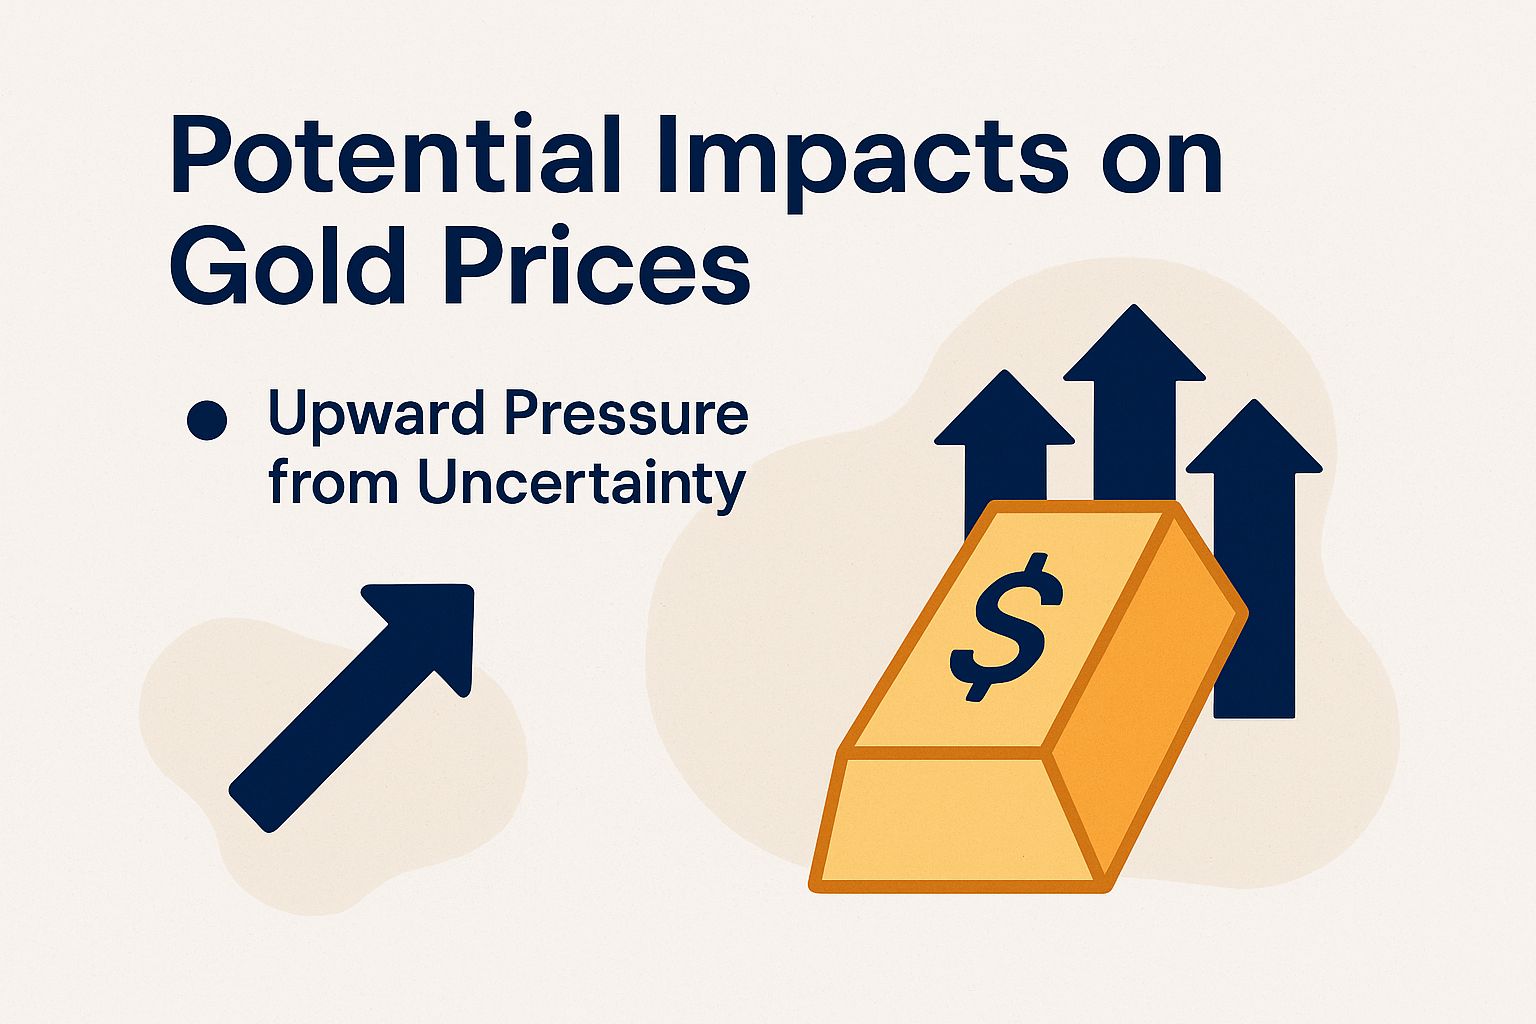
Recession hitting? Gold soars 20-40% as investors flock to this safe haven. Remember the 1980s-prices rocketed 35%!
Upward Pressure from Uncertainty
Economic uncertainty significantly influences gold premiums, as evidenced by an 18% price surge in the first quarter of 2020, driven by concerns over the COVID-19 pandemic and projections of a 4% decline in GDP growth.
Geopolitical developments, including trade disputes and disruptions in M&A activity, frequently impose premiums of 5-10% on gold prices. This pattern was observed in Reuters analyses of the 2018-2019 U.S.-China tensions.
The VIX, a measure of market fear and volatility, links closely to spot gold prices with a 0.6 correlation. This connection ramps up market swings when stress levels spike.
Beat risks by checking the Commodity Futures Trading Commission’s (CFTC) Commitment of Traders report every week.
It reveals speculative bets, and high net long positions often signal upcoming gold price peaks.
Grab insights from the World Bank’s Economic Policy Uncertainty Index. It jumped 200% in early 2020, helping you time gold buys perfectly.
Federal Reserve studies show uncertainty spikes often lead to 15-20% drops in gold prices.
Factors Influencing Gold Demand
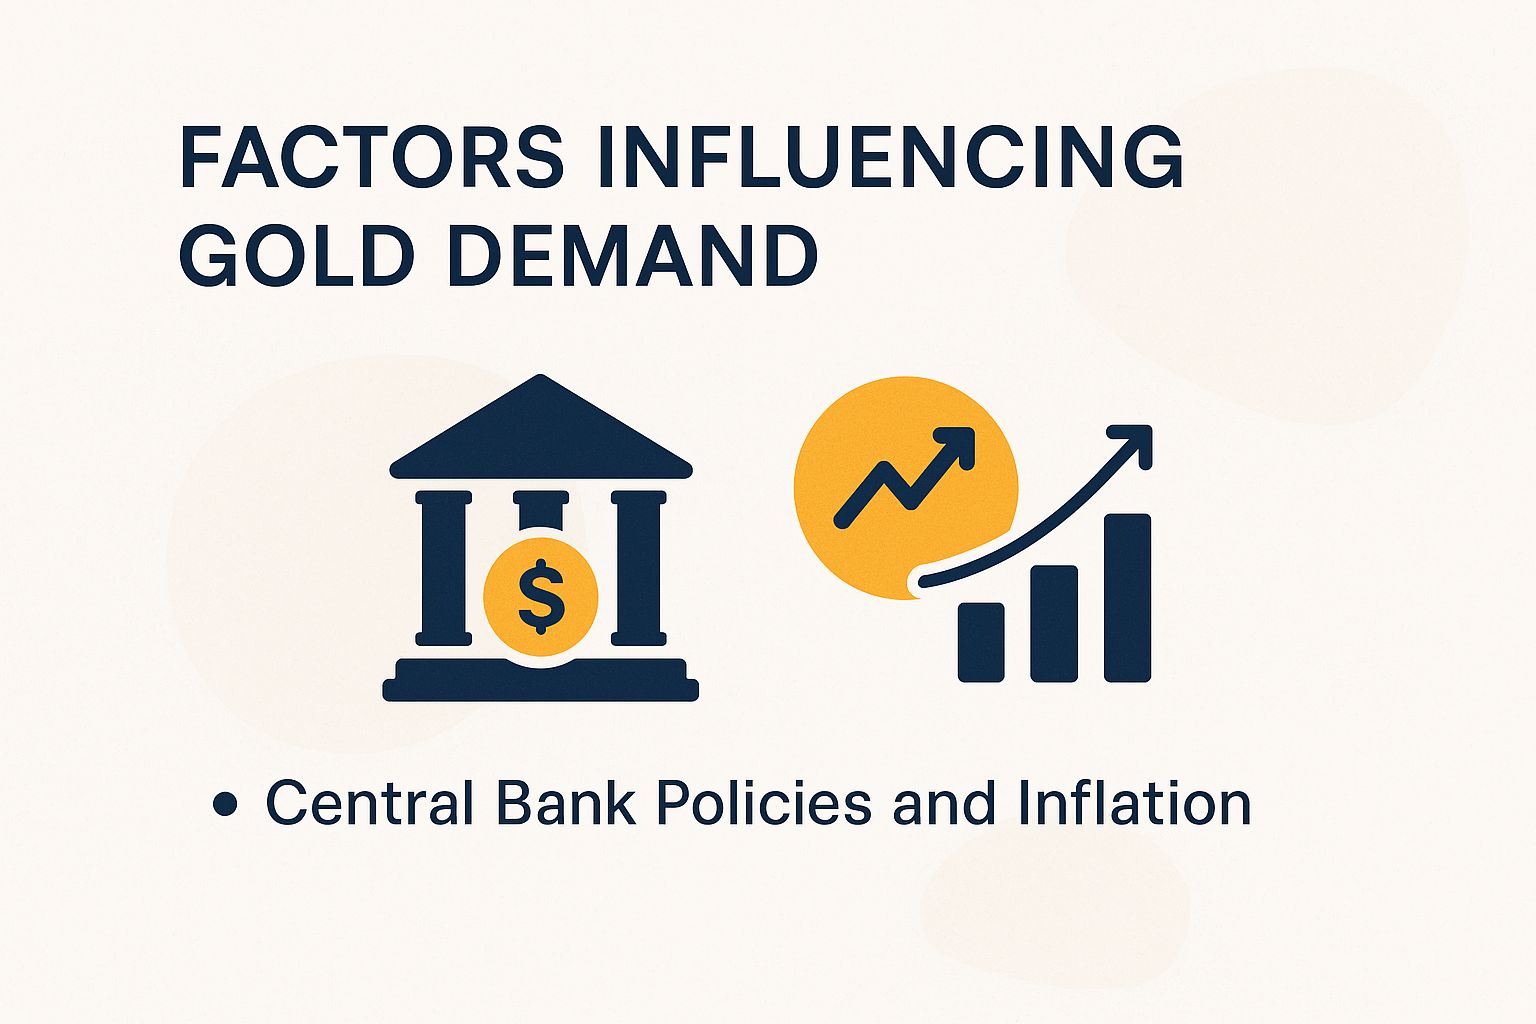
According to the World Gold Council, central bank gold purchases reached 1,136 tonnes in 2022-the highest volume since the 1960s-and accounted for 25% of total global gold demand.
Central Bank Policies and Inflation
Inflation over 3%? Gold demand jumps 20%. Central banks like China’s PBOC snapped up 225 tonnes in 2022 to fight a 2.1% CPI rise-smart move! (CPI is a key measure of everyday price changes.)
Central banks buy gold to fight falling fiat money value when they cut rates.
Take 2020: The Fed dropped rates to 0-0.25%, slashing real yields- that’s interest minus inflation-to negative territory.
When real yields fall below zero, gold emerges as an effective hedge against such economic pressures.
A historical example occurred between 1979 and 1981, when U.S. inflation reached 13% according to Bureau of Labor Statistics (BLS) CPI data, driving a 125% rise in gold prices.
Watch Fed and ECB docs on quantitative easing-it’s money printing that boosts gold!
World Gold Council research backs it: These moves crush inflation threats!
Investment Strategies for Gold in a Recession
It is recommended to allocate 8-10% of a portfolio to gold during recessions, which can reduce drawdowns by up to 30%, in accordance with BlackRock’s 2023 asset allocation guide.
- Step 1: Assess your portfolio risk.
- Step 2: Allocate 8-10% to gold via ETFs or bullion.
- Step 3: Monitor economic indicators weekly.
- Start by checking your risk tolerance. Take Vanguard’s free online quiz at investor.vanguard.com. It takes just 10 minutes.
- Pick your gold investment option. Try the GLD ETF, which trades at about $180 per share and sells easily. Or buy physical gold from JM Bullion, starting at $2,000 per ounce. (ETF means Exchange-Traded Fund, like a stock that tracks gold prices.)
- Invest steadily to beat ups and downs. Put in $500 each month. This is called dollar-cost averaging-it helps you buy more when prices are low.
- Rebalance the portfolio quarterly to maintain the designated allocation.
- Monitor performance using tools from Yahoo Finance or Morningstar.
The initial setup process typically requires about one hour.
Picture this: In 2008, this gold strategy delivered a thrilling 25% gain while the S&P 500 crashed 37%. Follow the SEC’s diversification rules to boost your chances-spread your investments to lower risks. (SEC is the U.S. agency that regulates investments.)
Risks and Counterarguments
The volatility inherent in gold investments can result in short-term losses of up to 20%, as evidenced by the 28% price decline in 2013 during the Federal Reserve’s tapering measures, according to Kitco analysis.
Along with volatility, several key risks warrant consideration:
- Bull markets can hurt. Gold lagged the S&P 500 by 15% a year from 2010-2020 (Federal Reserve data). You might miss stock gains.
- Physical gold needs safe storage. Expect 1% yearly fees for security.
- Deflation hits gold hard. Prices fell 10% in the 1930s (Federal Reserve records).
- A stronger dollar pushes gold down. A 10% DXY rise often cuts prices (J.P. Morgan reports). (DXY tracks the dollar’s value.)
Beat these risks head-on. Use simple hedging with options (contracts to protect against price drops) or add silver to your mix for better spread.
Gold isn’t always a perfect shield. It stayed flat in the 1990s and rose just 5% in the 1987 crash.