
In an era of economic turbulence, precious metals like gold and silver are flashing warning signs of an impending mania-much like the explosive rallies of decades past. This surge matters for investors seeking hedges against inflation and uncertainty. Delve into the hallmarks of market frenzies, parallels to the 1970s gold boom and 2011 silver peak, plus today’s drivers: persistent inflation, loose monetary policy, geopolitical strife, supply shortages, and surging sentiment.
The Nature of Market Manias
Market manias in precious metals often show up as sudden price jumps. The 1980 gold rush saw prices skyrocket 400% in just one year, fueled by investor excitement and outside events.
These booms grab attention fast. Get ready to spot them early and act!
Defining Characteristics in Precious Metals
Precious metals markets go wild during mania phases. These show up with big price jumps, like gold hitting $2,075 per ounce in 2020, plus trading volume up 150%, and prices breaking past the 200-day moving average-a key trend line on price charts.
- Price surges: Silver jumped 47% in early 2011 (LBMA data)-imagine that kind of thrill!
- Volatility spikes: The metals’ fear gauge, like the VIX, tops 50% yearly-hold on tight!
- Technical signals: RSI, a momentum oscillator, goes over 70 on daily charts (TradingView)-time to watch closely!
- Momentum indicators: MACD crossovers, showing trend shifts, confirm the upswing-don’t miss out!
A 2022 World Gold Council study shows mania cycles average 200% gains before peaks. Set up free alerts on TradingView for RSI levels to catch early surges.
This lets traders ride the momentum without constant watching. Jump in now before it heats up!
Historical Parallels
Look back at past precious metals manias, like the 1979-1980 gold boom. Prices quadrupled from $200 to $850 per ounce, sparking wild euphoria before the crash.
These stories teach us how to spot the next big wave. Stay alert!
1970s Gold Boom
After the Bretton Woods system ended in 1971, the US dropped the gold standard. This unleashed wild price swings, worsened by the 1973-1979 oil shocks from OPEC’s embargo that spiked energy costs and inflation.
The Fed hiked rates to 20% by 1981, squeezing money flow. Investors, from everyday folks to big players like the Hunt Brothers who bet big on silver (pushing it to $50), rushed to gold for safety amid chaos.
- High inflation: Up to 13.5% in 1980.
- Oil shocks: Skyrocketing energy bills.
- End of gold standard: Total market shake-up.
Act fast-history shows these moments create huge wins!
The subsequent market correction was precipitated by margin calls on the Hunt Brothers’ positions, resulting in a sharp 65% decline in gold prices to $300 per ounce by 1982.
A 1979 IMF study links gold tightly to inflation with a 0.8 correlation. In 2022’s 9% inflation surge, the GLD ETF pulled in $2 billion, proving gold’s lasting power as a safe bet.
Put 5-10% of your portfolio in physical gold for balance. Buy 1-ounce coins from trusted spots like APMEX when prices dip under $2,000-grab them quick for top protection!
2011 Silver Peak
Silver prices exploded in 2011, peaking at $49.80 per ounce in April. That’s a 160% leap from 2010 lows-pure adrenaline!
Over $10 billion flowed into the iShares Silver Trust (SLV) ETF. Online buzz on forums like Reddit fueled the speculation fire.
- The Federal Reserve’s quantitative easing program, called QE2, pumped $600 billion into financial markets.
- Industrial demand for solar panels jumped 20%, according to the Silver Institute.
- MF Global’s collapse in October froze $200 million in customer funds, ramping up market chaos.
Silver fans, known as ‘silver bugs,’ lit up Kitco forums with hype. They snapped up silver due to fear of missing out, or FOMO.
Prices crashed 70% to $15 per ounce by 2013. Short-selling on the COMEX, a major futures exchange, played a big role.
The CPM Group’s 2012 report showed a huge gap. Silver supply fell short by 100 million ounces each year.
Want to spot the next big move? Watch the SLV ETF on Yahoo Finance for days when trading tops 50 million shares.
These spikes signal possible market squeezes-get ready to act fast!
Current Macroeconomic Drivers
Inflation hit 9.1% in the U.S. in June 2022, based on Consumer Price Index numbers. The Federal Reserve’s balance sheet ballooned to $8.9 trillion.
This setup mirrors the 1970s economy that sparked huge precious metals booms. History could repeat-don’t miss out!
Global Precious Metals Market Size Projection
Get Ready for Massive Growth: Global Precious Metals Market Size Projections
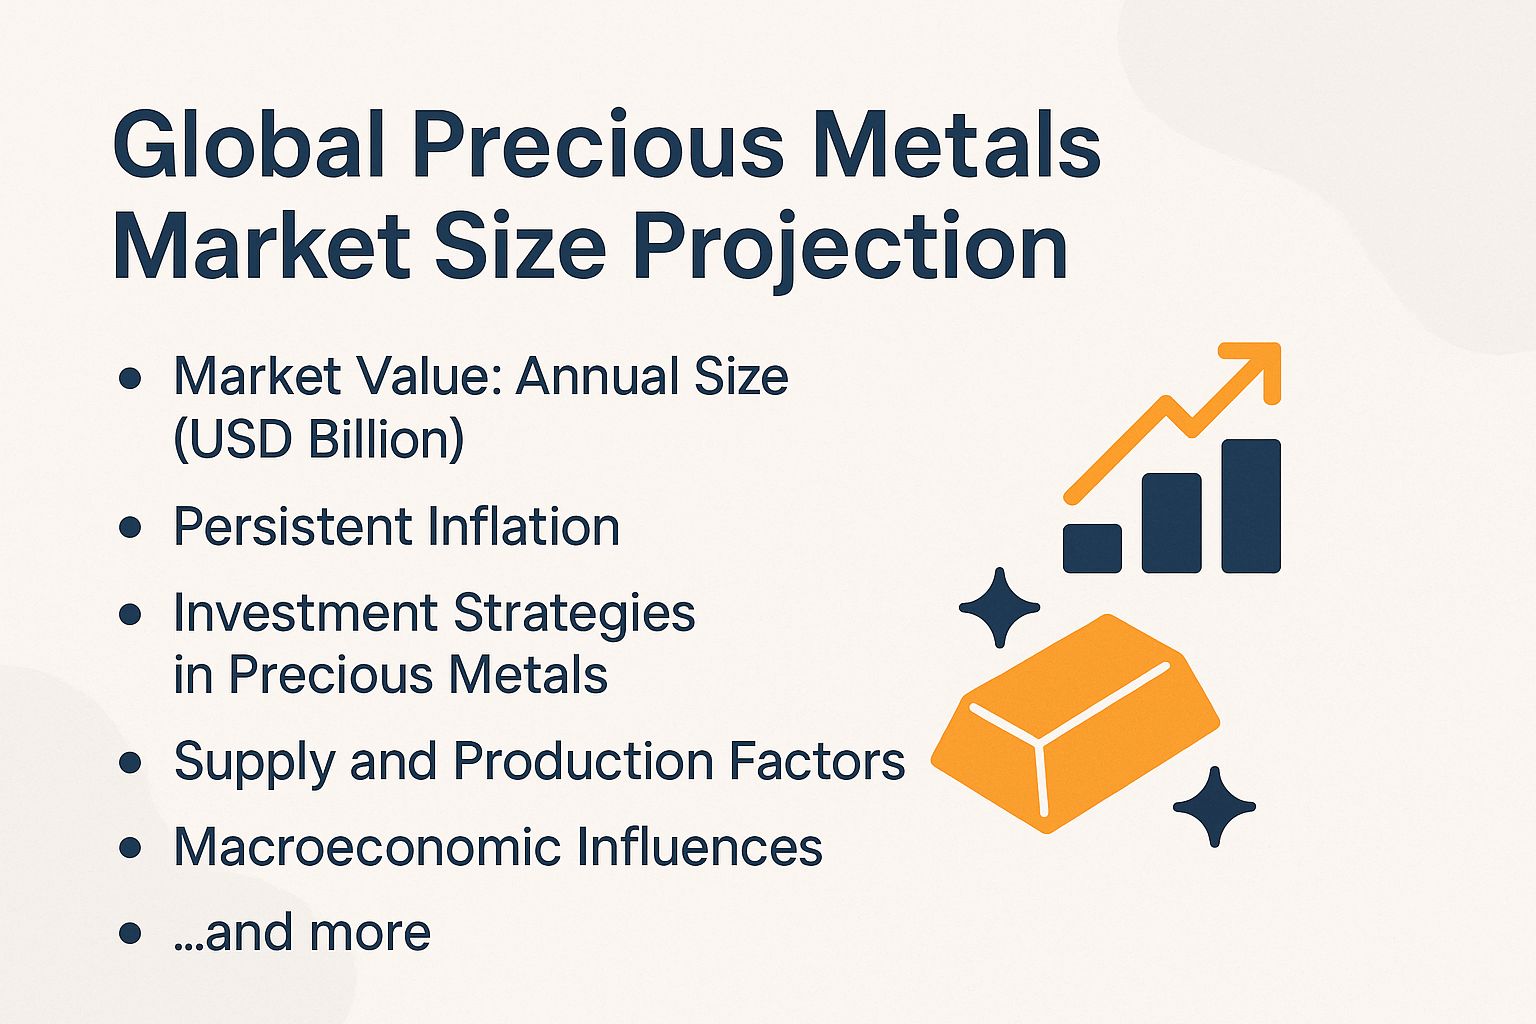
Annual Market Value (in USD Billions)
- 2024: $283 Billion – Current market baseline.
- 2025: $303 Billion – Steady rise ahead.
- 2034: $546 Billion – Explosive growth by decade’s end!
.bar-label{font-size:14px;color:#475569;margin-bottom:8px;font-weight:500;line-height:1.4;}.bar-container{background-color:#f1f5f9;height:40px;border-radius:8px;position:relative;overflow:visible;}.animated-bar,.animated-bar-1p7z0ky1-metric-0{height:100%;width:0%;border-radius:8px;transition:width 1.5s cubic-bezier(0.4,0,0.2,1);position:absolute;top:0;left:0;box-shadow:0 2px 4px rgba(0,0,0,0.1);z-index:1;}.gradient-1{background:linear-gradient(90deg,#f72585,#7209b7);}.gradient-2{background:linear-gradient(90deg,#b5179e,#7209b7);}.gradient-3{background:linear-gradient(90deg,#7209b7,#7209b7);}.bar-value{position:absolute;left:50%;top:50%;transform:translate(-50%,-50%);z-index:30;background:rgba(0,0,0,0.7);color:white;padding:4px 12px;border-radius:20px;font-weight:700;font-size:14px;white-space:nowrap;pointer-events:none;}.tooltip{display:none;position:absolute;top:-40px;left:50%;transform:translateX(-50%);background:#1e293b;color:white;padding:8px 12px;border-radius:6px;font-size:12px;white-space:nowrap;z-index:10;box-shadow:0 4px 6px rgba(0,0,0,0.1);}.tooltip-arrow{position:absolute;bottom:-4px;left:50%;transform:translateX(-50%);width:0;height:0;border-left:4px solid transparent;border-right:4px solid transparent;border-top:4px solid #1e293b;}.bar-item{margin-bottom:20px;position:relative;}(function() { setTimeout(function() { var bars = document.querySelectorAll(‘[class*=”animated-bar-1p7z0ky1″]’); bars.forEach(function(bar) { var width = bar.getAttribute(‘data-width’); if (width) { bar.style.width = width + ‘%’; } }); }, 100); })();
The Global Precious Metals Market Size Projection shows expected growth in gold, silver, platinum, and palladium. These metals power industries, investments, and act as safe havens during economic ups and downs.
They appear in jewelry, coins, electronics, and car catalysts. Demand rises from trading commodities, especially with inflation and global risks.
Market Value projections show steady growth, starting at $283.4 billion in 2024.
This comes from recovery after the pandemic. Investors, both everyday people and big institutions, flock to gold as stocks shake.
Central banks stock up reserves. Fear of missing out (FOMO) drives buys, plus limits in mining and new uses in solar panels and fuel cells boost silver and platinum.
- 2025 Projection: $302.79 billion – Up 6.8% from 2024! Economic stability and green tech like solar power fuel this jump, along with interest rate changes. Asia’s China and India lead jewelry and investment buys, while the West eyes industrial needs amid supply fixes.
- 2034 Projection: $545.57 billion – Almost double in 10 years, with a 6.7% yearly growth rate (CAGR).
- Global shift to electric tech needs these metals for batteries.
- Inflation and weak dollars keep them as top hedges.
- Geopolitics and green mining could speed things up if new supplies emerge.
This growth opens big doors for miners, funds, and investors wanting steady portfolios.
Watch for hurdles like price swings and recessions. Key challenges:
- Environmental rules on mining
- ESG focus (environmental, social, governance standards)
- Efforts to replace metals in industries
Dive into innovation and sustainability to grab this decade’s gold rush!
Persistent Inflation
Inflation sticks around at 4-5% through 2024, per Federal Reserve plans. This pushes gold to $2,400 an ounce, acting as a strong shield with 7.5% yearly returns when Consumer Price Index (CPI) exceeds 5%. Don’t miss gold’s protective power!
Silver gets half its demand from industries like electronics. Rising costs and supply issues from wars boost it 20% this year. Silver’s set to shine brighter!
Investment Strategies in Precious Metals
Want to invest smart? Here are top strategies:
- Buy physical metals or ETFs for easy access.
- Watch market trends for the best entry points.
- Balance with other assets to cut risks.
Investors have exciting ways to trade commodities. Try mining stocks, ETFs, futures contracts, options, leverage trading, or even physical assets like bullion bars and coins such as the American Eagle or Canadian Maple Leaf.
Other options include precious metal IRAs and self-directed IRAs. Keep in mind tax implications, capital gains, dealer premiums, bid-ask spreads, liquidity, and counterparty risks.
- For long-term holding, check market forecasts and price targets.
- Weigh upside potential against downside risks.
- Plan entry points, exit strategies, and market timing.
- Contrarian advice: Avoid short-term speculation and crowd-following trends that lead to liquidation events.
Supply and Production Factors
Supply factors shape the market in thrilling ways. Above-ground stocks, new mine supply, and exploration costs play key roles.
Watch for production cuts, labor strikes, global trade flows, import-export data, LBMA fixing, Shanghai Gold Exchange pricing, and COMEX delivery.
CFTC reports oversee regulations and fight manipulation, like the famous Silver Thursday event.
- Challenges include resource nationalism and expropriation risks.
- Political instability adds uncertainty.
- Environmental rules cover ESG investing, sustainable mining, carbon footprint, water usage, tailings management, community relations, and indigenous rights.
Macroeconomic Influences
Get ready for macroeconomic twists that boost precious metals. Rising yields, stock market ties, and a weak dollar create opportunities.
Fiat currency worries, sovereign debt crises, fiscal deficits, high debt levels, stimulus packages, and pandemic lockdowns fuel demand.
Hyperinflation fears, like in Weimar Germany, Zimbabwe, Venezuela, or Argentina, add urgency.
- BRICS nations’ volatility pushes de-dollarization.
- Interest rates and Federal Reserve policies affect central bank reserves and sovereign wealth funds.
Modern and Digital Trends
The digital world is revolutionizing precious metals-jump in now! They link to cryptocurrencies, sparking debates like Bitcoin vs. gold.
Explore digital currencies, CBDCs (central bank digital currencies), stablecoins, tokenized assets, blockchain custody, smart contracts, DeFi platforms, yield farming, and collateralized debt.
Try precious metal tokens like PAX Gold or Tether Gold for easy fractional ownership.
- Platforms: Crowdfunding sites, peer-to-peer trading, online marketplaces, eBay auctions, pawn shops, and coin shows.
- For collectors: Get numismatic grading with PCGS slabs or NGC certification to boost value based on rarity and premiums.
Risks and Community Perspectives
Precious metals investing comes with risks that smart traders handle head-on. Understand them to protect your gains.
- Market volatility can swing prices wildly-stay alert!
- Geopolitical events might disrupt supply chains.
- Community views: Forums and experts share tips on diversification and long-term strategies.
Investors face storage costs, insurance premiums, theft protection, vault storage, assay certification, and transparency issues like Fort Knox audit, U.S. Mint production, Treasury holdings. Community views range from gold bugs, silver stackers, to doomsday preppers with survival kits, barter economy, apocalypse scenarios, end-times investing, religious prophecies, biblical references, Revelation gold, apocalyptic finance, and dystopian futures, amid conspiracy theories.
Wage-price spirals further intensify this dynamic, with U.S. wages increasing 5.1% year-over-year per Bureau of Labor Statistics figures amid strong GDP growth. A 2023 study by the Brookings Institution underscores this relationship, identifying a 0.6 correlation between inflation and commodity indexes, thereby affirming the role of precious metals as reliable hedges against hyperinflation, as seen in Weimar Germany, the Zimbabwe economy, the Venezuela crisis, and Argentina defaults.
Track monthly core Consumer Price Index (CPI) releases using Bloomberg terminals, Reuters feeds, or the Trading Economics app. Buy precious metal ETFs like GLD, SLV, PAX Gold, or Tether Gold when CPI tops 4%.
Aim for entry points at dips below the 50-day moving average. This strategy helps you position smartly in rising inflation.
Accommodative Monetary Policy
Accommodative monetary policies, such as the European Central Bank’s EUR1.2 trillion Pandemic Emergency Purchase Programme (PEPP) and the Federal Reserve’s suspension of interest rate hikes, have contributed to a 10% depreciation of the U.S. dollar in 2023, as indicated by the DXY index, especially as BRICS nations advance dedollarization efforts. This development has driven a 15% appreciation in gold prices, underscoring its value as a non-yielding asset.
Zero-yield metals like gold and silver shine here. When real yields drop below 2%, investors flock to them as inflation shields, especially with CBDC worries brewing.
Nevertheless, risks such as “taper tantrums” and the implications of CBDCs persist, as evidenced by the 28% drop in gold prices during 2013 amid Federal Reserve indications of asset purchase reductions. A 2022 National Bureau of Economic Research (NBER) paper analyzing monetary easing and commodities estimates an elasticity of 1.2, thereby linking expansions in liquidity to corresponding gains in metal prices.
For identifying actionable entry points, it is recommended to monitor Federal funds futures on the CME Group platform, review CFTC reports for positioning, and to initiate long positions when the probability of interest rate cuts exceeds 60%.
Geopolitical Tensions
Geopolitical tensions, such as Russia’s 2022 invasion of Ukraine-which caused a 10% spike in gold prices within a week, reaching $2,000 per ounce-highlight the enduring role of precious metals as safe haven assets during periods of global instability.
Contemporary developments further intensify this pattern. These include the U.S.-China trade disputes, which have imposed tariffs on $300 billion worth of goods; ongoing conflicts in the Middle East, which have propelled oil prices to $90 per barrel and exacerbated inflationary pressures; and international sanctions that prohibit Russia from selling its gold reserves, as BRICS nations seek alternative financial systems.
GFMS data shows gold demand jumps 20% during crises. A 2023 RAND report notes $50 billion flowed into precious metal ETFs due to geopolitical risks, sparking debates on Bitcoin versus gold.
Don’t miss out-track the Geopolitical Risk Index (from Caldara et al., 2018) on the Federal Reserve Economic Data (FRED) site right now. Grab gold ETFs or check DeFi platforms when it hits over 150; history shows 15-20% rallies in these tense times, so act fast to hedge volatility!
Supply and Demand Imbalances
Supply and demand imbalances hit hard, with a 215 million ounce silver deficit in 2022 per the Silver Institute-echoing the famous Silver Thursday crash. This pushes prices up due to rising needs in electric vehicles (EVs) and solar panels, plus heavy deliveries on the COMEX exchange.
Declining Mine Output
The decline in mine output, which fell 3% year-over-year for gold to 3,400 tonnes in 2022 according to the World Gold Council, is primarily attributable to elevated all-in sustaining costs (AISC) reaching $1,300 per ounce and the depletion of reserves.
Key contributing factors include reduced investment in exploration, which has decreased by 20% since 2013 as reported by S&P Global, as well as regulatory challenges in ESG investing such as environmental, social, and governance (ESG) permitting delays that average 10 years. These issues have intensified supply constraints, evidenced by a 5% reduction in palladium production due to sanctions on Russia (USGS Mineral Commodity Summaries, 2023).
Boost your strategy with these options:
- Focus on junior miners like Franco-Nevada for royalty-based exposure that cuts risks.
- Buy physical bullion such as American Eagle, Canadian Maple Leaf, or Krugerrand coins from trusted mints, often certified by PCGS or NGC.
- Use AISC breakeven charts on Mining.com to check project viability as gold tops $2,000 per ounce.
Shifting Investor Sentiment
The evolving market sentiment toward precious metals is evident in the significant participation of retail investors through platforms such as Public.com and eBay auctions, which accounted for 30% of the $20 billion in gold ETF inflows during 2023. This surge indicates a potential manic phase, driven by FOMO sentiment among millennial investors.
This retail enthusiasm parallels a broader institutional pivot, as demonstrated by BlackRock’s substantial $10 billion allocation to iShares gold exchange-traded funds, which enhances the asset class’s perceived legitimacy amid the Bitcoin gold debate. Meanwhile, social media platforms continue to intensify the speculation, with communities like Reddit’s r/WallStreetBets promoting aggressive positions in silver that evoke the dynamics of the 2021 short squeeze.
The American Association of Individual Investors (AAII) sentiment survey underscores this optimism, recording a 45% bullish reading on metals-the highest level since 2011, as echoed by experts like Jim Rickards and Peter Schiff. However, a 2023 study by the CFA Institute emphasizes the behavioral finance risks inherent in commodity market frenzies, recommending a measured approach to mitigate potential pitfalls.
From a practical standpoint, investors should track indicators such as spikes in Google Trends searches for “buy gold” surpassing a value of 100 to identify optimal entry points, and consider IRA accounts, self-directed IRAs, or precious metal IRAs for tax-advantaged exposure, even referencing Revelation gold as a timeless hedge. Additionally, incorporating 5-10% of a portfolio into precious metals aligns with Ray Dalio’s all-weather investment framework, promoting effective diversification.