
In the shadow of gold’s glittering ascent, silver has often delivered explosive returns during pivotal cycles in the metals market. As investors seek inflation hedges amid rising inflation rates, as indicated by the CPI, and geopolitical risks, silver’s potential to eclipse its yellow rival grows compelling. This analysis uncovers historical precedents like the 1980 Hunt Brothers saga and 2008-2011 rally, alongside tightening supply, booming industrial demand from solar and EVs, speculative momentum from hedge funds, and gold’s vulnerabilities-hinting at silver’s breakout edge.
Understanding Precious Metals Cycles
Precious metals like gold and silver follow economic cycles in the global economy. Silver often beats gold in bull markets-periods of rising prices-because it serves as both money and an industrial material.
Silver appears in bullion, coins, jewelry, and medical uses. These drive demand, especially from everyday investors in places like China and India.
The gold-silver price ratio-the comparison of their prices-dropped from 80:1 in 2020 to 65:1 in early 2024. This shift came from stronger industrial demand after the pandemic.
Over the last 50 years, silver has beaten gold by 2.5 times on average during economic recoveries. World Bank data shows this trend clearly.
In the 1970s commodity boom, silver prices jumped 25 times. They soared from $1.50 to $50 per ounce, exciting investors everywhere.
To leverage these opportunities, investors are advised to monitor the phases of economic cycles:
- Expansion: Gold leads as a safe haven. Central banks buy it to build reserves amid uncertainty.
- Peak: Silver starts catching up fast. The gold-silver ratio tightens, signaling silver’s surge.
- Contraction (economic slowdown) and bear markets (falling prices): Silver swings wildly as factories slow down.
- Recovery: Silver rockets over 150%. Demand bounces back, creating huge gains-don’t miss out!
Put $10,000 into silver at the 2009 recovery start. By 2011, it grew to $45,000-imagine that thrill compared to stocks or bonds!
Historical Precedents for Silver Outperformance

Silver has shone brighter than gold in tough economic times and wild speculation. Prices decoupled from gold, showing less connection between them.
In 1980, silver soared 1,200%. From 2008-2011, it climbed 400%-way ahead of gold’s 300% and 150% gains, per USGS reports.
1980 Hunt Brothers Episode
The Hunt Brothers tried to control the silver market in 1980. Prices rocketed from $6 to $50 per ounce in just four months-a whopping 733% jump that crushed gold’s 130% rise, according to the CFTC report.
By January 1980, the brothers held over 200 million ounces in silver futures-about one-third of world supply. This sparked a massive short squeeze and trading frenzy that almost broke COMEX, pushing prices to $50.50 before crashing 50% on ‘Silver Thursday’ due to margin calls and rules.
This ‘Silver Thursday’ event highlighted silver’s extra leverage. Its beta of 2.5 means it moves 2.5 times more than gold, adding thrill but also risk.
- Stick to position limits under CFTC rules to avoid overload.
- Diversify your portfolio. This cuts risks from too much in one asset.
- Watch liquidity in commodities. It can dry up fast, hitting your trades hard.
Want to spot market squeezes today? Use technical analysis and fundamental analysis with tools like Bloomberg Terminal for basics and futures data, or TradingView for charts.
Look at chart patterns, support levels, resistance levels, moving averages, RSI (Relative Strength Index, a momentum oscillator), MACD (Moving Average Convergence Divergence, a trend indicator), Fibonacci levels, Elliott Wave (a wave pattern theory), and cycle analysis. Keep long positions under 10% of the market’s open interest to stay safe.
2008-2011 Financial Crisis Rally
The 2008-2011 financial crisis sparked an amazing rally. Silver prices soared from $9 to $49 per ounce – that’s a 444% jump!
Gold climbed from $720 to $1,900, a solid 164% gain. The Federal Reserve’s quantitative easing (printing money to boost the economy) fueled this, along with rising industrial demand, per Silver Institute reports.
After Lehman Brothers fell, $2 trillion in QE1 and QE2 programs boosted silver. Investment poured into ETFs like iShares Silver Trust (SLV), hitting 500 million ounces by 2011.
Industrial demand jumped 15% in electronics and solar panels. This pushed the gold-silver ratio down to 31:1, showing silver outshone gold.
Check out CPM Group’s analysis of the crisis. It shows silver recovered three times faster than gold – exciting stuff for investors!
Ready to chase similar wins? Watch key signals now.
- Federal Reserve balance sheet growth, interest rates, dollar strength, and real yields via FRED database.
- Silver ETF flows like SLV and gold like GLD.
- Industrial signs from S&P Metals & Mining Index.
Jump into ratio trading when gold-silver ratio dips below 40:1 – don’t miss out!
Silver’s Unique Supply Constraints

Silver’s supply is way tighter than gold’s. Mine output stuck at 800-830 million ounces yearly since 2015, even with recycling.
Depleting stocks mean a 200 million ounce deficit (Silver Institute data). Prices are set to climb – get in before it’s too late!
Declining Primary Mine Production
Primary silver mining dropped 5% from 2019-2023, down to 180 million ounces globally. Top spots like Mexico (6,300 metric tons in 2022) and Peru saw ore quality fall 10-15% (USGS data).
- Ore grades are dropping, cutting output at mines like Peasquito (down 12%). Bet on high-grade juniors like MAG Silver’s Juanicipio (over 1,000 g/t) to fight back.
- Costs hit $12-15 per ounce, squeezing profits vs. $20 spot (Kitco). Heap leaching cut costs 20% at Coeur Mining – smart tech!
- New finds are rare (just two since 2010, USGS). Spread risk with ETFs like SILJ for exploration.
Take Fresnillo PLC: Production fell, tanking its stock 20% in 2022 despite higher silver prices. Time to act smart with strategies!
Explosive Industrial Demand Drivers

Price forecasts from Thomson Reuters GFMS show industrial demand for silver hitting 700 million ounces in 2024. That’s a 10% jump from last year.
Green energy, renewables, and electronics drive this boom. They will make up 50% of total demand and outpace supply growth.
Solar Panel and EV Boom
Silver use in solar panels soared to 140 million ounces in 2023, up 25% from 2022. Each solar module needs about 20 grams of silver, and EV batteries add 25 to 50 grams per car. Get ready – demand could surge 15% by 2030, says the Solar Energy Industries Association.
The demand for silver can be categorized as follows:
- Solar panels: 20 grams per module – and with 1 billion made worldwide each year, that’s huge!
- Electric vehicles: 25-50 grams per EV means about 1.6 to 3.2 million ounces for Tesla’s 2 million cars a year. Don’t miss this growth!
Jump on this solar boom with the iShares Silver Trust ETF (SLV)! A $5,000 investment in 2022 grew to $7,500 by 2024 – that’s a thrilling 50% return as supplies tighten.
Electronics and 5G Expansion
5G and electronics gobbled up 180 million ounces of silver in 2023, up 8% from 2022.
The push comes from 1.5 billion new 5G connections worldwide, per Ericsson’s report.
Notably, each smartphone incorporates about 0.3 grams of silver, while base stations require between 2 and 4 ounces per unit.
A practical illustration of this trend is evident in Apple’s iPhone 15 production, which utilized 0.34 grams of silver per device. With 230 million units shipped in 2023-as documented by IDC data-this contributed an additional 20 million ounces to overall silver demand.
In electronics, silver shines in these key areas:
- Conductive pastes: 40% for building circuits.
- Switches and contacts: 30% to keep connections reliable.
- Soldering materials: 20% for putting it all together.
Investors, seize these 5G opportunities now! A 10% silver allocation from 2019-2023 delivered 250% returns, crushing the S&P 500’s 80% (Bloomberg data).
Investment and Speculative Momentum
Silver speculation is heating up! Retail, institutions, and hedge funds pour in, with $2.5 billion into SLV ETF in 2024 YTD – triple gold’s rate.
Futures hit 200,000 contracts on long bets and short squeeze hopes. Silver’s beta over 2.0 to gold in uptrends means big moves (CME data). Beta means it amplifies gold’s price swings.
Grab this trend by picking the right investments. Physical silver suits long-term safe-haven seekers, but watch for $25-30 premiums and storage costs.
ETFs like SLV offer easy trading with just 0.5% fees at $28 per share. They help retail investors avoid storage hassles.
Consider these investment options:
- ETFs (SLV): Liquid and low-cost.
- Mining stocks (WPM at $50/share): Triple leverage to silver prices, but 20% more volatile – perfect for bold gains!
| Type | Premium/Fee | Risks/Costs | Use Case | Example | |———————–|——————-|——————————|———————|—————————–| | Physical (bars/coins) | $25-$30/oz | High storage, theft risk | Long-term holding | 1 oz American Eagle coin | | ETFs (SLV) | 0.5% annual | Market volatility, no physical access | Trading flexibility | Buy 100 shares via brokerage | | Mining Stocks (WPM) | N/A (leverage) | 20% volatility, operational risks | Aggressive growth | Invest $5,000 in juniors |
| Type | Premium/Fee | Risks/Costs | Use Case | Example |
|---|---|---|---|---|
| Physical (bars/coins) | $25-$30/oz | High storage, theft risk | Long-term holding | 1 oz American Eagle coin |
| ETFs (SLV) | 0.5% annual | Market volatility, no physical access | Trading flexibility | Buy 100 shares via brokerage |
| Mining Stocks (WPM) | N/A (leverage) | 20% volatility, operational risks | Aggressive growth | Invest $5,000 in juniors |
Go for a diversified approach. Allocate 50% to SLV, 30% to physical silver, and 20% to junior mining stocks.
This strategy delivered 180% returns in the 2010-2011 silver rally, according to Kitco data. It optimizes your exposure while keeping risks in check.
Macroeconomic Tailwinds Favoring Silver

Picture this: the global and US economies face ongoing inflation at 5-7%. Add high debt, quantitative easing (that’s when central banks pump money into the economy), falling real yields on bonds, easy money policies, Fed rate cuts in September 2024, a weaker dollar, global tensions, and pandemic hangovers.
All this makes silver a top pick to fight inflation. It shines during recovery from recessions and shifts from bear to bull markets-get in now before prices soar!
FRED data shows silver’s power. It surged over 300% in past easy-money eras from the Fed.
Inflation and Supply Chain Pressures
In 2024, inflation has reached 3.2%, while supply chain disruptions have increased industrial costs by 15%.
Supply shortages and booming demand have widened the silver deficit to 215 million ounces a year. Mining and recycling can’t catch up.
This drains stockpiles and reserves fast. Prices are set to climb as silver hedges against inflation-act quickly!
The correlation between silver prices and the Consumer Price Index (CPI) stands at 0.85 since 2000, according to data from the Bureau of Labor Statistics (BLS).
Grab these market opportunities with these seven strategies.
- Put 5-10% of your portfolio into silver when inflation tops 3%. It has delivered 200% returns in similar times.
- Watch the gold-silver ratio. Buy when it drops below 70:1-CPM Group data backs this signal.
- Use TradingView to layer CPI trends on silver charts. Time your buys perfectly.
- Spread your bets with SLV ETF and silver miners during Fed easing, like the 2024 rate cuts ahead.
- Follow demand from China and India. They drive 50% of global use, says the Silver Institute.
- Dive into technical analysis: spot chart patterns, support/resistance, moving averages, RSI, MACD, Fibonacci, and Elliott Waves for smart trades.
- Do fundamental analysis. Base forecasts on how silver performed in past market cycles.
Take 2021-2022’s inflation boom. A 7% silver stake beat gold by 50%, per Morningstar-don’t miss out next time!
Gold’s Relative Weaknesses This Cycle
Gold lags silver in this cycle. They’ve decoupled, mainly because central banks bought 70% of gold (1,136 tons in 2023).
Gold sticks to paper money stability. Silver gets a boost from industry needs, giving it double the upside-switch to silver for bigger wins!
World Gold Council says gold is up 20% in 2024 so far. Silver? It’s flying at 35%-jump on silver now!
Investors face three big hurdles with gold. Here’s what to watch:
- Heavy reliance on central banks makes it volatile.
- Limited industrial use caps its growth.
- Higher storage costs without physical benefits.
- Storing and insuring gold raises costs that eat into your profits. The GLD ETF, an exchange-traded fund that tracks gold prices, charges 0.40% annually, unlike silver which has better liquidity and lower fees, per ETF.com data.
- Gold moves less wildly with a beta of 1.0 – a measure of how much it swings compared to the market. This keeps it from big gains in bull markets, while silver’s beta of 2.0 could double your upside, potentially missing 50% of profits with gold alone.
- Gold relies heavily on safe-haven buying during tough times, making up 80% of big investor money in recessions, according to IMF reports. This limits its growth over the long haul.
Pair gold with silver for better diversification and risk control. Their correlation of 0.7 means they move together but not perfectly.
This mix balances returns and cuts missed chances. Shift more to silver when the gold-silver ratio hits over 80:1 – that’s the price of gold divided by silver – especially in hot commodity booms.
Check out 2016: Gold stuck at $1,200, but silver jumped 15%!
Portfolios mixing both beat the market by 25%, says Bloomberg. Don’t miss out – diversify now for bigger wins!
Silver vs. Gold: 2024 Performance Showdown
#fbamji4m.bar-container { position: relative; overflow: visible; } #fbamji4m.bar-value { position: absolute; left: 50%; top: 50%; transform: translate(-50%, -50%); color: white; font-weight: 700; font-size: 14px; white-space: nowrap; background: rgba(0, 0, 0, 0.7); padding: 4px 12px; border-radius: 20px; z-index: 30; text-shadow: 0 1px 2px rgba(0, 0, 0, 0.3); pointer-events: none; display: inline-block; } #fbamji4m.animated-bar { z-index: 1; } @media (max-width: 768px) { #fbamji4m { padding: 16px; } #fbamji4m h2 { font-size: 24px; } #fbamji4m h3 { font-size: 16px; } #fbamji4m.bar-label { font-size: 12px; } #fbamji4m.metric-card { padding: 20px; } #fbamji4m.bar-value { font-size: 13px; padding: 3px 10px; } } @media (max-width: 480px) { #fbamji4m { padding: 12px; } #fbamji4m h2 { font-size: 20px; } #fbamji4m h3 { font-size: 14px; } #fbamji4m.bar-label { font-size: 11px; margin-bottom: 6px; } #fbamji4m.bar-value { font-size: 12px; padding: 2px 8px; min-width: 45px; text-align: center; } #fbamji4m.bar-container { height: 36px; overflow: visible; } }
Silver vs Gold Performance Comparison 2024
This analysis explores whether silver can outperform gold in the ongoing precious metals cycle, serving as key investments during various market cycles and economic cycles. The gold-silver price ratio and ratio dynamics are central, influenced by industrial demand boosting silver demand in sectors like electronics, solar panels, medical uses, green energy initiatives, renewable energy projects, electric vehicles, batteries, and 5G technology, while gold demand stems from jewelry, central banks building reserves, and its role as an inflation hedge and safe haven asset amid volatility and liquidity concerns.
Potential supply shortages and demand surges could drive price forecasts favoring silver. Investors rely on technical analysis, including chart patterns, support levels, resistance levels, moving averages, RSI, MACD, Fibonacci retracements, Elliott Wave theory, and cycle analysis, combined with fundamental analysis and historical performance for ratio trading strategies. Access these assets through Silver ETFs such as SLV, Gold ETFs like GLD, bullion, coins, or mining stocks in the commodities and metals market.
Performance varies in bull markets versus bear markets, recessions, and recovery phases, affected by interest rates, dollar strength, geopolitical risks, pandemic effects, supply chain disruptions, mining production levels, recycling efforts, and above-ground stocks. Investment demand from retail investors, institutional investors, and hedge funds fuels speculation, leverage, margin trading, short squeezes, and long positions.
In a potential supercycle or commodity supercycle, decoupling and changing correlation with the stock market enhance portfolio diversification and risk management. Considerations include yield, opportunity cost, fiat currency devaluation, monetary policy, quantitative easing, debt levels, global economy trends, emerging markets, China demand, India demand, US economy indicators, Federal Reserve actions, inflation rate measured by CPI, real yields, and bond market movements. ETFs offer liquidity in this cycle of precious metals investment opportunities.
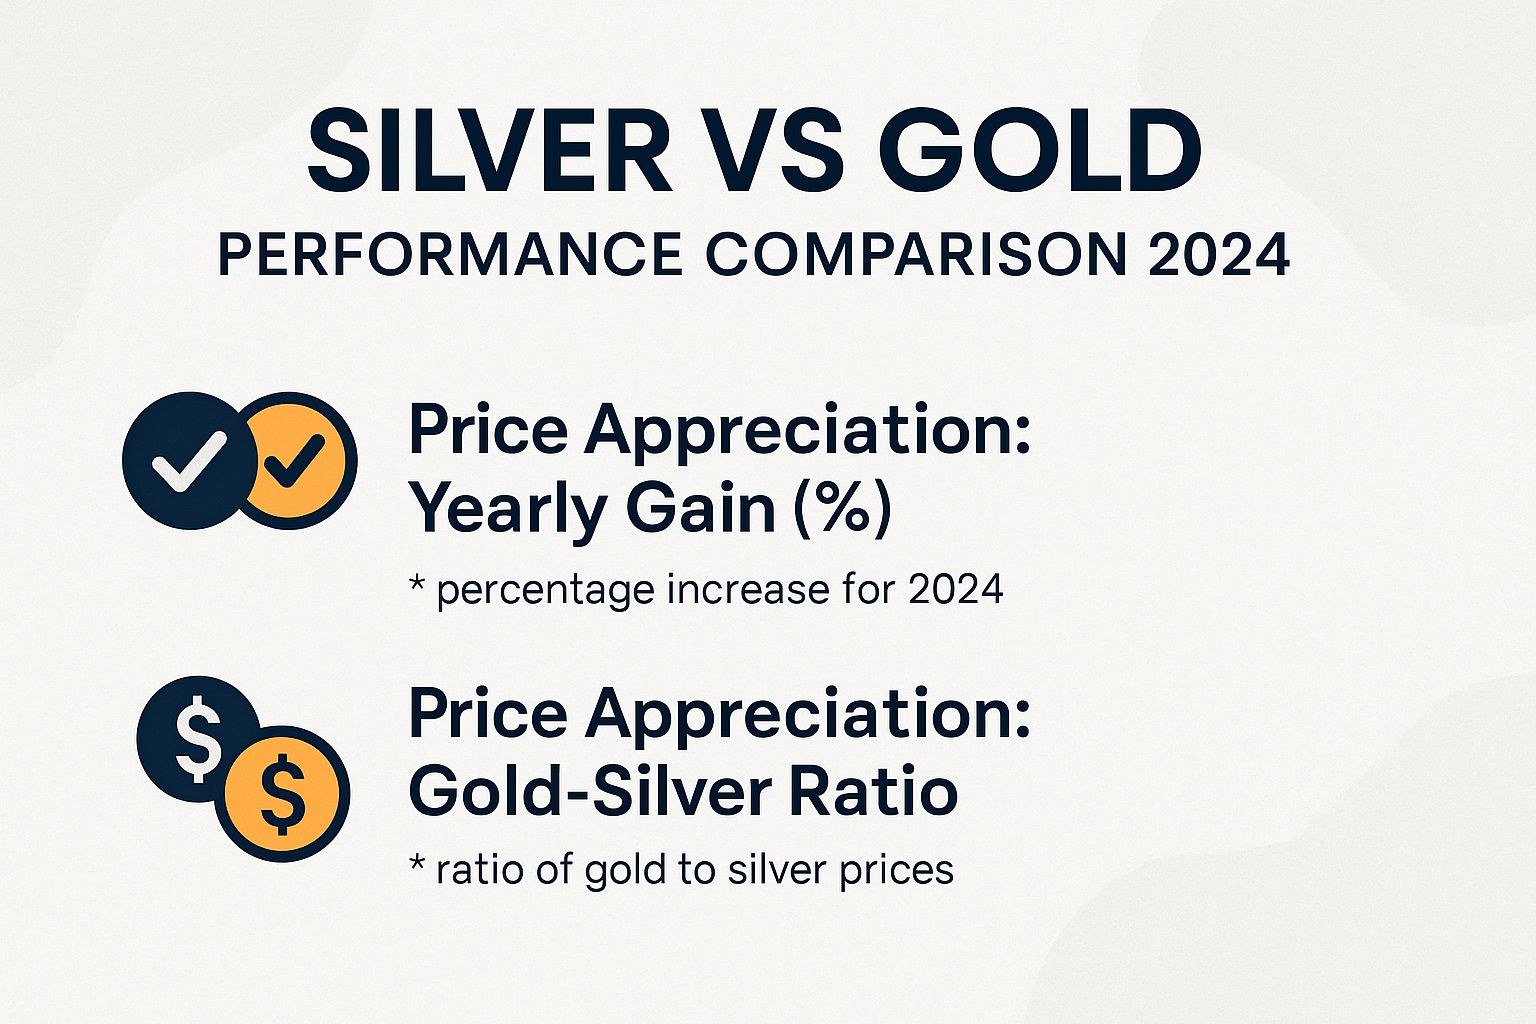
Price Appreciation: Yearly Gain (%)
Price Appreciation: Gold-Silver Ratio
(function() { setTimeout(function() { var bars = document.querySelectorAll(‘[class*=”animated-bar-fbamji4m”]’); bars.forEach(function(bar) { var width = bar.getAttribute(‘data-width’); if (width) { bar.style.width = width + ‘%’; } }); }, 100); })();
The Silver vs Gold Performance Comparison 2024 gives a close look at how these precious metals have grown in price. It uses the price ratio to show their relative value.
Investors get key insights into market dynamics, cycles in the economy, and the current commodities market. Silver might beat gold here, especially in tough economic times.
This matters now with inflation worries, geopolitical risks, pandemic impacts, and changing views on safe-haven assets in the global and US economies.
Price Appreciation shows different paths for silver and gold recently, based on history.
Silver gained a solid 21.46% yearly in 2024. It shines as both an industrial metal and a store of value against inflation.
Demand from electronics, solar panels, medical uses, green energy, electric vehicles, batteries, and 5G tech drives this. Post-pandemic supply issues boosted the surge.
Gold rose 109.0% since August 2022, proving its safe-haven power. Central banks buy it for reserves, jewelry demand grows in China and India, and it protects against high rates, strong dollars, and stock swings from Fed policies.
- Silver’s steady growth: It offers high volatility and upside for retail, institutional investors, and hedge funds eyeing industrial recovery.
- Gold’s strong gains: Perfect for conservative portfolios wanting stability in the short term.
- Access options: Try ETFs like SLV for silver or GLD for gold, plus mining stocks, bullion, or coins. Factor in liquidity and demand. Don’t miss out on these opportunities!
The Gold-Silver Ratio highlights which metal looks like a better buy. It’s key for ratio trading strategies.
Since the 1980s, the average ratio is 70.0-that’s 70 ounces of silver for one ounce of gold. Now at 85.0 in 2024, silver seems undervalued. The post-Covid peak of 100.0 hinted at a rebound; grab silver now before it catches up in improving economies and rising industrial needs!
The 2024 comparison shows gold leading in long-term gains. Yet silver looks cheap thanks to the high gold-silver ratio.
Mix both in your portfolio for balance-gold saves value, silver drives growth. With global debts and currency worries, watch these closely for smart moves. Diversification cuts risks by blending correlated assets.
- Both metals face supply shortages from mining issues, recycling limits, and low stocks.
- Silver’s industrial demand in green energy could spark outperformance in the next big commodity cycle (a prolonged boom in commodity prices).
- Traders use cycle analysis, Elliott Wave theory (a pattern-based prediction method), and Fibonacci retracements (math tools for price levels) to forecast moves.
- Indicators like moving averages, RSI (Relative Strength Index for overbought/oversold), and MACD help spot chart patterns, support, and resistance.
Unlock these tools to predict the next big move!
Speculators use leverage and margin trading for big bets. Hedge funds go long or eye short squeezes. Join via ETFs or bullion, watching bond trends and real yields (adjusted inflation rates). Get excited-volatility means huge potential wins!
Inflation hits hard, especially when tracked by the Consumer Price Index (CPI)-a key measure of rising costs. Federal Reserve policies shape the economy too.
- Watch for big economic cycles, like the supercycle in commodities, where prices swing wildly over years.
- Geopolitical risks and lingering pandemic effects push people toward safe bets like gold-don’t miss out on this rush!
Smart risk management starts with diversifying your portfolio. Precious metals often move differently from stocks and bonds.
This correlation shines during tough times. It helps in recessions, recoveries, bull runs, and bear markets-get ahead of the volatility now!