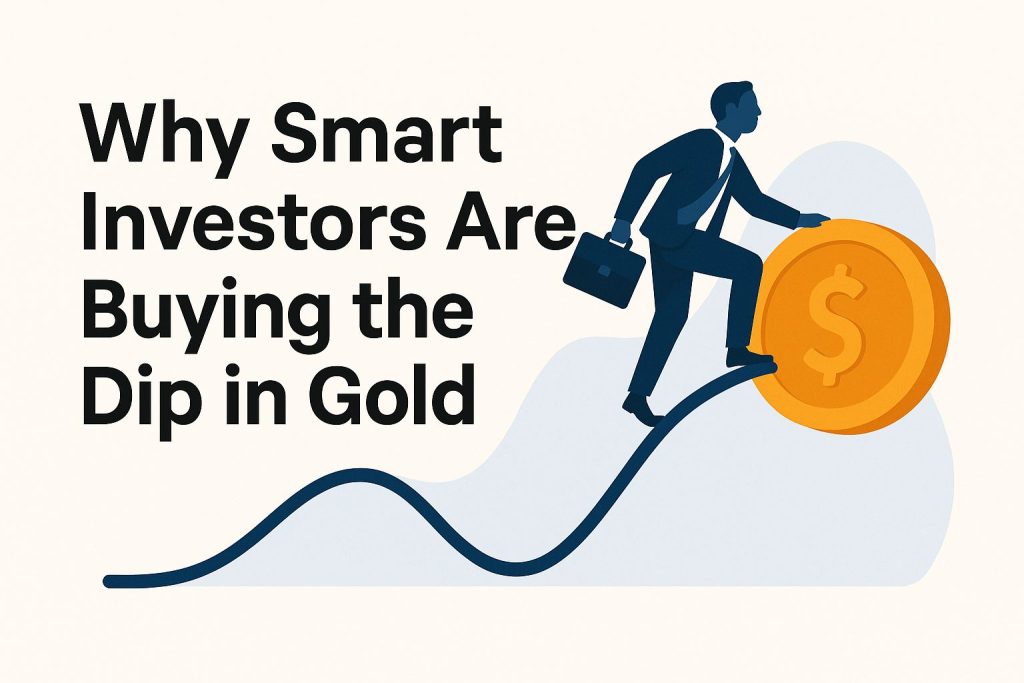
As gold prices tumble amid fleeting market jitters and recession fears, smart investors pounce on buying the dip. They see a rare chance to grab undervalued assets like gold, which has proven tough through history. Persistent inflation eats away at paper money, while rising global conflicts, shifting interest rates, and central banks grabbing gold make it a top pick for mixing up your investments and keeping wealth safe over time. Dive into what pushes this smart move, from gold shortages to cutting risks, and how it can protect your money in shaky economic times.
Understanding Gold Dips
Gold prices dipped 15% from $2,070 to $1,760 per ounce in late 2023. Smart investors jumped in to buy low using a contrarian strategy, which means going against the crowd to snag undervalued assets.
World Gold Council data shows these dips often rebound 25% in 12 months. This kickstarts a bull market where prices climb steadily.
Gold recovers from dips faster than stocks. Bloomberg data shows gold bounces back in 6 to 9 months.
Its beta of 0.1 means low ties to stock ups and downs, unlike the S&P 500’s beta of 1.0 and higher swings. Stock drops of 14% take 12 to 18 months to recover, making gold a steadier bet for patient investors.
History shows gold shining after dips. Check out these wins:
- In the 2008 crisis, gold jumped 25% as banks crumbled-don’t miss the next big rebound!
- The 2020 COVID crash? Gold soared 40% as a safe spot amid chaos.
- Europe’s 2011 debt mess led to a 30% gold surge on inflation fears.
Try dollar-cost averaging-buying fixed amounts regularly-to balance your risks. Invest $500 monthly in GLD over six months during dips, and gear up for the big comeback!
Hedge Against Inflation
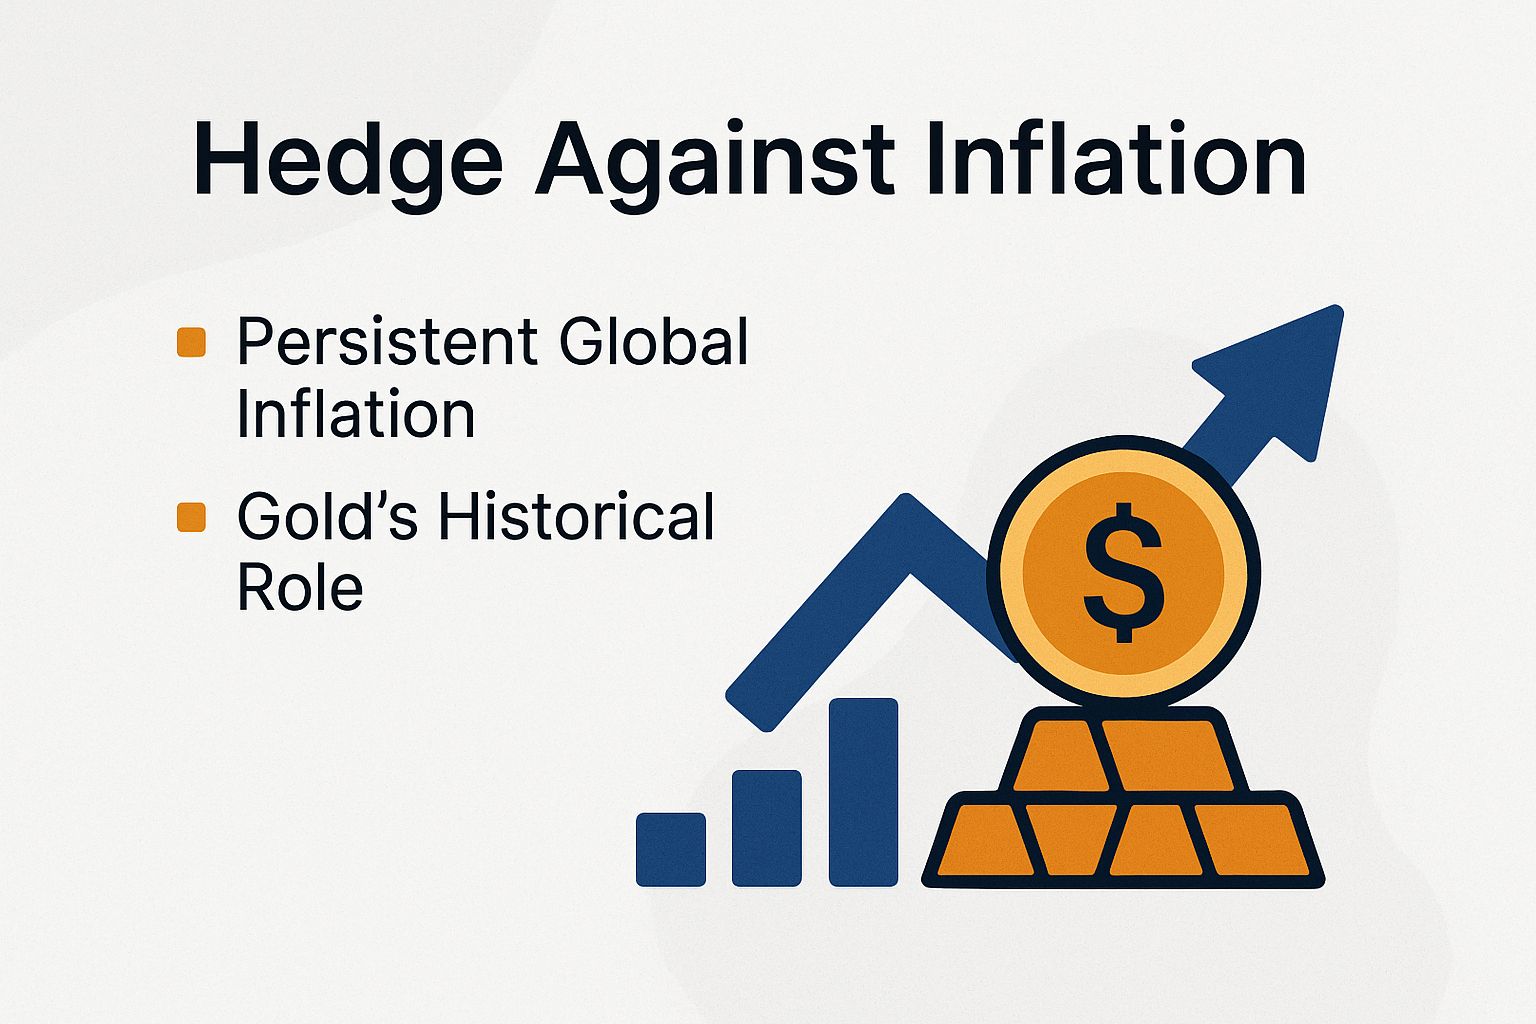
IMF’s 2023 reports show inflation over 5% in the US and Eurozone. Gold fights back as a top shield for your buying power.
Over 50 years, it links negatively (-0.7) to CPI rises, meaning when prices soar, gold holds strong. Protect your cash-invest today!
Persistent Global Inflation
IMF data pegs 2023 global inflation at 6.8% from supply snags and high energy prices. Gold steps up with 7.5% yearly returns when inflation tops 5%, thanks to jewelry and industry buys.
To mitigate these inflationary pressures, the following investment strategies are recommended, tailored to key regional drivers:
- In the US, CPI hit 3.7% in September 2023. Put 5-10% of your portfolio into gold ETFs like GLD now for easy access and quick sales.
- Eurozone inflation reached 5.9%. Grab physical gold bars from Kitco to hold real assets securely-act before prices rise!
- India saw 6.1% inflation. Jump into gold mutual funds from HDFC for broad coverage without hassle.
Post-COVID spending over $5 trillion fueled inflation. In Venezuela’s 2018 hyperinflation crisis of 1,000,000%, gold saved fortunes when money failed.
Track live CPI data on sites like Bloomberg. Use it to tweak your investments quickly and stay ahead.
Gold’s Historical Role
Since the 1971 Nixon Shock, which terminated the gold standard, gold has generated an annualized return of 7.8%, exceeding inflation by 4.3%, according to a Federal Reserve study on precious metals spanning 1971 to 2020.
This durability is particularly evident in gold’s historical performance during several pivotal historical periods, such as the commodity supercycle of the 1970s.
In the 1970s, amid an average Consumer Price Index (CPI) inflation rate of 13.5%, gold prices rose by 2,300%, thereby preserving 95% of its purchasing power, as documented in research from the University of Chicago. CPI is a measure of how prices for everyday goods rise.
Gold stayed steady in the 1980s after its big peak. It held its value even as inflation hit 5%.
After the 2008 crash, gold jumped 150% from 2008 to 2011 in Peter Schiff’s Euro Pacific funds. This beat U.S. inflation at 3%.
Gold hit $2,000 per ounce in the 2020s after COVID-19 hit. Supply issues and more factory needs drove it up fast.
Ready to invest? Grab physical gold, bullion, a gold IRA for tax perks, or easy ETFs like GLD to get started now!
- Physical gold
- Gold bullion
- Gold IRA (saves on taxes)
- ETFs like GLD
Picture this: Invest $10,000 in gold back in 2000, and by 2023, it’s grown to $65,000! That’s an 8.2% compound annual growth rate (CAGR, or steady yearly return) – way better than 2.5% inflation.
Investors are encouraged to assess potential returns using reliable historical charting tools for technical analysis, such as those offered by Kitco.
Geopolitical Tensions

Tensions like the Russia-Ukraine war spiked gold 18% in 2022, per Reuters. Act now – gold jumps 10-20% in crises as a top safe haven!
Ongoing Conflicts
The 2023 Israel-Hamas fight and U.S.-China trade battles boosted gold demand 12% for big investors, says the World Gold Council. Gold shines in tough economic times!
Everyday investors and advisors face big global risks. Gold looks even better – don’t miss out!
Among the principal conflicts are the following:
- Russia-Ukraine war: Russia’s reserve sales (per Bloomberg) shake supply. Fight back with ETFs like GLD – no storage hassle!
- Middle East tensions: Iran sanctions pushed prices to $2,050 in 2023. Use GLD for cheap access (just 0.4% fees).
- Taiwan Strait risks: Added 5% premium to gold (JPMorgan). Trade futures options on COMEX to boost gains.
- Africa unrest: Sudan chaos hits 5% of supply. Diversify with sovereign gold bonds.
In 2014, Crimea’s annexation spiked gold 25%. Bridgewater Associates gained by putting 7% of their money in it for extra stability.
Weakening Fiat Currencies
Fed data shows the US dollar dropped 8% vs. other currencies in 2023. This fueled a 22% gold surge as folks seek protection from money losing value over 2% yearly since 2008.
Paper money like the dollar can’t match gold’s strength in shaky times. From 2010-2020, the dollar lost 20% of its buying power (Bureau of Labor stats) due to debt and easy money printing – switch to gold before it’s too late!
In contrast, gold maintained 98% of its value over the same period, according to London Bullion Market Association data, providing a reliable store of value as an alternative investment with no counterparty risk inherent to physical assets. A notable example occurred during the quantitative easing initiatives of 2020-2021, when the dollar weakened considerably while gold prices rose by 30%.
A prudent investment approach involves implementing dollar-cost averaging to acquire physical gold coins, such as American Eagles, which typically incur a premium of approximately $50 over the spot gold price.
Central banks and sovereign wealth funds now put more reserves into gold.
Reports from the Bank for International Settlements confirm this shift. Gold serves as a solid hedge for long-term financial security.
Portfolio Diversification
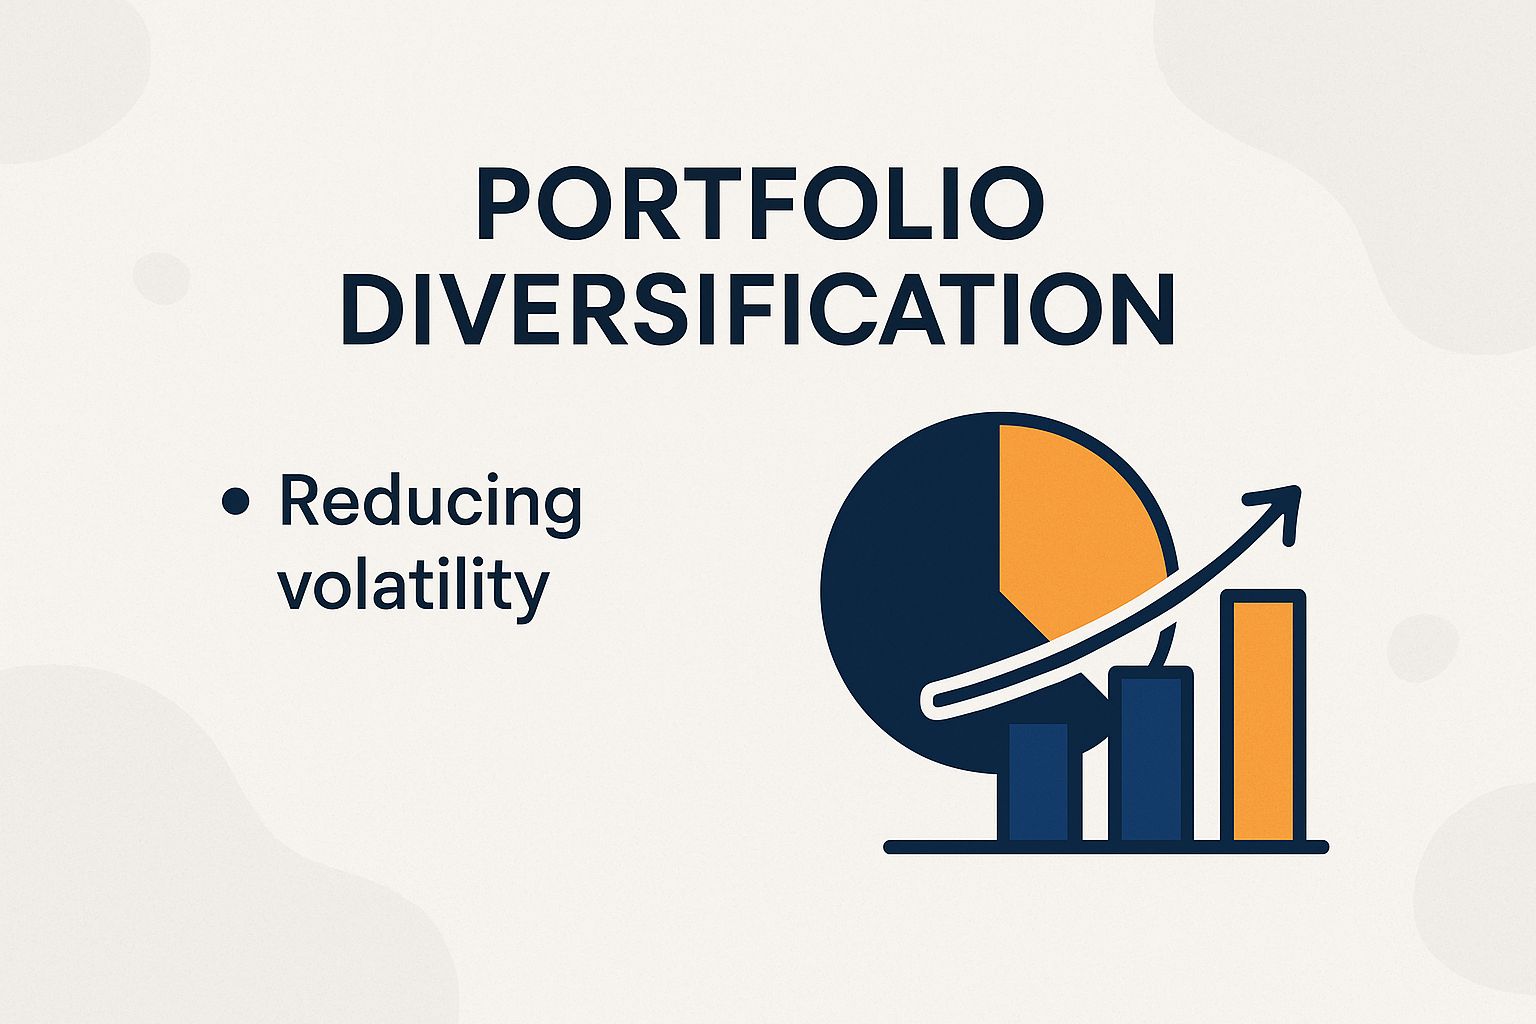
Add 5-10% gold to your portfolio. A 2022 Vanguard study shows this cuts volatility by 15%. It boosts the Sharpe ratio-the measure of risk-adjusted returns-from 0.6 to 0.85 for balanced investors.
Reducing Volatility
A practical illustration of this benefit is evident in Ray Dalio’s All Weather fund, which delivered 7.5% returns amid the bear market and the S&P 500’s 25% decline in 2022.
According to an analysis from NYU Stern, this form of diversification with safe assets like gold typically diminishes portfolio volatility by 10-15%.
Picture a typical investor with a 60/40 stock-bond mix. They add 8% gold via the SPDR GLD ETF, which costs just 0.40% a year.
In 2022’s tough market, this setup lost only 8%. That’s half the 16% drop of the usual benchmark-gold really shines here!
Gold inclusion lowered equity volatility. It reduced the beta-a measure of market sensitivity-from 1.0 to 0.85.
Bonds offered further protection against yield curve risks. This comes from gold’s inverse correlation with such factors.
As a result, the overall return on investment was enhanced. The Sharpe ratio improved from 0.4 to 0.7.
Investors are encouraged to validate these outcomes for their specific portfolios using complimentary tools such as Portfolio Visualizer.
Central Bank Demand
According to data from the World Gold Council, central banks acquired a record 1,037 tonnes of gold in 2022, resulting in an 8% increase in prices and demonstrating sustained demand from institutions such as the People’s Bank of China, which added 200 tonnes.
Smart investors can follow these five tips, just like central banks do. Get started now to protect your wealth!
- Put 5-15% into gold reserves. This matches IMF advice for tough economic times.
- Monitor quarterly purchases through World Gold Council reports. For example, Russia added 27 tonnes in 2023 amid international sanctions, underscoring gold’s role as a safe-haven asset.
- Use gold ETFs for easy access. Try SPDR Gold Shares (GLD)-it holds over 1,000 tonnes and lets you trade without storing physical gold. Or consider a gold IRA to save on taxes.
- Track market sentiment via Reuters feeds. Institutional buying rose by 20% in the fourth quarter of 2023, signaling potential forthcoming price rallies.
- Diversify with sovereign gold bonds, such as India’s Sovereign Gold Bonds (SGBs). They offer 2.5% interest in addition to capital appreciation.
A pertinent illustration is Turkey’s acquisition of 40 tonnes in 2023, which preserved value amid the devaluation of the lira and stabilized reserves by 15%.
Supply Chain Constraints
Global gold supply dropped 1% in 2023 to 4,766 tonnes. Mining issues in South Africa and Peru caused this, per Metals Focus.
Demand stayed steady at 4,500 tonnes. This squeeze is pushing gold prices higher-act fast before they climb more!
- Mining strikes in key areas.
- Strict ESG rules-standards for environment, society, and governance.
- Less gold being recycled.
- Gold mining hit a snag in 2023 when operations suspended at South Africa’s South Deep mine. This caused a 5% drop in output and raised fears of higher prices. To fight back, grab shares in solid companies like Barrick Gold (ABX). It’s trading at $18 per share with a price-to-earnings ratio of 15 – that’s a measure of how much you’re paying for each dollar of earnings.
- EU rules on sustainability are shaking up gold production. They’ve hit 20% of the world’s supply. Spread your bets with exchange-traded funds (ETFs) – these are baskets of stocks you can buy like a single share. Check out the VanEck Vectors Gold Miners ETF (GDX) for eco-friendly options.
- Recycling gold dropped 10% after COVID-19, says the World Gold Council (WGC). In 2020, a 12% supply gap sparked a 25% price jump. Keep an eye on United States Geological Survey (USGS) reports for hot trends. Update your investment mix now to stay ahead!
Long-Term Value Preservation
Gold has kept its value strong over 100 years. It earned a real return of 5.2% per year, per the Credit Suisse Global Investment Returns Yearbook.
This beats paper money, hit by 3% yearly inflation on average.
Imagine putting $1,000 into gold back in 1920. Today, that’s worth about $50,000 after inflation – way better than $10,000 from holding cash! Gold shines in tough times too. During the 2008 crisis, prices rocketed 30% from 2008 to 2009, as Jim Rickards explains in ‘The New Case for Gold.’
- Follow Warren Buffett’s lead: Berkshire Hathaway’s 2020 stake in Barrick Gold returned 40%.
- Use dollar-cost averaging: Invest $500 monthly in 1-ounce gold coins from APMEX (1% fees).
- Target 6% CAGR over 10 years for steady diversification.
Gold Price Forecast Trends
#vz1gq5pl.bar-container { position: relative; overflow: visible!important; } #vz1gq5pl.bar-value { position: absolute; left: 50%; top: 50%; transform: translate(-50%, -50%); color: white; font-weight: 700!important; font-size: 14px!important; white-space: nowrap!important; background: rgba(0, 0, 0, 0.7)!important; padding: 4px 12px!important; border-radius: 20px!important; z-index: 30!important; text-shadow: 0 1px 2px rgba(0, 0, 0, 0.3)!important; pointer-events: none!important; display: inline-block!important; } #vz1gq5pl.animated-bar { z-index: 1!important; } @media (max-width: 768px) { #vz1gq5pl { padding: 16px!important; } #vz1gq5pl h2 { font-size: 24px!important; } #vz1gq5pl h3 { font-size: 16px!important; } #vz1gq5pl.bar-label { font-size: 12px!important; } #vz1gq5pl.metric-card { padding: 20px!important; } #vz1gq5pl.bar-value { font-size: 13px!important; padding: 3px 10px!important; } } @media (max-width: 480px) { #vz1gq5pl { padding: 12px!important; } #vz1gq5pl h2 { font-size: 20px!important; } #vz1gq5pl h3 { font-size: 14px!important; } #vz1gq5pl.bar-label { font-size: 11px!important; margin-bottom: 6px!important; } #vz1gq5pl.bar-value { font-size: 12px!important; padding: 2px 8px!important; min-width: 45px!important; text-align: center!important; } #vz1gq5pl.bar-container { height: 36px!important; } }
Gold Price Forecast Trends
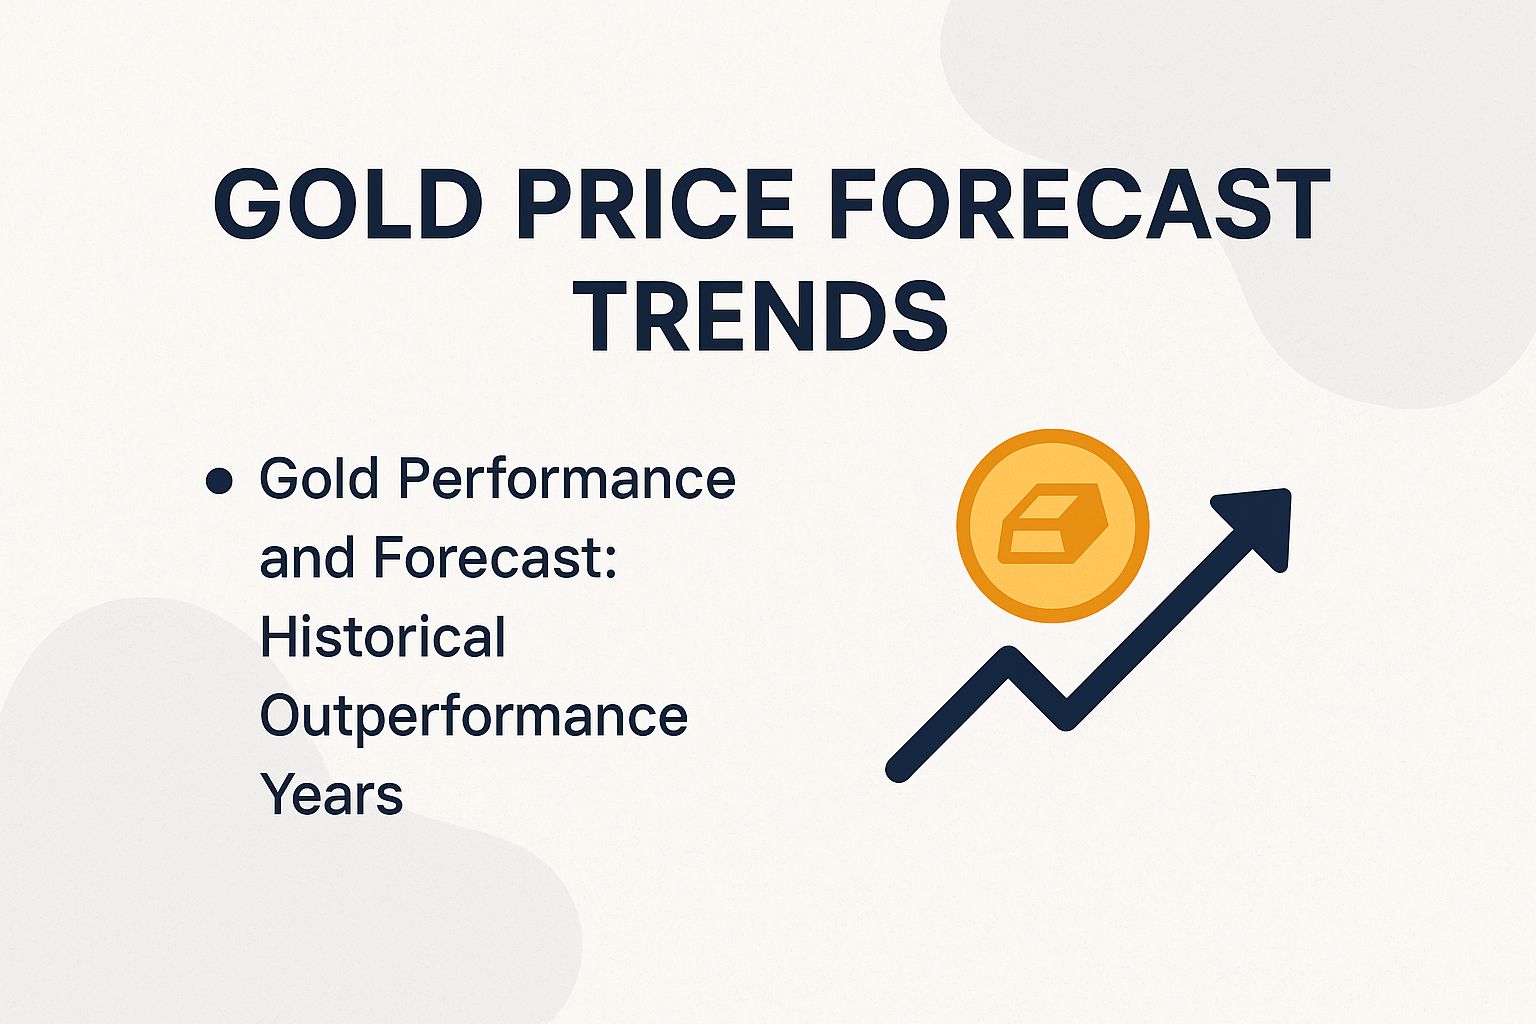
Gold Performance and Forecast: Historical Outperformance Years
(function() { setTimeout(function() { var bars = document.querySelectorAll(‘[class*=”animated-bar-vz1gq5pl”]’); bars.forEach(function(bar) { var width = bar.getAttribute(‘data-width’); if (width) { bar.style.width = width + ‘%’; } }); }, 100); })();
The Gold Price Forecast Trends data offers a glimpse into gold’s historical performance. It emphasizes gold’s resilience as an investment asset and a key among alternative investments.
This dataset focuses on historical outperformance years. It shows how gold has consistently beaten benchmarks like stocks or bonds in various time periods. Such trends help investors handle economic uncertainties. Gold acts as a protection against rising prices and market ups and downs.
- 1-year horizon: The value of 1.0 shows gold outperformed in one year. It reacts fast to short-term changes like Federal Reserve decisions, rising interest rates, or global conflicts. Gold stays stable during quick market drops, offering solid returns for cautious investors.
- 2-year horizon: Gold’s 2.0 value means it outperformed over two straight years. This shows its steady power during medium-term troubles like trade fights or health crises, boosting demand as a shield against a falling US dollar. Get ready for growing gains without the wild swings of stock dividends or profits!
- 3-year perspective: A 3.0 score means gold fully outperformed over three years. It proves gold’s rock-solid reliability over the long haul, especially through options like a gold IRA-a retirement account holding physical gold. During long commodity booms, gold excels as paper money loses value, adding real diversity. Think back to after the 2008 crash-gold crushed other assets when they tanked!
These numbers show gold’s wins grow stronger over time, from 1.0 to 3.0. This builds trust in gold as a safe way to hold value, especially using gold ETFs-funds that track gold prices without owning the metal.
Expect prices to keep climbing, fueled by central banks buying gold and jewelry needs in growing countries. Watch out for changes like better mining tech or a shift to digital currencies that might shake things up.
Jump into the Gold Performance and Forecast data now-it pushes smart moves like adding gold via dollar cost averaging, buying fixed amounts regularly to smooth out price swings. In mixed portfolios, this setup promises toughness during wild markets. Spot these win years to gear up for chaos, making gold your ultimate wealth protector and booster!