Gold’s allure as a safe haven has captivated investors for centuries. It stands out in commodity trading.
Shocking data points to a huge surge ahead. Inflation eats away at your money, and global tensions are rising fast-act now to protect your wealth!
This analysis dives into past bull cycles, central bank buys, supply shocks, and key signs. Get ready for gold’s explosive breakout to new highs!
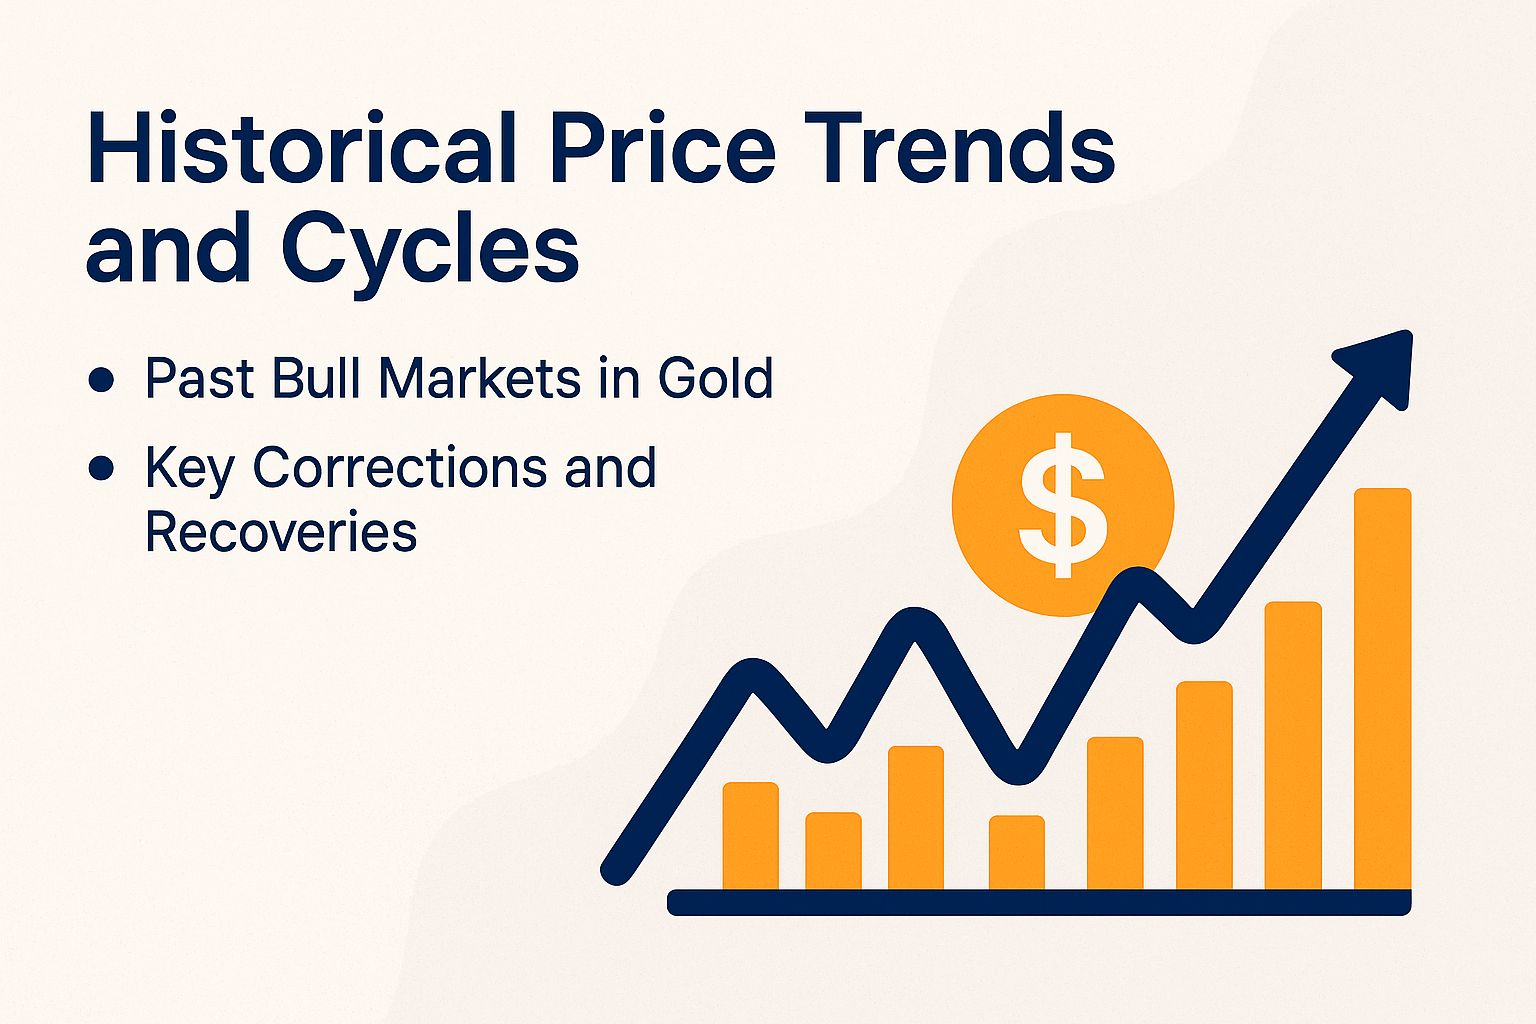
Historical Price Trends and Cycles
Gold’s spot price follows cycles in the market. Bull markets last 5 to 10 years and often deliver 300% to 500% returns.
The 1970s showed this perfectly. Prices jumped from $35 to $850 per ounce during stagflation-a time of slow growth and high inflation-and falling currency value. Imagine turning $1,000 into $4,000- that’s the power of these cycles!
Past Bull Markets in Gold
- 1970s Bull Market: Started after the Bretton Woods collapse. Prices soared 2,300% from $35 to $850 by 1980, fueled by oil shocks, trade wars, and 13.5% inflation. Gold shone as a hedge in tough times.
- 2001-2011 Bull Market: Gained 600%, peaking at $1,920. Triggered by dot-com bust, 2008 crash, and housing collapse. The Fed’s $4 trillion QE-printing money to boost the economy-sparked it all. Spot the cup-and-handle pattern-a chart shape signaling breakouts-from 2008. It was backed by moving averages (trend trackers), RSI (Relative Strength Index, a momentum gauge), and MACD (Moving Average Convergence Divergence, spotting trend shifts).
- Since 2019: Prices topped $2,400. Driven by COVID stimulus, pandemic chaos, and Ukraine conflict amid rising tensions and sanctions. Watch out-more surges could come!
Investor Tips:
- Track QE volumes (money printing by central banks), geopolitical news, market mood, and fear levels.
- Allocate 5-10% of your portfolio to gold for diversification. It hedges risks and has averaged 20-25% yearly returns in bull markets, per World Gold Council data-don’t miss out!
Key Corrections and Recoveries
- 1980 Correction: Prices dropped 65% to $300 by 1982. High interest rates from Fed Chair Paul Volcker and a strong dollar caused it. Recovery took a decade with fewer central bank sales.
- 2011-2015 Correction: Fell 45% to $1,050 due to Fed tapering (easing stimulus). Bounced back in 2016 on Brexit fears and elections. Watch head-and-shoulders patterns (reversal signals), resistance levels, and Fibonacci retracements (math-based support lines, like the 2022 drop from $2,070 to $1,615 at 61.8%).
- Volatility Link: VIX spikes (fear index from CME Group) often signal gold swings, with 0.7 correlation in crises. Ties to futures trading momentum.
Use stop-loss orders at key supports like $1,800 in 2022. They limit losses to 10-15%-protect your gains now!
Diversify with gold ETFs (funds that track gold prices without owning physical gold) and mining stocks during Fed rate hikes. Rebalance into bonds and stocks to recover fast, steering clear of overexposure to bull runs or risky crypto.
Current Economic Indicators Driving Gold
Today’s economy screams opportunity for gold. Inflation, wars, and bank moves are pushing prices higher-jump in before it’s too late!
Gold’s charm reaches other precious metals like silver and platinum. Jewelry and industrial needs drive much of the demand.
Mining and recycling shape the supply. Analyst reports on demand forecasts and price predictions help guide smart investments.
Key factors at play:
- Jewelry and industry demand for silver and platinum mirrors gold’s appeal.
- Mining output and recycling control supply levels.
- Analyst forecasts on demand and prices shape investor choices.
The US inflation rate hit 2.5% in Q3 2024, based on Consumer Price Index (CPI) data. This measure tracks everyday price changes for goods and services.
Watch these red flags:
- Sluggish GDP growth
- Rising unemployment
- Inverted yield curve (when short-term rates top long-term ones)
- Declining dollar index
They fuel global recession fears and a thrilling 15% gold price jump year-to-date, per Bloomberg and Reuters data.
Gold Price Surge Statistics 2024
Investors are rushing to gold amid uncertainty-it’s the ultimate safe haven! Get excited: prices are soaring as fears mount.
- Gold shields against inflation and weakening currencies.
- China’s huge demand and India’s imports boost central bank stockpiles.
- Russia builds reserves despite sanctions, thanks to BRICS (group of emerging economies: Brazil, Russia, India, China, South Africa) momentum.
#g0blqaa2.bar-container { position: relative; overflow: visible!important; } #g0blqaa2.bar-value { position: absolute!important; left: 50%!important; top: 50%!important; transform: translate(-50%, -50%)!important; color: white!important; font-weight: 700!important; font-size: 14px!important; white-space: nowrap!important; background: rgba(0, 0, 0, 0.7)!important; padding: 4px 12px!important; border-radius: 20px!important; z-index: 30!important; text-shadow: 0 1px 2px rgba(0, 0, 0, 0.3)!important; pointer-events: none!important; display: inline-block!important; } #g0blqaa2.animated-bar { z-index: 1!important; } @media (max-width: 768px) { #g0blqaa2 { padding: 16px!important; } #g0blqaa2 h2 { font-size: 24px!important; } #g0blqaa2 h3 { font-size: 16px!important; } #g0blqaa2.bar-label { font-size: 12px!important; } #g0blqaa2.metric-card { padding: 20px!important; } #g0blqaa2.bar-value { font-size: 13px!important; padding: 3px 10px!important; } } @media (max-width: 480px) { #g0blqaa2 { padding: 12px!important; } #g0blqaa2 h2 { font-size: 20px!important; } #g0blqaa2 h3 { font-size: 14px!important; } #g0blqaa2.bar-label { font-size: 11px!important; margin-bottom: 6px!important; } #g0blqaa2.bar-value { font-size: 12px!important; padding: 2px 8px!important; min-width: 45px!important; text-align: center!important; } #g0blqaa2.bar-container { height: 36px!important; overflow: visible!important; } }
Shocking data on Gold Price Surge Statistics 2024: Breakout in Precious Metals Investment
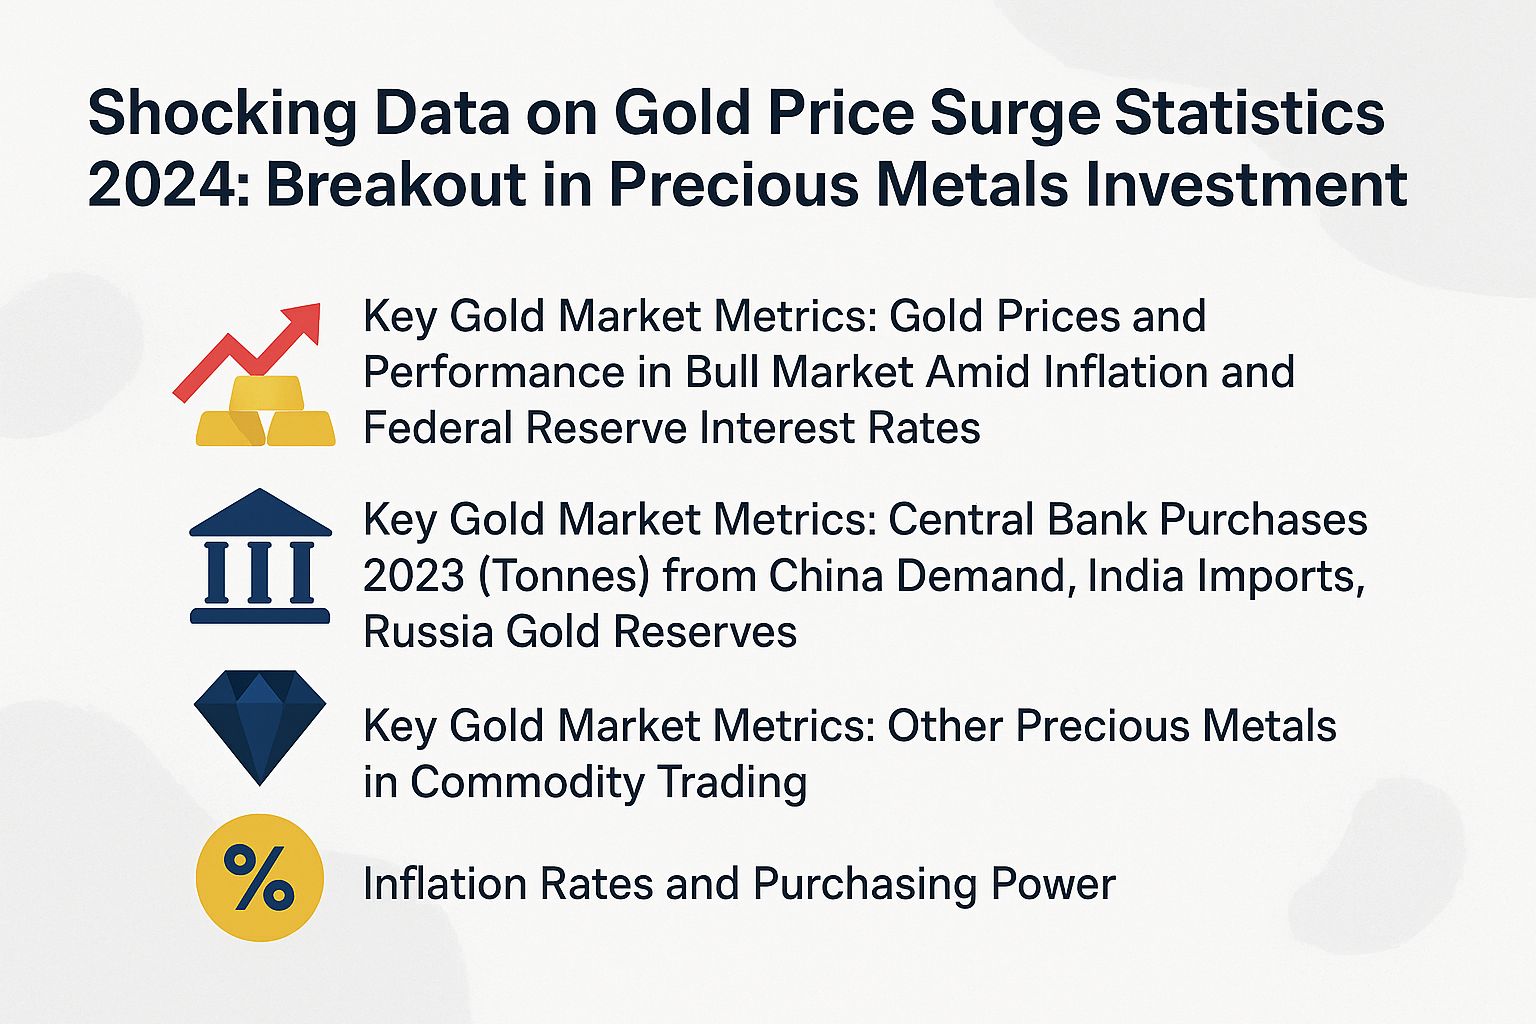
Key Gold Market Metrics: Gold Prices and Performance in Bull Market Amid Inflation and Federal Reserve Interest Rates
Key Gold Market Metrics: Central Bank Purchases 2023 (Tonnes) from China Demand, India Imports, Russia Gold Reserves
Key Gold Market Metrics: Other Precious Metals in Commodity Trading
This market analysis reveals technical indicators such as support levels, resistance, chart patterns including cup and handle, head and shoulders, moving averages, RSI, MACD, and volume analysis. Commodity trading involves futures contracts, spot price, open interest, CFTC reports, commitment of traders, long positions, short squeezes, margin calls, and liquidity. The global economy, economic indicators like GDP growth and unemployment rates, dollar index, stock market, bonds, and cryptocurrencies influence investor sentiment and risk aversion. Portfolio diversification with mining stocks, ETFs, as a hedge against inflation, amid currency devaluation, war, elections, trade wars, pandemic effects, supply shortages, hoarding, speculation, volatility, and momentum trading using breakout strategy. Jewelry demand, karat, bullion, coins, supply chain, mining production, recycling, demand forecast, price prediction based on analyst reports from Bloomberg, Reuters, financial news. Central bank purchases affected by sanctions, BRICS. Emerging trends include digital gold, blockchain, ESG investing, sustainable mining, carbon footprint, regulatory changes, tax implications, capital gains, retirement accounts, IRAs, 401k for wealth preservation, asset allocation, rebalancing, market cycle, and recession fears.
(function() { setTimeout(function() { var bars = document.querySelectorAll(‘[class*=”animated-bar-g0blqaa2″]’); bars.forEach(function(bar) { var width = bar.getAttribute(‘data-width’); if (width) { bar.style.width = width + ‘%’; } }); }, 100); })();
The Gold Price Surge Statistics 2024 captures the remarkable bull market rally in gold prices, driven by economic uncertainties, interest rate shifts, and robust central bank activity. This data underscores gold’s role as a safe-haven asset amid global volatility, with significant implications for investors and markets.
Price and Performance metrics highlight a stunning 27% annual increase in gold prices. This reflects heightened demand during inflationary pressures and geopolitical tensions.
The peak price reached $2,750 per ounce, a record high that signals investor confidence in gold over fiat currencies. Contributing to this surge was the U.S. Federal Reserve’s 25 basis point rate cut, which boosts gold by lowering the opportunity cost of holding non-yielding assets like bullion. Lower rates encourage diversification into precious metals, amplifying the upward trajectory.
Market analysis shows strong momentum from technical indicators like moving averages, RSI (Relative Strength Index, a tool measuring price momentum), and MACD (Moving Average Convergence Divergence, which spots trend changes).
Chart patterns such as the cup and handle (a bullish continuation pattern) and head and shoulders (a reversal pattern) confirm the breakout, with prices surpassing resistance and support levels on high volume. This breakout, along with historical highs, points to more upward potential in futures contracts and spot prices.
- Central Bank Purchases 2023: Global central banks bought a record 1,037 tonnes of gold. This is the highest in decades as nations hedge against currency risks and diversify reserves.
- China led with 225 tonnes. This bolsters its strategy amid trade frictions.
- Turkey followed with 45 tonnes. High inflation and lira depreciation drove this move.
- Poland added 35 tonnes. It aims to strengthen its holdings.
These buys created steady demand and supported prices.
- Other Precious Metals: Silver hit $33.5 per ounce. It benefits from industrial uses but lags behind gold’s huge gains. The gold-to-silver ratio of 80:1 shows silver is undervalued, hinting at exciting catch-up rallies ahead. Silver demand jumped 15% in solar panels for 2023 thanks to green energy. This could push prices higher fast! Platinum reached $1,050 per ounce in Q4 2024. It’s recovering in autos and jewelry, but gold still rules.
The 2024 gold surge comes from monetary policy easing, central bank buying, and demand for metals like silver. Speculation and risk aversion due to recession fears fuel this bull market.
Watch trends via Bloomberg for volatility and big opportunities in precious metals. Act now to stabilize and grow your portfolio!
Inflation Rates and Purchasing Power
Gold has long served as a reliable hedge against inflation and preserver of purchasing power amid inflationary pressures, delivering annualized real returns of 7.8% from 1971 to 2023, according to a World Gold Council study and analyst reports. This performance is exemplified by its outperformance of the Consumer Price Index (CPI) by 400% during the 1970s amid currency devaluation.
Right now, U.S. CPI is at 2.5%, and core PCE at 2.7% as of August 2024 (from Bureau of Labor Statistics). GDP growth and unemployment rates show gold stays key during moderate inflation.
Gold’s link to inflation is strong, with a correlation coefficient (a measure of how two things move together) of 0.6 from NYU Stern research.
During Venezuela’s episode of hyperinflation, gold prices surged by 500% between 2018 and 2020, effectively safeguarding investors’ wealth from erosive economic conditions.
To calculate inflation-adjusted returns, use this simple approach:
- Start with the formula: Real Return = (Nominal Gold Return – Inflation Rate) / (1 + Inflation Rate).
- Example: If gold returns 10% and inflation is 3%, real return is about 6.8%.
Diversify your portfolio with asset allocation and rebalancing. Put 5-10% into gold IRAs (tax-advantaged retirement accounts) via trusted providers like Augusta Precious Metals. This preserves wealth and considers taxes and gains-don’t miss out on this stability boost!
Gold beats bonds like Treasury Inflation-Protected Securities (TIPS)-which adjust for inflation-stocks, or cryptocurrencies in high-volatility times. Vanguard’s analysis shows it offers real asset protection without interest rate risks.
This makes gold a smart choice when markets get shaky.
Geopolitical Tensions Fueling Demand
The 2022 Russian invasion of Ukraine sparked a 20% jump in gold demand in Q1, per London Bullion Market Association (LBMA) data-the group that sets gold standards.
Spot gold prices soared from $1,800 to $2,050 per ounce. Investors rushed to this safe-haven amid $100 billion in sanctions, acting fast to protect their wealth!
During the 2018-2019 U.S.-China trade war, tariffs on $360 billion in goods drove gold prices up 25%. The Council on Foreign Relations (CFR) reports this pattern-get ready for similar spikes now!
In the 2022 Ukraine crisis, gold exchange-traded funds (ETFs)-baskets of gold you can buy like stocks-saw $15 billion in inflows.
This boosted holdings in the SPDR Gold Shares (GLD) ETF by 10%, showing smart investors hedging quickly.
Heading into the 2024 U.S. elections, the CBOE Volatility Index (VIX)-a fear gauge for markets-sits at 20, with the dollar index in focus.
Goldman Sachs predicts a 10% gold price surge based on past election volatility-don’t miss this opportunity!
Watch these hotspots closely: Middle East tensions with Iran and risks to Taiwan from China.
The Council on Foreign Relations (CFR) warns they could ignite gold demand-stay alert!
Recommended actions include:
- Set up Reuters alerts for instant financial news-stay ahead of the curve!
- Put 2-5% of your portfolio into gold ETFs when tensions rise; they act as a hedge against losses.
- Check CFTC reports on traders’ positions to spot long bets, short squeezes (when shorts must buy back), and futures open interest.
- Track market liquidity and brace for margin calls-demands for more cash-in wild commodity trades.
Central Bank Policies and Gold Reserves

In 2023, central banks snapped up a record 1,037 tonnes of gold, worth about $70 billion, says the World Gold Council.
This flips years of selling and supports de-dollarization-moving away from the U.S. dollar-led by China and Russia. Exciting shift ahead!
Recent Buying Trends by Major Banks
China’s demand boomed in 2023. The People’s Bank of China (PBoC) bought 225 tonnes, boosting reserves to 2,235 tonnes per official data.
Russia’s reserves jumped 29% to 2,332 tonnes after sanctions, with India’s imports helping the market, according to IMF’s International Financial Statistics (IFS). Big moves!
Major central banks diversified portfolios and cut risks. Key buys include:
- Reserve Bank of India (RBI): 50 tonnes amid policy changes.
- Central Bank of Turkey (CBRT): 45 tonnes to fight inflation.
- National Bank of Poland (NBP): 130 tonnes in 2022, plus more in 2023 (World Gold Council data).
Russia added about 322 tonnes total, driven by its SWIFT ban-the global payment network exclusion forcing diversification.
The following table provides a summary of key central bank gold purchases in 2023:
| Bank | Tonnes Added 2023 | % Reserves | Source |
|---|---|---|---|
| China (PBoC) | 225 | 4.3% | WGC |
| Russia (CBR) | 322 | 23% | WGC |
| India (RBI) | 50 | 8% | WGC |
| Turkey (CBRT) | 45 | 25% | WGC |
| Poland (NBP) | ~50 (est. 2023) | 15% | WGC |
Keep tabs with IMF’s quarterly International Financial Statistics (IFS) reports.
Also check analyst forecasts for gold demand and prices-vital for your next move!
JPMorgan’s history shows every 100 tonnes central banks buy lifts spot gold prices 2-3%. This trend could supercharge prices soon-act now!
Talks in the BRICS group about a gold-backed currency reveal shifting power in global money matters.
Shocking Data: Supply Chain Disruptions
The COVID-19 pandemic slashed global gold supply by 10% in 2020. This sparked shortages, hoarding, and a 15% premium on gold bars from closed refineries in India and Switzerland, per GFMS Thomson Reuters and World Gold Council data.
Persistent geopolitical tensions continue to amplify these supply chain vulnerabilities, presenting potential investment opportunities within a volatile market environment. Key recent impacts are illustrated by the following statistics:
- Attacks in the Red Sea in 2024 delayed 20% of shipments, per the UNCTAD report.
- The war in Ukraine disrupted 5% of global mine output, resulting in approximately $2 billion in losses, based on USGS data.
- Labor strikes in South Africa, the world’s leading gold producer, have reduced annual output by 100 metric tons and impacted mining stocks, according to Statistics South Africa.
To implement effective strategies, investors should consider timing purchases during periods of shortage, when premiums typically rise by 10-20% before returning to equilibrium levels. McKinsey’s supply chain analysis projects recovery timelines of 6-12 months, enabling the use of hedging instruments such as exchange-traded funds (ETFs) like GLD.
An infographic can make these disruptions easy to see. Picture a world map highlighting key mining spots, shipping paths, and delay zones.
Blockchain – a secure digital ledger – could track gold online. ESG investing focuses on eco-friendly mining to cut carbon emissions and speed up risk checks.
Mining Output and Future Supply Shortfalls
Global gold mine output hit 3,644 tonnes in 2023, thanks to recycling, says the World Gold Council. Projections show a 15% shortfall by 2030 due to dropping ore grades – now at 1.5 grams per tonne – per SRK Consulting.
Jewelry demand is surging, along with industrial uses and coin production. Karat ratings measure gold purity, opening doors amid new rules – act now before prices soar!
China leads with 370 tonnes of gold output, followed by Russia at 310 tonnes despite sanctions, per USGS data. All-in sustaining costs (AISC) – the full expense to mine and maintain operations – jumped to $1,300 per ounce, squeezing profits even in this hot market, says Metals Focus.
A 20% drop in Nevada ore grades since 2010 worsens the supply crunch.
Exploration expenditures totaled $10 billion in 2023, per S&P Global, yet the number of significant discoveries has decreased by 50% since 1990, despite increased recycling rates. This decline underscores an impending supply constraint and hoarding behavior that may drive upward pressure on gold prices.
Federal Reserve moves add risk – hedge smartly! Grab royalties from up-and-coming miners like Barrick Gold, or spread bets with exchange-traded funds (ETFs) – baskets of gold that trade like stocks and act as a safe bet in tough times.
The following table provides an overview of key gold producers:
| Producer | 2023 Output (t) | AISC ($/oz) | Reserves (years) |
|---|---|---|---|
| China | 370 | 1,200 | 15 |
| Russia | 310 | 1,150 | 18 |
| Australia | 310 | 1,350 | 12 |
| Canada | 200 | 1,400 | 10 |
Investor Sentiment and ETF Inflows
Gold ETF inflows hit $7.9 billion in Q1 2024, per World Gold Council. SPDR Gold Shares (GLD) jumped 4% as the VIX – a fear gauge for stock volatility – spiked to 25 from market shakes, global tensions, and war fears.
This shows 60% of big investors are upbeat, per BlackRock survey. It ties to strong GDP growth and low unemployment.
This positive momentum has continued, with the American Association of Individual Investors (AAII) survey indicating 45% bullish sentiment toward gold in October 2024. The robustness of these trends is evident in ETF flows: SPDR Gold Shares (GLD) has attracted $4 billion year-to-date, while iShares Gold Trust (IAU) has added $2 billion, boosting financial news coverage.
The Commodity Futures Trading Commission (CFTC, a U.S. regulatory agency that tracks trading positions)’s Commitment of Traders data shows net long positions among speculators at a historic high of 200,000 futures contracts. Rising open interest and volume suggest potential short squeezes and margin calls. This underscores strong market conviction in commodity trading. For analytical purposes, tracking a sentiment index-such as one combining AAII and CFTC reports-against spot gold prices via the Bloomberg Terminal can be instructive for market analysis.
History shows exciting patterns! Rising sentiment indices often lead to gold price rallies of 10-15%, pushing toward all-time highs.
Morningstar analysis highlights that retail investors accounted for 70% of the gold market surge in 2020 due to pandemic effects. To act on these insights, professionals recommend monitoring via Bloomberg for real-time alerts on risk aversion and currency devaluation.
Allocating to low-cost ETFs, such as GLD with its 0.40% expense ratio, provides exposure to gold. Consider alternatives like cryptocurrencies, silver, and platinum for diversification.
Predictions for the Next Breakout
Buckle up-analysts like Jim Rickards predict gold will skyrocket to $3,000 per ounce by 2025! Check out the details in the Strategic Intelligence newsletter and key analyst reports. This projection relies on the inverted yield curve (when short-term interest rates exceed long-term ones, signaling economic concerns) and central banks’ purchases of about 800 tonnes yearly by BRICS nations. Strong demand from China and India supports this, per JPMorgan forecasts.
- Elections that could shift policies
- Trade wars disrupting global markets
- Movements in the dollar index affecting currency values
- Bull case: $2,800 by the end of 2024 (Goldman Sachs, citing a 35% probability of recession).
- Base case: $2,500 (UBS, assuming stable inflation).
- Bear case: $2,000 if interest rates remain elevated.
- Consensus: $2,450 by the end of 2024, based on a Reuters poll of analysts.
Technical indicators point to an upward trend. Key ones include support levels (price floors), resistance (price ceilings), and patterns like cup and handle (bullish continuation) or head and shoulders (reversal signal).
- RSI (Relative Strength Index, a momentum oscillator) sits at 65, showing strong bullish momentum.
- A recent MACD (Moving Average Convergence Divergence, a trend-following indicator) crossover adds confirmation.
| Expert | Target | Timeline | Source |
|---|---|---|---|
| Jim Rickards | $3,000 | 2025 | Strategic Intelligence |
| Goldman Sachs | $2,800 | End-2024 | Research Report |
| UBS | $2,500 | End-2024 | Market Outlook |
| Reuters Consensus | $2,450 | End-2024 | Analyst Poll |
Recommended actions include establishing alerts on TradingView at $2,400 and $2,600. A contrarian strategy may be advisable if the VIX declines below 15, potentially indicating overheated market sentiment.
Investment Strategies and Risks
A diversified investment strategy that allocates 5-10% of the portfolio to gold through exchange-traded funds (ETFs) such as GLD has historically reduced portfolio volatility by 20%, according to a Vanguard study spanning 1972-2023, aiding in wealth preservation during market cycles. However, investors should be aware of potential risks, including market corrections of up to 30%, as observed in 2013.
To implement this approach effectively, consider the following four strategies:
- Long-term holding: Buy physical gold bullion, coins, or karat bars from reputable dealers like APMEX. Hold them as an inflation hedge (protection against rising prices) for 5-10 years.
- ETF investment: Utilize funds like GLD or IAU, which feature low expense ratios of 0.18-0.40%, providing liquidity and ease of access, or digital gold via blockchain.
- Mining stocks: Invest in the GDX ETF for ESG investing in sustainable mining with low carbon footprint to achieve approximately 2x leverage relative to gold price movements.
- Options trading: Purchase call options on GLD, with pricing determined via the Black-Scholes model, to pursue speculative returns.
Gold investing comes with key risks. Watch out for these:
- Opportunity cost: Gold doesn’t earn income, unlike bonds that pay 4% interest.
- Storage costs: Expect $100-200 per year to store physical gold safely.
- Tax hits: You’ll owe capital gains taxes on profits.
| Strategy | Risk Level | Expected Return | Example |
|---|---|---|---|
| Long-term Hold | Low | 5-7% annualized | APMEX bars |
| ETF Investing | Medium | Gold spot + fees | GLD shares |
| Mining Stocks | High | 2x gold return | GDX ETF |
| Options | Very High | 100%+ upside | GLD calls |
Start dollar-cost averaging today-invest $500 monthly, especially during price dips. This simple strategy buys gold steadily to balance your portfolio and reduce risks.
Don’t delay: Consult a financial advisor right away. Review SEC guidelines on gold in IRAs to unlock tax benefits before regulations shift.
Exciting potential awaits-act now!